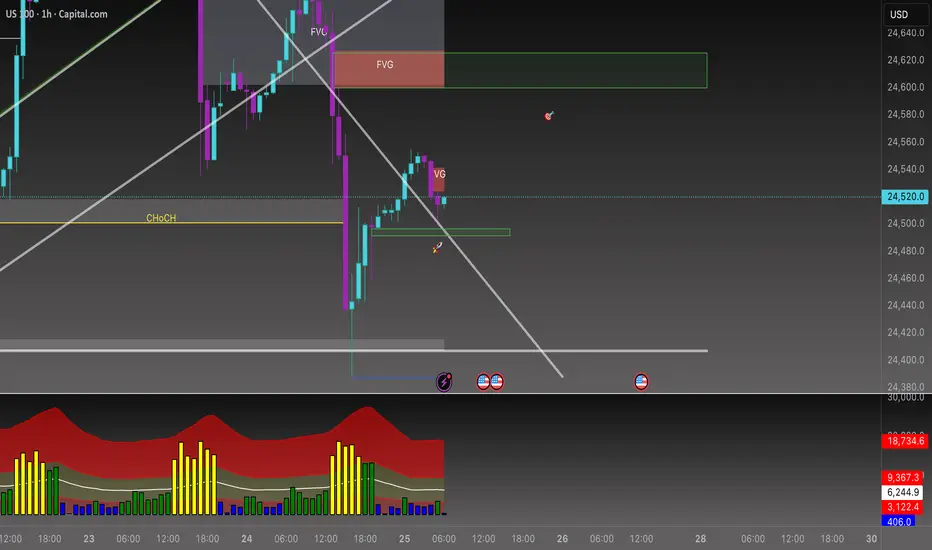
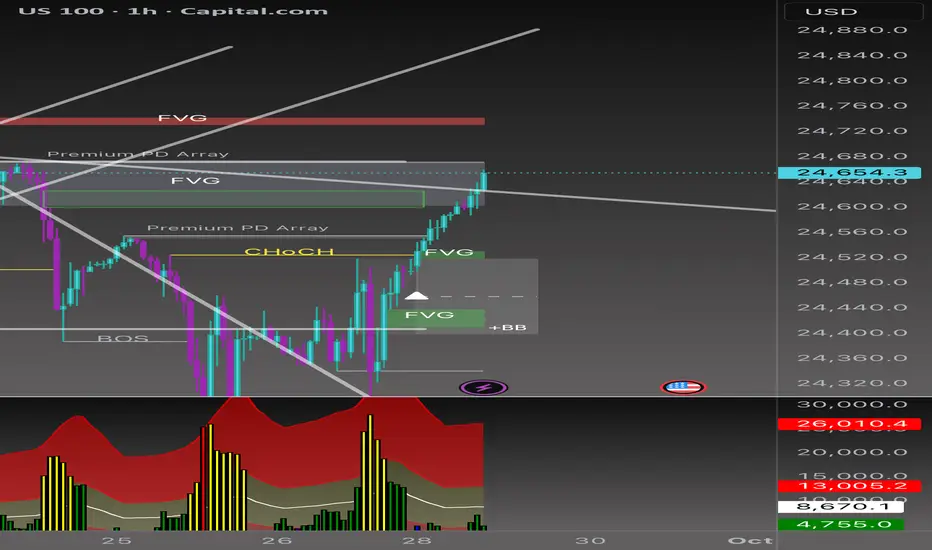
Beyond the Chart - NAS100 Through Technicals & FundamentalsNAS100 has just completed its move into the Discount PD Array zone I highlighted yesterday. On the 1H timeframe, I pointed out the prevailing bearish trend and marked this area as a key target. Once price tapped the zone, sellers lost momentum and buyers stepped in, shifting market control.
Now we’re seeing an inverse Z formation, with a Fair Value Gap (FVG) and a Breaker Block (BB) cutting across the structure. If buyers step in again, as they did in the earlier PD Array, my upside target will be 24,580.
USTEC.F trade ideas
NAS100We looking for buying opportunities as the market is now in a continuous momentum to the upside resulting in buying opportunities|30 MIN TIMEFRAME

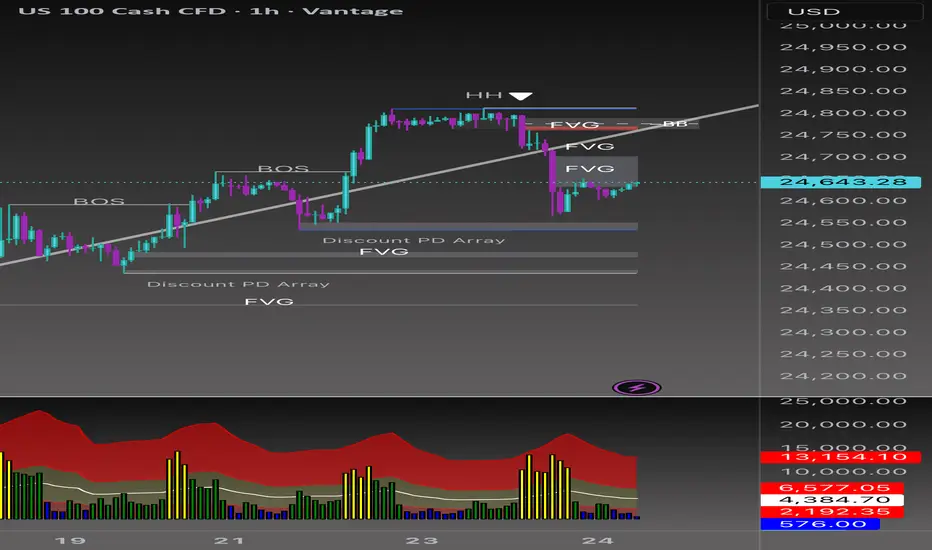
Beyond the Chart - NAS100 Through Technicals & Fundamentals📉 NAS100 VANTAGE:NAS100
Short Bias Analysis (1H Chart)
The market recently formed a Higher High (HH) followed by a Break of Structure (BOS) to the downside, suggesting a potential bearish shift. This move left behind multiple Fair Value Gaps (FVGs), now acting as supply zones.
Key Points
• Liquidity grab above the HH, followed by strong bearish momentum.
• Two FVGs aligning with short bias.
• Current retracement into inefficiencies offers a potential short entry.
• Downside targets: Discount PD Array and lower FVGs (24,480–24,440).
Trade Idea
• Entry Zone: 24,700–24,750 (upper FVG)
• Stop Loss (SL): Above 24,800 (invalidates bearish idea)
• Take Profit 1 (TP1): 24,560
• Take Profit 2 (TP2): 24,440
Risk management remains key 🔑 if price closes above the upper FVG/BB zone, short bias is invalidated.

SHORT ON NASNAS has created a nice rising channel (bearish reversal pattern) and is starting to push outside of the channel to the downside.
I will be selling nas to the previous low looking to catch 800-900 points.

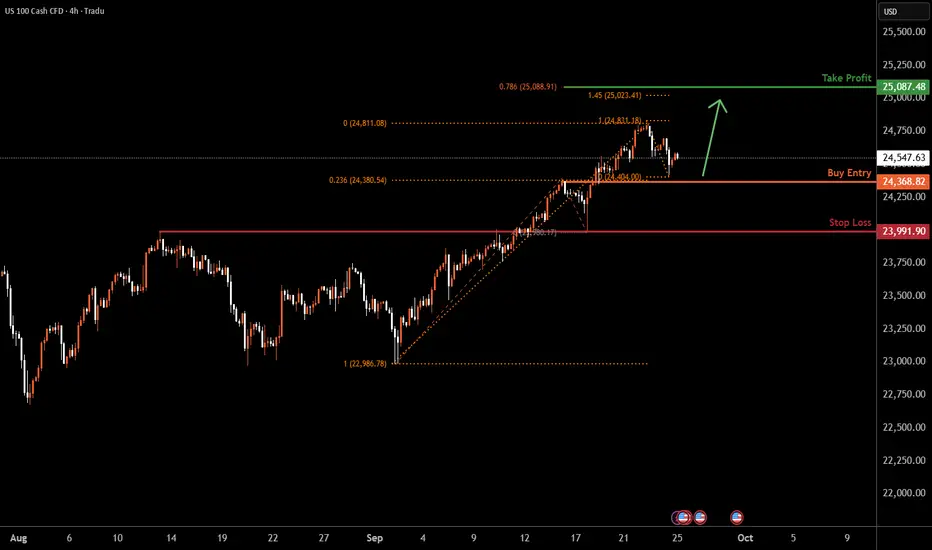
NAS100 H4 | Bullish momentum to extend?NAS100 is falling towards the buy entry at 24,368.82, which is a pullback support that aligns with the 23.6% Fibonacci retracement and could bounce from this level to the upside.
Stop loss is at 23,991.90, which is an overlap support.
Take profit is at 24,087.48, which aligns with the 78.6% Fibonacci projection and the 161.8% Fibonacci extension.
High Risk Investment Warning
Trading Forex/CFDs on margin carries a high level of risk and may not be suitable for all investors. Leverage can work against you.
Stratos Markets Limited (tradu.com ):
CFDs are complex instruments and come with a high risk of losing money rapidly due to leverage. 65% of retail investor accounts lose money when trading CFDs with this provider. You should consider whether you understand how CFDs work and whether you can afford to take the high risk of losing your money.
Stratos Europe Ltd (tradu.com ):
CFDs are complex instruments and come with a high risk of losing money rapidly due to leverage. 66% of retail investor accounts lose money when trading CFDs with this provider. You should consider whether you understand how CFDs work and whether you can afford to take the high risk of losing your money.
Stratos Global LLC (tradu.com ):
Losses can exceed deposits.
Please be advised that the information presented on TradingView is provided to Tradu (‘Company’, ‘we’) by a third-party provider (‘TFA Global Pte Ltd’). Please be reminded that you are solely responsible for the trading decisions on your account. There is a very high degree of risk involved in trading. Any information and/or content is intended entirely for research, educational and informational purposes only and does not constitute investment or consultation advice or investment strategy. The information is not tailored to the investment needs of any specific person and therefore does not involve a consideration of any of the investment objectives, financial situation or needs of any viewer that may receive it. Kindly also note that past performance is not a reliable indicator of future results. Actual results may differ materially from those anticipated in forward-looking or past performance statements. We assume no liability as to the accuracy or completeness of any of the information and/or content provided herein and the Company cannot be held responsible for any omission, mistake nor for any loss or damage including without limitation to any loss of profit which may arise from reliance on any information supplied by TFA Global Pte Ltd.
The speaker(s) is neither an employee, agent nor representative of Tradu and is therefore acting independently. The opinions given are their own, constitute general market commentary, and do not constitute the opinion or advice of Tradu or any form of personal or investment advice. Tradu neither endorses nor guarantees offerings of third-party speakers, nor is Tradu responsible for the content, veracity or opinions of third-party speakers, presenters or participants.
US100 Swing trade Sell position
Bearish pattern formed at the top.
Take-profit (TP) is defined on the chart.
If you wish to hold further, move stop-loss (SL) to breakeven.

Nas100 Trade Set Up Sep 25 2025Price is clearing in a bearish trend now with price breaking PDL, SSL and daily FVG so i will look for sells from the 1h FVG towards lower SSL
www.tradingview.com

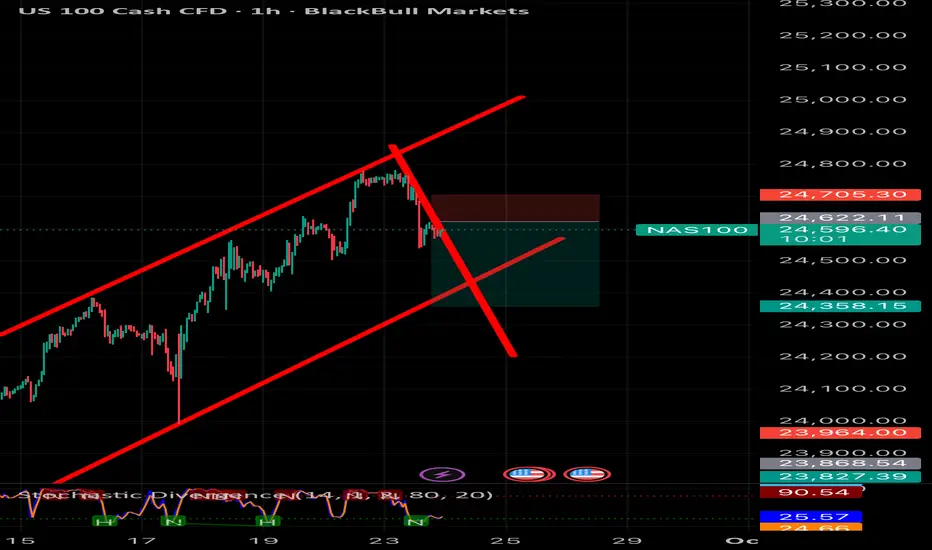
NAS100 rising wedge breakdown short setup The NAS100 recently broke down from a rising wedge formation on the 1H chart, signaling potential bearish momentum. After failing to hold above 24,700, price rejected the upper channel and is now trading below the wedge support.
Here’s my thought process:
• Pattern: Rising wedge, a bearish reversal pattern.
• Rejection Zone: Price failed at 24,705 resistance, confirming sellers stepped in.
• Breakdown Confirmation: A clean break below wedge support increases bearish bias.
NasdaqNasdaq breaking 24500 pulled back to the 2-day average and returned below this level, we can see a sharper drop to the support region 24100 and 24200

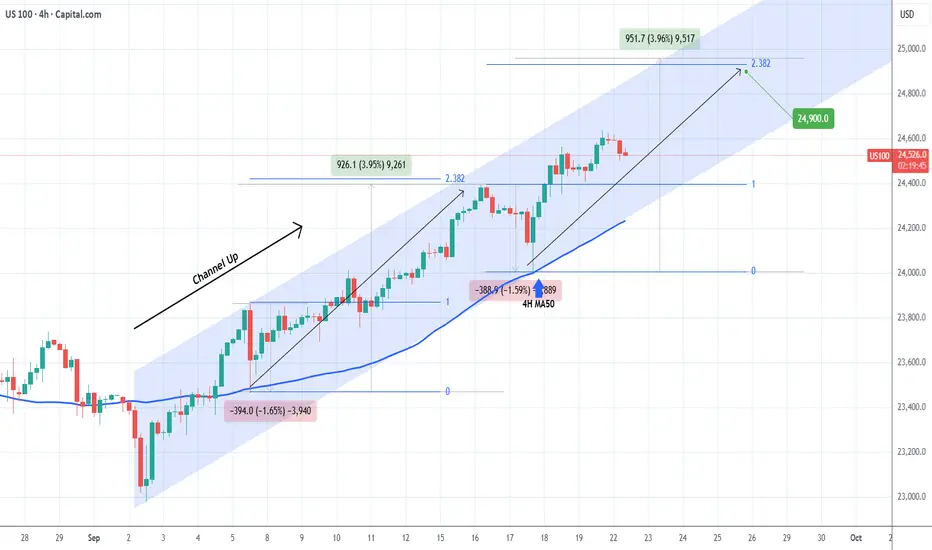
NASDAQ September's Channel Up targets 24900.Nasdaq (NDX) has been trading within a Channel Up since the September 02 Low and at the moment it is unfolding its 2nd Bullish Leg following the 4H MA50 (blue trend-line) bounce on September 17.
Based on the previous 4H MA50 Bullish Leg, the sequence should peak below the 2.382 Fibonacci extension at a maximum +3.96% rise. Our Target is slightly below those at 24900.
-------------------------------------------------------------------------------
** Please LIKE 👍, FOLLOW ✅, SHARE 🙌 and COMMENT ✍ if you enjoy this idea! Also share your ideas and charts in the comments section below! This is best way to keep it relevant, support us, keep the content here free and allow the idea to reach as many people as possible. **
-------------------------------------------------------------------------------
💸💸💸💸💸💸
👇 👇 👇 👇 👇 👇
Strong Short Order signalShort signal liquidity grab means there are buy stop orders executed/triggered by the smart money to provide liquidity for the reversal.
As long as it's closing under the previous swing high, the situation all good.

Beyond the Chart - NAS100 Through Technicals & FundamentalsThe trendline I drew last week played out perfectly. Price has carved out a fresh trend on the lower timeframe and is breaking to the upside. But the real confirmation comes only if the FVG is fully filled and we get a strong bullish close above 24,700.
NASDAQ Daily Analysis 📊
👉Hold above 24,500 – 24,520 → BUY targeting 24,700 (upper FVG). Break & hourly close above 24,700 → room to push toward 24,850 – 24,900.
👉24,700 – 24,750 → strong SELL zone (Premium PD Array + FVG overlap). First downside target: 24,400 – 24,350.
⚡️Bottom line:
• Bullish case→ If inflation comes in lower and the Fed takes a softer tone → buyers could step in and push levels higher.
• Bearish case → If data runs hot and the Fed signals more tightening → selling pressure kicks in, and your short levels become key.
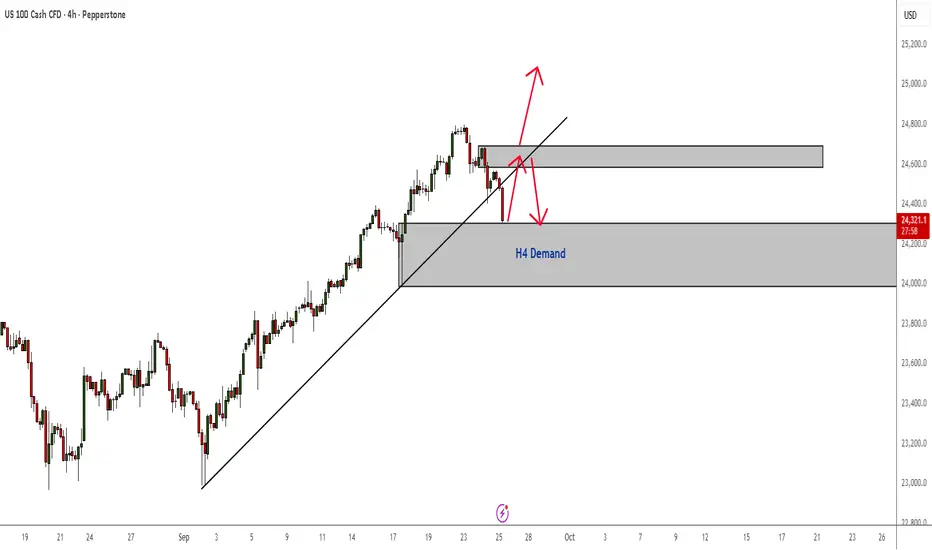
NAS100 Price has dipped into an H4 Demand Zone Price has now retested a demand zone. Look for long confirmations from here. If it reaches supply or retests that broken trendline and gives sell confirmations, then we will short it. However, if momentum to the upside continues, then we long to new ATHs.
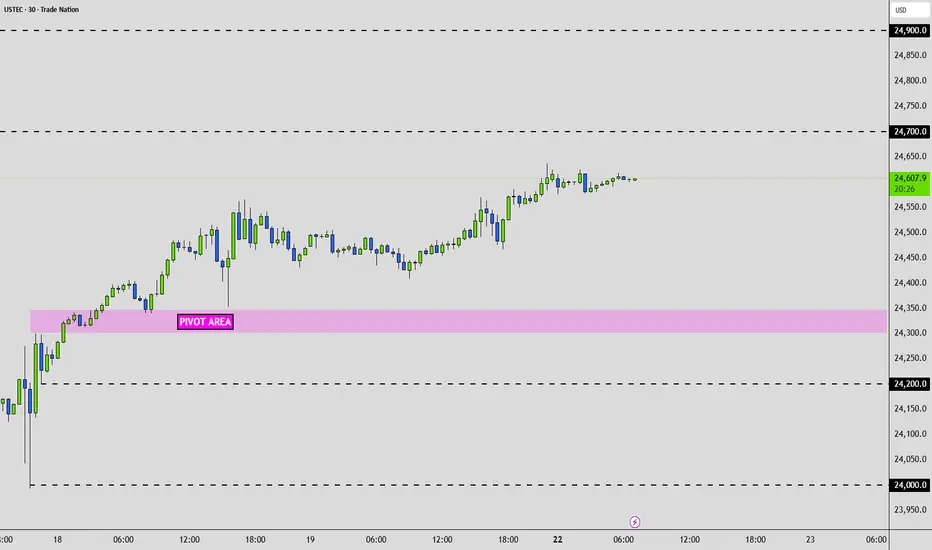
USTEC - Trading Edge TodayDear Friends in Trading,
🎯Trading Edge:
Tech leading breakout momentum with institutional accumulation above POC
Key Level: 24,800 (volume gap fill)
Pivot: 24,650 – 24,700
Bias: Bullish above pivot
Bull target: 24,800 → 25,000
Bear target: 24,600 → 24,400
Correlation: +88% with US30, +52% with Gold (Fed trade)
Risk Assets Alignment:
GOLD🔄USTEC🔄US30
✅Gold + USTEC + US30 all bullish above pivots = Fed dovish trade confirmed
✅Unusual Gold/equity positive correlation suggests monetary policy driving both higher
Assets Overbought:
🔴USTEC - 4HR Overbought Divergence Detected
I sincerely hope my point of view offers a valued insight.
Thank you for taking the time study my analysis.

Shall Nasdaq keep going with correction phase?US100 index being in correction phase, shall it continue? Share your idea trader!
Nasdaq - USTEC: Trading Edge TodayDear Friends in Trading,
Experimental Test Phase Week:
Correlation Logic & Daily Efficiency - GOLD🔄NASDAQ🔄DOW JONES
🔎 Previous Week Observations -
Strong accumulation & clustered trading between 24,300 – 24,350.
This is where most volume likely sat (clustered POC zone).
Breakout above 24,400 carried price strongly higher.
Current price (~24,615) is sitting above last week’s value area, riding momentum.
USTEC - 22Sept:
Pivot: 24,300 – 24,350
Bias: Bullish while above pivot
Bull targets: 24,700 → 24,900
Bear targets: 24,200 → 24,000
👉 Nasdaq leading tech momentum.
Stronger risk appetite = supports US30 as well, usually opposite Gold.
I sincerely hope my point of view offers a valued insight.
Thank you for taking the time study my analysis.
NASDAQ US100 Long
Entry Zone: 24,542.
Stop-Loss: 24,360
Take-Profit: 24,717
Risk (Stop distance): ~182 points (24,542 – 24,360).
Reward (Target distance): ~175 points (24,717 – 24,542).
RSI Trend: Recently dipped sharply, showing selling pressure, but possible rebound if support holds. Price is respecting a long-term trendline.
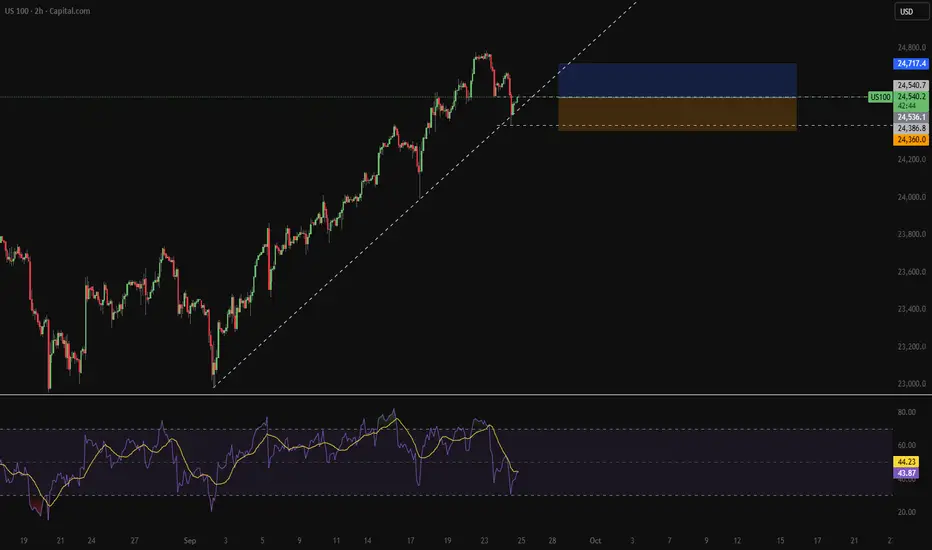
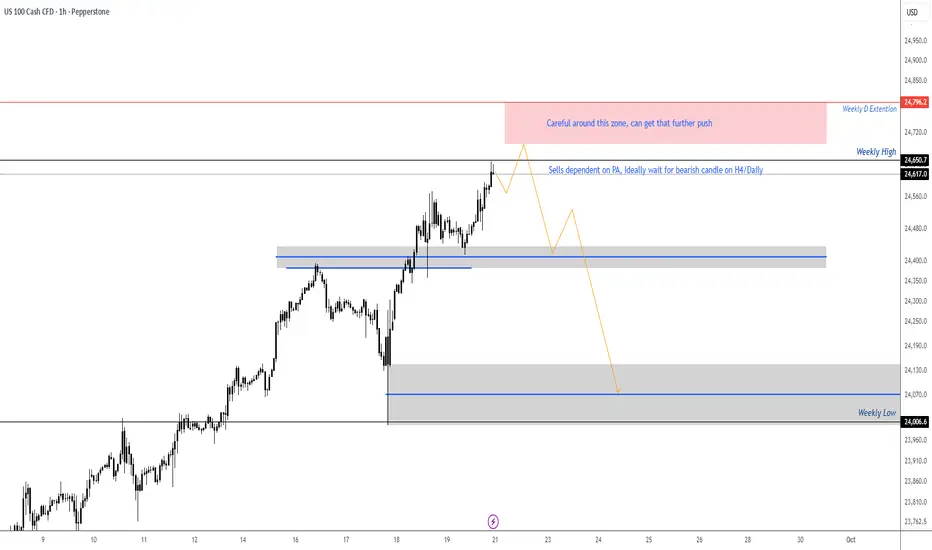
NASDAQ - setting up for Bearish SetupLooking for the bearish signal or the H4/Daily time frame, might get that final push for the D extension on the weekly timeframe, opening of the week might get a small pullback then continuation to the upside. Trade will be validated only if we get bearish PA setup on the H4/Daily. Looking for the setup to create a turn shape then can look for potential entries. If price does not present a bearish setup on the H4/Daily then the plan is no longer valid.
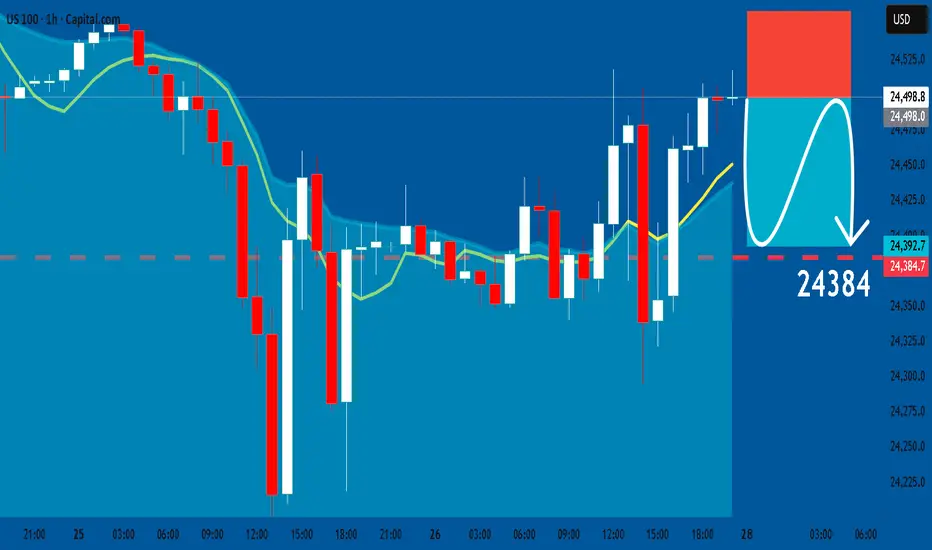
US100: Short Trade Explained
US100
- Classic bearish pattern
- Our team expects retracement
SUGGESTED TRADE:
Swing Trade
Sell US100
Entry - 24498
Stop - 24559
Take - 24384
Our Risk - 1%
Start protection of your profits from lower levels
Disclosure: I am part of Trade Nation's Influencer program and receive a monthly fee for using their TradingView charts in my analysis.
❤️ Please, support our work with like & comment! ❤️
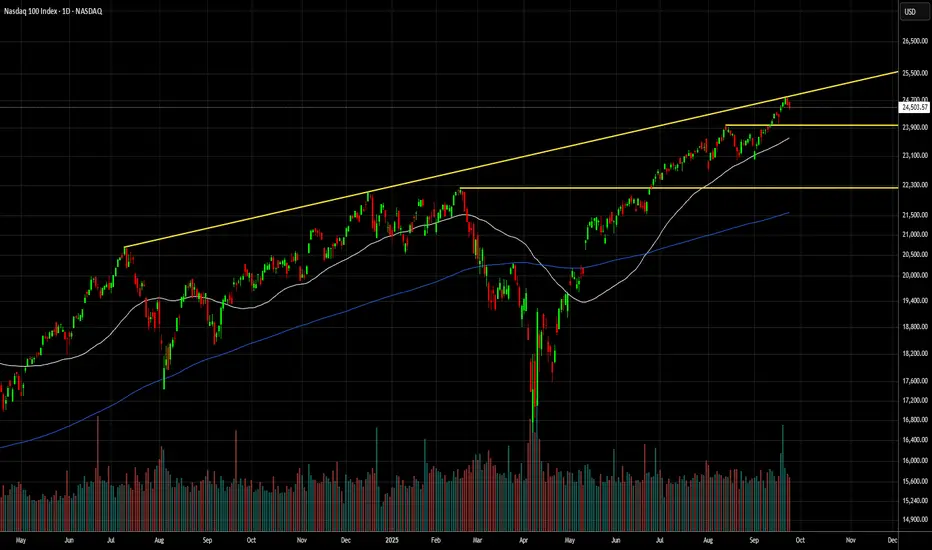
NASDAQ index- Correction alertThe price has reached the yellow trendline, and in the previous two instances this led to significant short-term corrections:
📉 July 2024: -15.6%
📉 December 2024: -7.1%
Currently: optimistic correction target at 23,970 (-3.2%), and if that doesn’t hold – strong support at 22,223 (-10.2%).
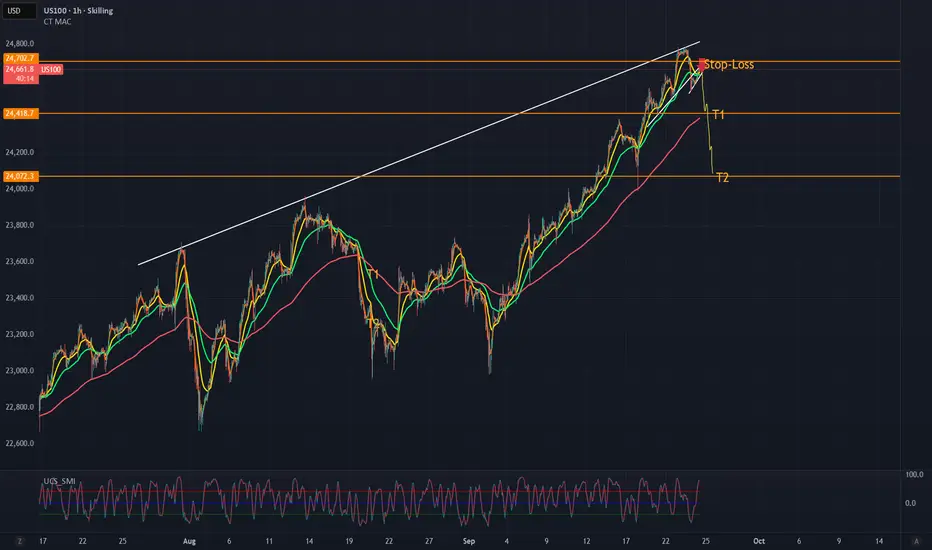
NASDAQ (US100) - ShortNasdaq (US100) currently trading at 24662.
We reached a high at 24767 and from there got a rejection. Multiple reasons here now for a continuation to the down side.
Entry: In rising channel at current levels.
Stop Loss: 24702
T1: 24418
T2: 24072
I'm expecting to see a break of this rising channel soon, may get some retest of the upper line till then which are great entry points.
No trading advise, just my opinion. Have fun.
short nas2 news today, if news hasn't come out, i think this is worth a short for 1 order. there's volume in entry area. can increase the sl abig higher for lower risk and lower RR.
