US30 showing signs of potential bullish momentumThe US30 index is currently in a phase of price consolidation, showing signs of potential bullish momentum. The recent strong upward movement indicates that buyers are regaining control, and there’s a possibility of further growth continuation if bullish momentum sustains.
On Wednesday, Wall Street

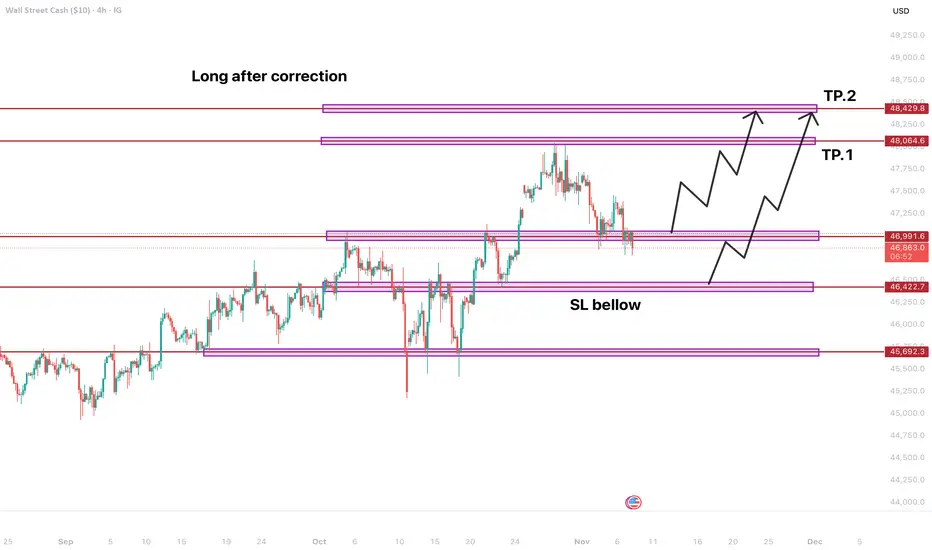
US 30 should soon to go upafter a healthy correction US 30 should make new highs.
Already according with levels of support we have to be careful when 'Market Makers" will start to buy the dip
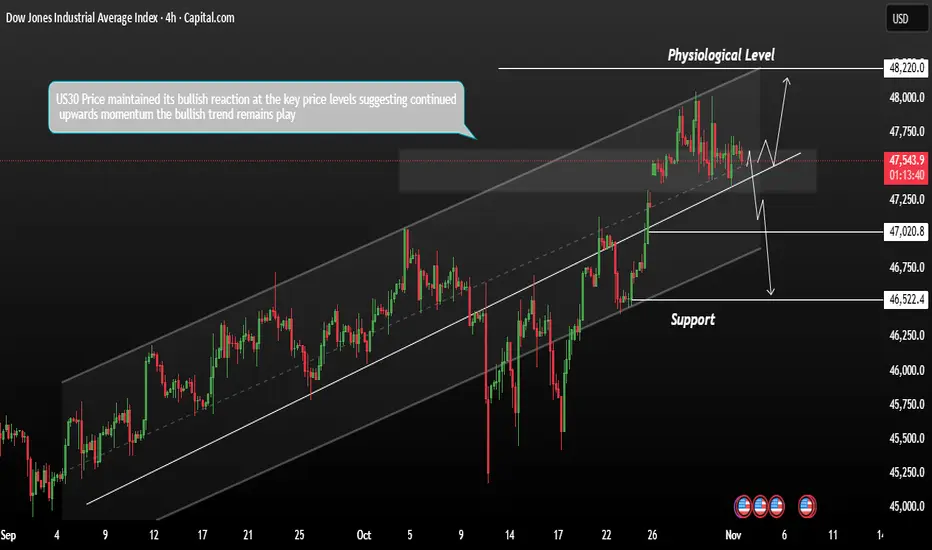
US30 Technical Outlook – Bullish Momentum IntactThe US30 maintained its bullish reaction at key price levels, suggesting continued upward momentum. As November begins, the index futures gained on Monday, supported by optimism around U.S.–China trade relations and stronger demand sentiment.
Currently, the bullish trend remains in play. If price c
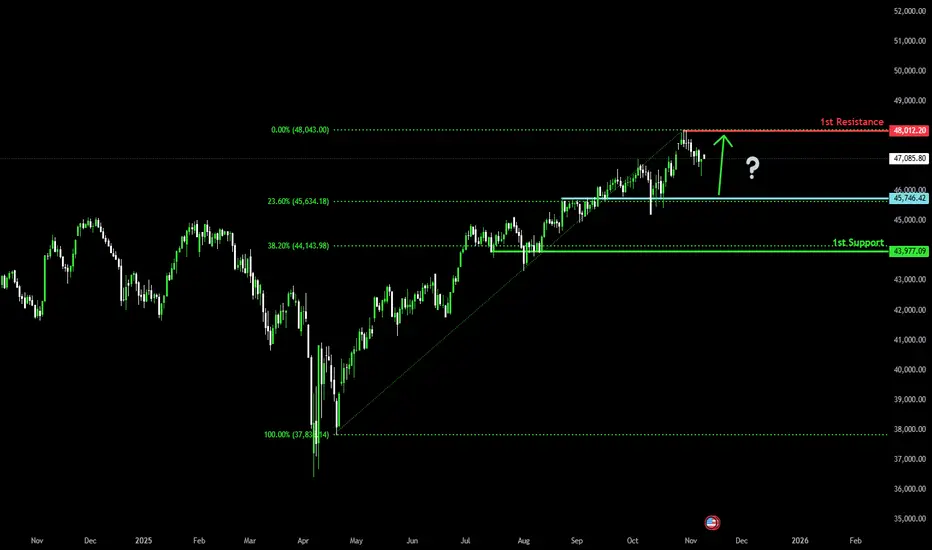
Bullish continuation setup?The Dow Jones (US30) is declining toward the pivot level, which is an overlap support aligned with the 23.6% Fibonacci retracement. A potential rebound toward the recent swing high resistance could occur from this area.
Pivot: 45,746.42
1st Support: 43,977.09
1st Resistance: 48,012.20
Disclaimer
Market correction, filling gaps and money shiftIt is expected and have been waiting for it for few weeks.
the market needs to correct itself by:
- Institutions and large funds (market makers) to exit from high tech AI and overvalued stocks and leave them to bag holders.
- They already shorted the large AI stocks so they will make money anyway.
-

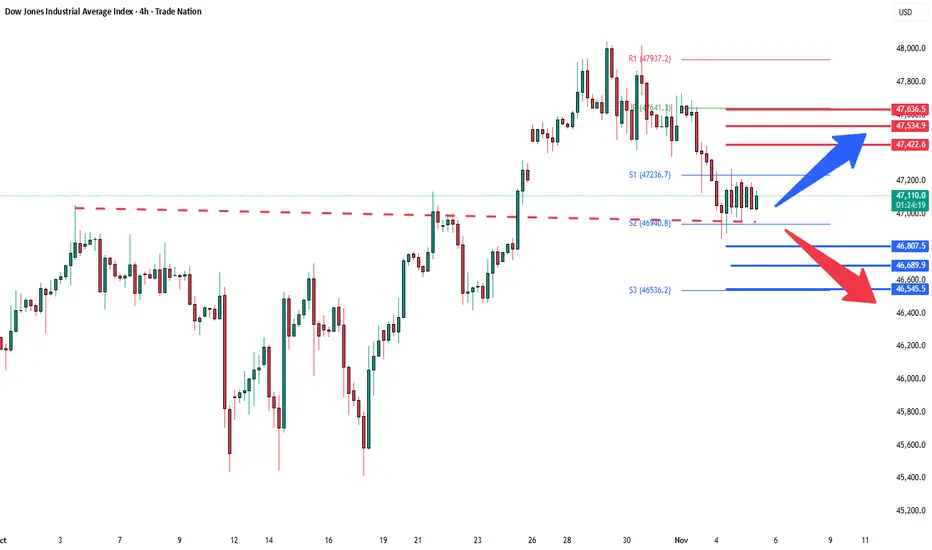
DowJones strong support retest Key Support and Resistance Levels
Resistance Level 1: 47433
Resistance Level 2: 47534
Resistance Level 3: 47636
Support Level 1: 46807
Support Level 2: 46690
Support Level 3: 46545
This communication is for informational purposes only and should not be viewed as any form of recommendation as
Golds overperformance relative to the Dow will be dramatic !!The place to invest during the following decade is gold!!
The Dow Jones is projected to lose 96% relative to gold from now until August 2036!! (if history repeats itself as it did in 1968-1980).
In 12 years time, the DOW to GOLD ratio is expected to reach 0.44.
By 2026, we will be able to sell

Is a Market Correction Coming? 10 Warning Signs You Can’t Ignore🚨 Markets look euphoric… but data says otherwise.
Hello @TradingView users, hope you are doing well
Here are 10 reasons why we think a sharp pullback could be near
(Not financial advice — just signals stacking up.)
1) Record yield-curve inversion: The 10y–2y spread was negative for a record ~7

DOW JONES recovered and is looking for a High at 48500.Exactly 2 weeks ago (October 22, see chart below), we gave a strong Buy Signal on Dow Jones (DJI), as the index had already initiated the new Bullish Leg of its 6-month Channel Up and quickly hit our 47700 Target:
That trading plan included a 2nd Target as well at 48500, which represented a +7.

US30: Bulls Are Winning! Long!
My dear friends,
Today we will analyse US30 together☺️
The recent price action suggests a shift in mid-term momentum. A break above the current local range around 47,172.59 will confirm the new direction upwards with the target being the next key level of 47,302.90 and a reconvened placement

See all ideas
Displays a symbol's price movements over previous years to identify recurring trends.
Frequently Asked Questions
Wall Street 30 Cash reached its highest quote on Oct 29, 2025 — 48,041.80 USD. See more data on the Wall Street 30 Cash chart.
The lowest ever quote of Wall Street 30 Cash is 28,609.60 USD. It was reached on Oct 12, 2022. See more data on the Wall Street 30 Cash chart.
Wall Street 30 Cash is just a number that lets you track performance of the instruments comprising the index, so you can't invest in it directly. But you can buy Wall Street 30 Cash futures or funds or invest in its components.