USNAS100 | Fed Uncertainty & Data Releases Drive Market SetupUSNAS100 – Technical Overview
Risk assets are showing renewed signs of recovery on Wednesday after the broad selloff that began the month, though bonds continue to hold their recent losses.
The U.S. dollar is also easing as attention shifts back to the Federal Reserve, with markets reacting to President Trump’s decision to delay naming the next Fed Chair until 2026.
With the November Nonfarm Payrolls report still pending, investors will closely watch today’s data releases for direction:
Key Events Today
- ADP National Employment Report (November)
- U.S. Industrial Production (September)
- ISM Services PMI (November)
- S&P Global Services & Composite PMIs (Final, November)
Technical Analysis
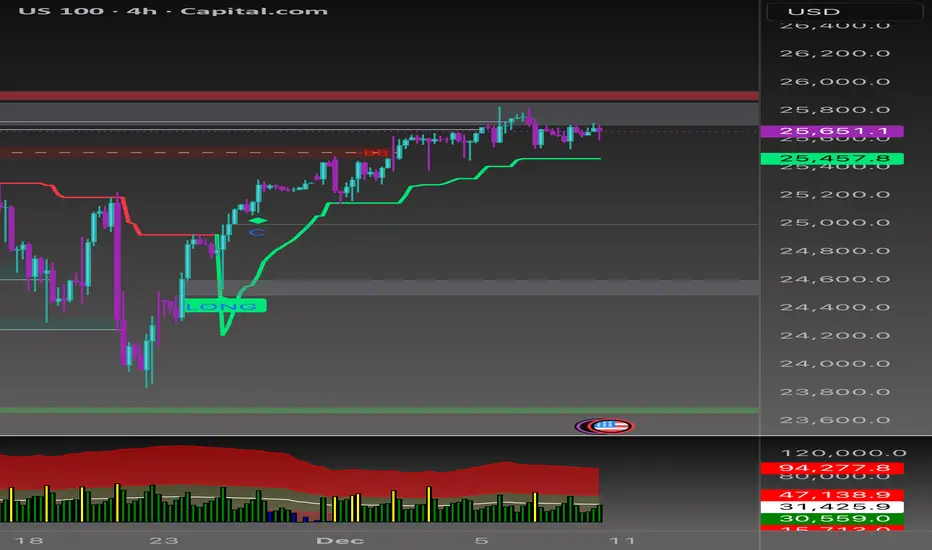
USNAS100 maintains bullish momentum as long as the price trades above 25570, with upside targets at 25730 and 25980.
A breakout above 25980 could extend the rally toward 26170.
However, a 1H close below 25570 will trigger a corrective move toward 25430, with deeper downside potential into the 25210 support zone.
Key Levels
Pivot Line: 25570
Resistance: 25730 · 25980 · 26170
Support: 25430 · 25210
Trade ideas

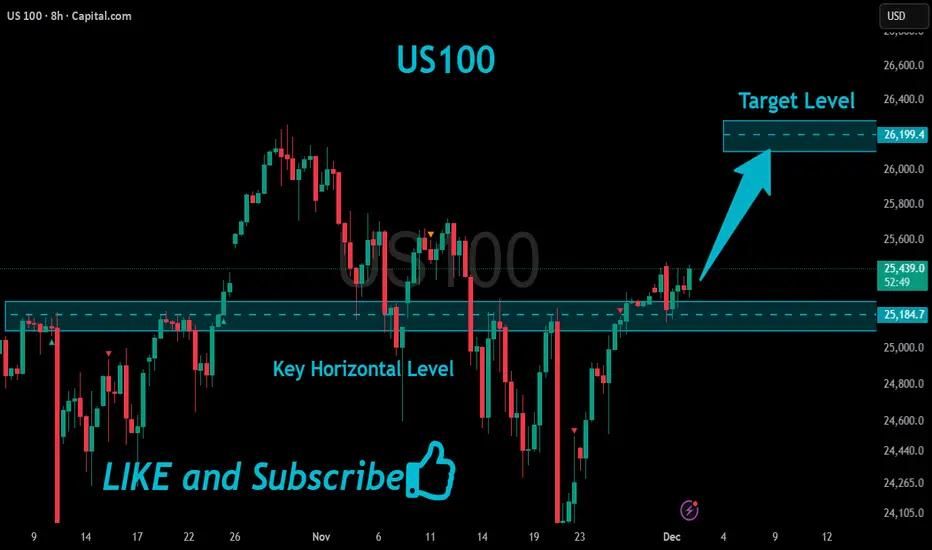
US100 Bullish Breakout!
HI,Traders !
#US100 is going up now
And made a bullish
Breakout of the key horizontal
Level of 25184.7 and the breakout
Is confirmed so we are bullish
Biased and we will be
Expecting a further
Bullish move up !
Comment and subscribe to help us grow !
US NAS 100DO YOU KNOW WHATS BEHIND THIS OR OTHER IDEAS?? in bio..
Preferably suitable for scalping and accurate as long as you watch carefully the price action with the drawn areas.
With your likes and comments, you give me enough energy to provide the best analysis on an ongoing basis.
And if you needed any analysis that was not on the page, you can ask me with a comment or a personal message.
Enjoy Trading ;)

NAS100How to become successful in forex and stock trading: 1.Master fundamentals and technical analysis. 2,Build and follow a solid trading plan. 3.Apply strict risk management (1–2% rule). 4.Stay disciplined—control fear and greed. 5.Record and analyze every trade. 6.Focus on high-quality setups only. 7.Diversify across assets and markets. 8.Keep evolving—study, adapt, and grow daily.
USNAS100 consolidating within a bearish trendThe USNAS100 is currently consolidating within a bearish trend. Wall Street’s main indexes are expected to open lower on Monday as investors move to the sidelines ahead of key economic data and a closely watched speech from Federal Reserve Chair Jerome Powell. Markets are looking for clues regarding the Fed’s policy direction later this month.
From a technical perspective, US100 remains vulnerable to further downside If price closes below 24,990 and holds beneath this level, bearish momentum is likely to continue. In that scenario, the next support zones lie at: 24,800 TO 24,200
You may find more details in the chart.
Trade wisely best of luck buddies.
Ps; Support with like and comments for better analysis Thanks for supporting.

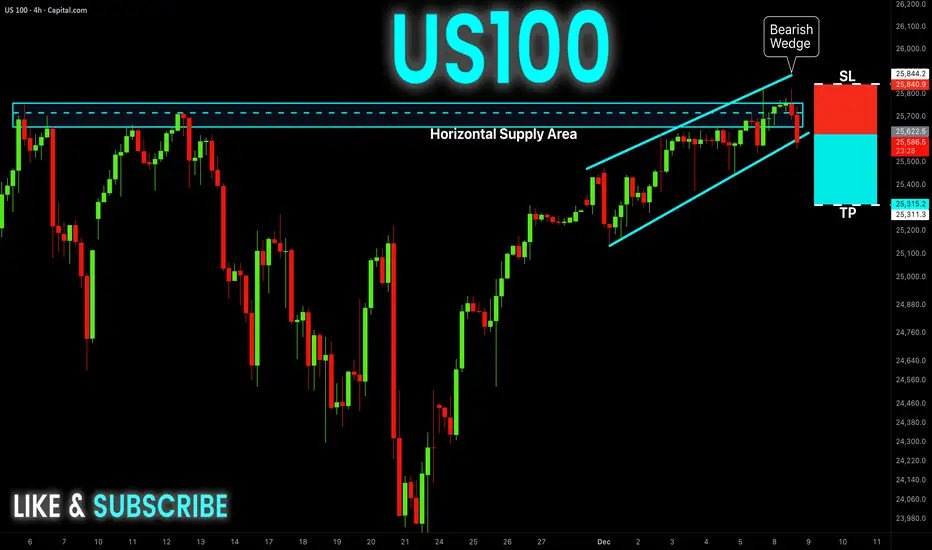
US100 Free Signal! Sell!
Hello,Traders!
US100 has rejected a major supply zone while breaking down from a bearish wedge, sweeping buy-side liquidity before shifting order-flow bearish. This SMC structure signals distribution at premium and a move toward discount levels below.
--------------------
Stop Loss: 25840
Take Profit: 25315
Entry: 25622
Time Frame: 4H
--------------------
Sell!
Comment and subscribe to help us grow!
Check out other forecasts below too!
Disclosure: I am part of Trade Nation's Influencer program and receive a monthly fee for using their TradingView charts in my analysis.
NAS100 Trade Set Up Dec 10 2025Price has swept PDH in Asia session then swept Asia lows in London now i will expect price to sweep London highs and/or tap into supply to then continue its bearish trend to PDL and demand

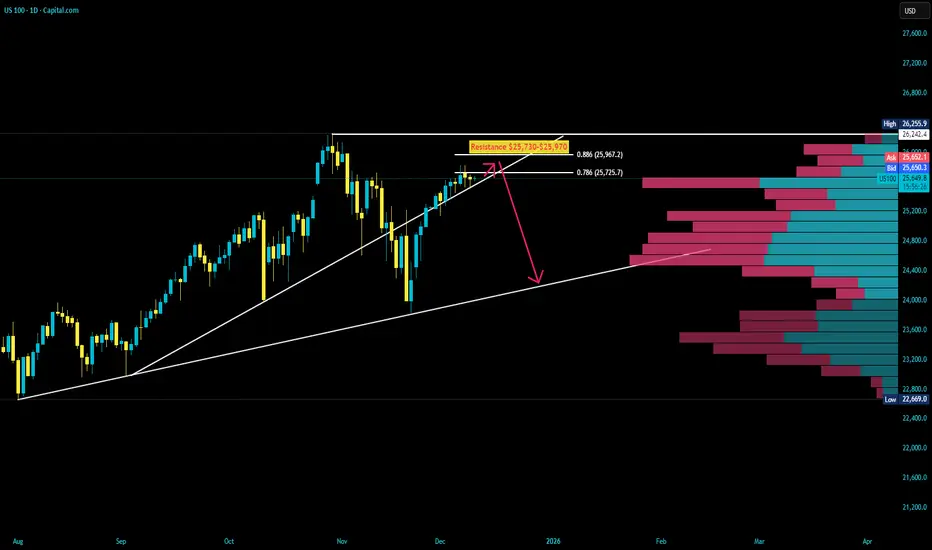
US100 Resistance AheadUS100: Tough resistance zone at 25,730–25,970. If price fails to hold above 25,730 after today’s FOMC decision, a sharp sell-off toward 24,200 becomes highly probable.
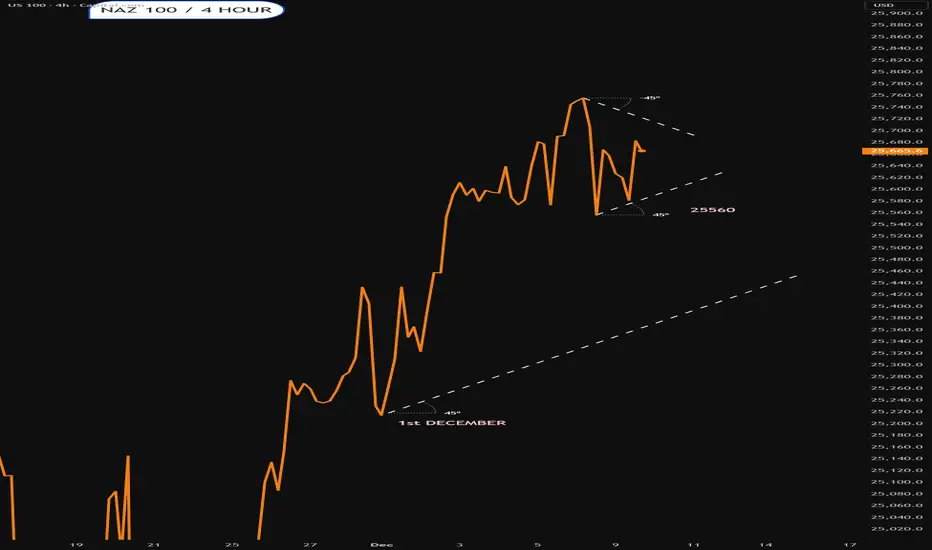
Distribution or Reload?CAPITALCOM:US100 keeps grinding inside the same premium band we’ve been tracking.
The 4H chart shows price repeatedly tapping into the premium PD arrays but failing to secure a clean breakout. Buyers are active, but they’re not strong enough to reclaim the upper liquidity shelf.
Your OG system reacted cleanly again:
• TrendMaster (4H) held as dynamic support on every dip, but it’s starting to flatten, showing we’re consolidating at the top.
• FlowMaster is printing reduced momentum on the latest pushes into premium zones.
• ScalpMaster (15M) nailed the intraday rejection perfectly, marking early short signals right after the PD Array tap.
Overall, price is respecting every OG zone point to point.
🟣 Short-Term View (15M–1H)
Structure is still choppy inside the premium band, but intraday momentum favors a corrective move.
Short bias unless 25,700 is reclaimed with strength.
Targets to the downside:
• 25,640
• 25,610
• 25,580 liquidity pocket
Invalidation
• A clean break and hold above 25,700 would switch intraday flow back into premium expansion.
🔵 Mid-Term View (4H)
Higher-timeframe trend remains bullish overall, but we’re extended into premium territory and showing early signs of distribution.
As long as TrendMaster holds above
25,450–25,500, bulls maintain control
on the midterm.
A deeper pullback into discount arrays would actually be healthy before the next leg up.
Midterm targets if discount is tapped:
• 25,300
• 25,150
• 25,000 major demand zone
A breakout above 25,780 would unlock continuation toward new highs.
📌 Summary
US100 is compressing at the top.
Your OG system is showing exhaustion on premium taps, favoring short term corrections while the mid term trend stays bullish until key support breaks.
Perfect environment for reactive trading:
Fade premiums intraday, accumulate in discounts on the HTF.
Nasdaq : 24,000 Holds Strong — Next Stop 25,800?Price action on the Nasdaq 100 is telling a clear story: 24,000 (AVWAP + HVN confluence + Round number) is acting like a magnet for institutional buyers.
This suggests that accumulation is happening at these levels, positioning for a potential run toward 25,800 if momentum holds.
Are we front-running a breakout, or should we wait for confirmation above 25,000 first?

NASDAQ SHORT VERY BEARISHTri-star doji printed, a rare and strong reversal pattern - extremely bearish.

NQ LongsStill in a bullish uptrend, Sweep of lows yesterday and momentum sustained towards the end of the day. Ideally, price should come to take Asia Lows and then move higher to take the most recent highs.
If we continue to move higher through London, I'll be watching previous highs as an area of interest for shorts In NY session.

NSDQ100 positive lead from futures and improving risk sentimentUS markets saw a modest risk-on tone yesterday as stronger-than-expected labour data pushed investors to price in fewer Fed rate cuts for next year. That supported equities, with the S&P 500 extending its winning streak, and futures are pointing to further upside this morning. This provides a supportive near-term backdrop for the Nasdaq 100 into today’s session.
However, the hawkish repricing in rates is a growing headwind for tech. The 10-year Treasury yield rose to a two-week high of 4.10%, and global bond yields continued to climb, amplified by renewed expectations of a Bank of Japan rate hike. Rising long-end yields typically pressure rate-sensitive growth stocks, which could cap upside in the Nasdaq despite positive futures.
The drop in jobless claims to 191k reinforces the view that the US labour market remains resilient, supporting risk appetite but also reducing the urgency for Fed easing. That combination often favours cyclicals over long-duration tech when yields are rising.
On the corporate side, Netflix is in focus following reports of exclusive talks to acquire Warner Bros. Discovery’s studios and HBO Max. This could drive sector-specific volatility across streaming and media names, with potential spillovers into Nasdaq sentiment.
Broader risk sentiment remains constructive, with the VIX slipping to a two-month low, and the continued rally in US transport stocks signalling confidence in economic momentum. That supports equities overall, but the Nasdaq’s direction today is likely to hinge on bond yields:
Stable or lower yields would allow tech to participate in the broader rally.
Further yield upside risks triggering profit-taking in mega-cap growth.
Bottom line: The Nasdaq 100 opens with a positive lead from futures and improving risk sentiment, but rising global bond yields remain the key short-term risk to sustained upside. Streaming and large-cap tech could see elevated volatility today.
This communication is for informational purposes only and should not be viewed as any form of recommendation as to a particular course of action or as investment advice. It is not intended as an offer or solicitation for the purchase or sale of any financial instrument or as an official confirmation of any transaction. Opinions, estimates and assumptions expressed herein are made as of the date of this communication and are subject to change without notice. This communication has been prepared based upon information, including market prices, data and other information, believed to be reliable; however, Trade Nation does not warrant its completeness or accuracy. All market prices and market data contained in or attached to this communication are indicative and subject to change without notice.

NAS100 Trade Set Up Dec 3 2025Price failed to create a new HH and swept PDH so i will want to see how price reacts to PDL area, if it sweeps it and make 1m-5m bullish IFVG/CISD i will look for buys but if price trades through it and makes bearish internal structure i will look for a continuation lower to SSL

Nasdaq Buy Area Buy Nasdaq once retest IFVG , Algo 2 is running in Daily time frame
expecting big candle once break this breaker

NAS100 Trade Set Up Dec 4 2025Price remains bullish breaking structure and making HH so i will want to see a tap into demand and internal 1m-5m bullish structure to take buys to BSL and daily FVG above

NAS100 Trade Opportunity: Will Buyers Defend the Pullback?📊 NAS100 (NASDAQ-100) Swing Trade Opportunity 🚀
Bullish Pullback Setup | Super Trend ATR + TMA Confirmation
🎯 TRADE SETUP OVERVIEW
Instrument: NAS100 (NASDAQ-100 Index)
Timeframe: Swing Trade (4H-Daily)
Bias: BULLISH ✅
Setup Type: Super Trend ATR Line Pullback + Triangular Moving Average (TMA) Confirmation
🎬 ENTRY STRATEGY - "LAYERING METHOD" 📍
This strategy employs multiple limit order placement (Layer Entry Technique) to optimize entry points during the pullback phase.
Recommended Layer Entry Points:
🔵 Layer 1: 24,500
🔵 Layer 2: 24,600
🔵 Layer 3: 24,700
🔵 Layer 4: 24,800
⚡ Pro Tip: Scale layers based on your account size and risk tolerance. Each layer reduces average entry price.
🛑 STOP LOSS (SL)
Primary SL Level: 24,300
Strategy: Placed below the latest swing low + Super Trend confirmation
⚠️ DISCLAIMER: This SL is a guideline only. You must adjust based on your personal risk management strategy and account equity. Risk is YOUR responsibility.
🎁 PROFIT TARGETS (TP)
PRIMARY TARGET (TP1): 25,700 🎯
First resistance zone
Ideal for taking partial profits
Recommended exit: 30-50% position
SECONDARY TARGET (TP2): 26,200 🔥
Strong resistance + Historical overbought zone
⚠️ TRAP ALERT: Expect potential reversal or consolidation
Recommended exit: Remaining 50-70% position
Use trailing stop for final portion
📈 TECHNICAL CONFIRMATION
✅ Super Trend ATR: Aligned bullish
✅ TMA (Triangular MA): Pullback to key level confirmed
✅ Higher Lows Pattern: Intact
✅ Volume Analysis: Supporting move
🔗 RELATED PAIRS TO WATCH 💡
Positive Correlation (Move Together):
🔴 SPY (S&P 500 ETF) - $380-395 Range
Correlation: +0.92 | Often leads NAS100 lower-cap stocks
Key Point: If SPY breaks $390, expect NAS100 momentum confirmation
Watch for divergence signals
🔴 QQQ (Invesco QQQ Trust - Nasdaq 100 ETF) - $450-470 Range
Correlation: +0.99 | DIRECT tracking of NAS100
Key Point: Primary barometer for Nasdaq sentiment
Use for volume + volatility confirmation
🔴 TECH Sector ETF (XLK) - $205-215 Range
Correlation: +0.88 | Tech-heavy holdings overlap
Key Point: Tech rotation affects Nasdaq flow
Monitor for sector strength/weakness
Inverse Correlation (Move Opposite):
🔵 DXY (US Dollar Index) - $103-106 Range
Correlation: -0.65 | Stronger dollar = Risk-off mood
Key Point: If DXY spikes, expect NAS100 pullback extension
Monitor Fed rate expectations
🔵 TLT (20+ Year Treasury ETF) - $75-80 Range
Correlation: -0.58 | Rising yields hurt growth stocks
Key Point: Check 10Y yield trend for rate pressure
Watch Fed policy announcements
Key Monitoring Points:
📌 Earnings Season Impact: Tech earnings can create ±2% moves
📌 Fed Minutes/Announcements: Watch for rate guidance changes
📌 Market Breadth: Compare Advance/Decline lines for confirmation
📌 Volatility Index (VIX): Levels above 20 = Caution; Below 15 = Risk-on
📋 BEFORE YOU TRADE - CHECKLIST ✅
Is price currently at/near Layer 1 entry (24,500)?
Does current 4H chart show TMA pullback + Super Trend confluence?
Is volume confirming the setup?
Have you set your SL below 24,300?
Do you understand you're risking X to make Y?
Is this aligned with your trading plan?
🎓 FINAL NOTES
This is a mechanical swing trade setup designed for traders who use limit orders and layering technique. The confluence of Super Trend ATR + TMA creates higher probability entries during bullish pullbacks.
Remember: Trading involves substantial risk of loss. This idea is shared for educational analysis. Your trading decisions are YOUR responsibility alone.
Happy Trading! 🚀💎

Learn or perish Market need some liquidity in the event that we are going up and there is a lot of it down there

Naz 100Not looking too happy
Rez starts at 25.7K area
Could be just a pullback or it could be a top
Lets see what happens
NASDAQ Head and Shoulers Pattern - Strong Bearish SignalHead and Shoulders pattern has been confirmed by a break of neckline.
Catch your short entries from either above the right shoulder or when price drops below the neckline and sell to the next support zones.

US100 Daily Chart AnalysisSimilar to DJI, US100 Showing:
🔹 Price testing channel resistance
🔹 Rejection seen from the 0.786 Fibonacci retracement zone
🔹 Previous uptrend support line now acting as resistance
🔹 RSI showing early signs of exhaustion near key 60–70 zone
🔹 Bearish divergence forming potential — caution advised
All these confluences hint at a possible pause or reversal unless we get a strong breakout with volume confirmation.
#US100 #NASDAQ100 #PriceAction #RSI #Fibonacci #ChartAnalysis #TradingView #ChartsDriven

NAS100 Trade Set Up Dec 8 2025Price has tapped into supply and has swept London/Asia highs so i will wait to see if price can sweep PDH first to then look for internal 1m-5m IFVG/CISD target LRLR and SSL

Stop Loss Killers Completed – Bullish Expansion Ahead?After three consecutive Stop-Loss Killers (SLK1, SLK2, SLK3), the market appears to have flushed out remaining buyers and collected liquidity below key lows. This structure often signals the end of a manipulation phase and the beginning of a potential bullish expansion.
With the FOMC rate-cut announcement expected this evening, the market now has both structural and fundamental conditions for an upside move. If the sweep was indeed the final liquidity grab, a rally toward the upper target zone may follow next.
