$BTC - $DXY -$SPX - $NDX - $GOLD 10/12/2025 forecastAs explained,only NASDAQ:NDX should see a corrective day which got skipped on the previous day. Rest is neutral biased. Likely that CRYPTOCAP:BTC mimicks the NASDAQ:NDX price action.
Trade ideas

Nasdaq December Rally starting?Institutionals have been leaving some traces of what its about to happen. Are we ready to surf the wave?
What if it doesn't wave and it was all a bear trap?
Stay tuned!

NASDAQ SHORT VERY BEARISHTri-star doji printed, a rare and strong reversal pattern - extremely bearish.

NSDQ100 wait-and-see mode ahead of tonight’s FOMCMarkets remained in wait-and-see mode ahead of tonight’s FOMC decision, keeping equity moves muted. The S&P 500 slipped -0.09%, with futures flat this morning, signalling no strong pre-Fed risk appetite for US equities, including tech.
Key Macro Drivers for NDX
US 10yr yields rose +2.4bps to a 3-month high, continuing the global bond selloff.
Higher yields remain a headwind for long-duration tech stocks, keeping upside in the NASDAQ capped.
Australia’s 10yr yield hit a late-2023 high, confirming that the global tightening in bond markets is still broad-based.
Elsewhere, Franco-German spreads tightened, offering limited relief for global risk sentiment.
Fed in Focus
Markets are pricing a ~90% probability of a 25bp Fed rate cut tonight, which would be the third consecutive cut since September.
Since the last meeting, unemployment has risen to 4.4%, reinforcing the case for near-term easing.
However, inflation concerns are creating deep policy divisions, meaning forward guidance for 2025 is likely to remain intentionally vague.
Powell is unlikely to clearly signal additional cuts, especially with succession uncertainty growing as Kevin Hassett is seen as a leading candidate to replace him.
Implications for NASDAQ 100
Near-term direction hinges on Powell’s tone, not the cut itself.
Dovish guidance → NDX upside via yields pullback.
Cautious / inflation-focused tone → further yield pressure and likely NDX consolidation or downside.
Until the press conference, NDX is likely to remain range-bound with headline-driven volatility tonight.
This communication is for informational purposes only and should not be viewed as any form of recommendation as to a particular course of action or as investment advice. It is not intended as an offer or solicitation for the purchase or sale of any financial instrument or as an official confirmation of any transaction. Opinions, estimates and assumptions expressed herein are made as of the date of this communication and are subject to change without notice. This communication has been prepared based upon information, including market prices, data and other information, believed to be reliable; however, Trade Nation does not warrant its completeness or accuracy. All market prices and market data contained in or attached to this communication are indicative and subject to change without notice.

Nasdaq vs Silver RatioNasdaq vs Silver Ratio (Monthly Chart)
The Capital is rotating from riskier markets to hard assets
* The Nasdaq vs Silver Ratio is screaming the above statement strongly
* NASDAQ is in a bear trajectory against silver & expected to further fall 65% priced in SILVER
A further downfall in the ratio (Nasdaq vs Silver), indicating 3 possibilities:
1. Either Silver will rise further, with higher strength than the US stock markets
2. The US stock market will fall or crash
3. Both the above situations simultaneously

Anchor Candle MethodAnchor Candle Method: How To Read A Whole Move From One Bar
Many traders drown in lines, zones, patterns. One simple technique helps simplify the picture: working around a single “anchor candle", the reference candle of the pulse.
The idea is simple: the market often builds further movement around one dominant candle. If you mark up its levels correctly, a ready-made framework appears for reading the trend, pullbacks and false breakouts.
What is an anchor candle
Anchor candle is a wide range candle that starts or refreshes an impulse. It does at least one of these:
Breaks an important high or low
Starts a strong move after a tight range
Flips local structure from “choppy” to “trending”
Typical traits:
Range clearly larger than nearby candles
Close near one edge of the range (top in an up impulse, bottom in a down impulse)
Comes after compression, range or slow grind
You do not need a perfect definition in points or percent. Anchor candle is mostly a visual tool. The goal is to find the candle around which the rest of the move “organizes” itself.
How to find it on the chart
Step-by-step routine for one instrument and timeframe:
Mark the current short-term trend on higher timeframe (for example 1H if you trade 5–15M).
Drop to the working timeframe.
Find the last strong impulse in the direction of that trend.
Inside this impulse look for the widest candle that clearly stands out.
Check that it did something “important”: broke a range, cleared a local high/low, or started the leg.
If nothing stands out, skip. The method works best on clean impulses, not on flat, overlapping price.
Key levels inside one anchor candle
Once the candle is chosen, mark four levels:
High of the candle
Low of the candle
50% of the range (midline)
Close of the candle
Each level has a function.
High
For a bullish anchor, the high acts like a “ceiling” where late buyers often get trapped. When price trades above and then falls back inside, it often marks a failed breakout or liquidity grab.
Low
For a bullish anchor, the low works as structural invalidation. Deep close under the low tells that the original impulse was absorbed.
Midline (50%)
Midline splits “control”. For a bullish anchor:
Holding above 50% keeps control with buyers
Consistent closes below 50% shows that sellers start to dominate inside the same candle
Close
Close shows which side won the battle inside that bar. If later price keeps reacting near that close, it confirms that the market “remembers” this candle.
Basic trading scenarios around a bullish anchor
Assume an uptrend and a bullish anchor candle.
1. Trend continuation from the upper half
Pattern:
After the anchor candle, price pulls back into its upper half
Pullback holds above the midline
Volume or volatility dries up on the pullback, then fresh buying appears
Idea: buyers defend control above 50%. Entries often come:
On rejection from the midline
On break of a small local high inside the upper half
Stops usually go under the low of the anchor or under the last local swing inside it, depending on risk tolerance.
2. Failed breakout and reversal from the high
Pattern:
Price trades above the high of the anchor
Quickly falls back inside the range
Subsequent candles close inside or below the midline
This often reveals exhausted buyers. For counter-trend or early reversal trades, traders:
Wait for a clear close back inside the candle
Use the high of the anchor as invalidation for short setups
3. Full loss of control below the low
When price not only enters the lower half, but closes below the low and stays there, the market sends a clear message: the impulse is broken.
Traders use this in two ways:
Exit remaining longs that depended on this impulse
Start to plan shorts on retests of the low from below, now as resistance
Bearish anchor: same logic upside-down
For a bearish anchor candle in a downtrend:
Low becomes “trap” level for late sellers
High becomes invalidation
Upper half of the candle is “shorting zone”
Close and midline still help to judge who controls the bar
The structure is mirrored, the reading logic stays the same.
Practical routine you can repeat every day
A compact checklist many traders follow:
Define higher-timeframe bias
On working timeframe, find the latest clear impulse in that direction
Pick the anchor candle that represents this impulse
Mark high, low, midline, close
Note where price trades relative to these levels
Decide: trend continuation, failed breakout, or broken structure
This method does not remove uncertainty. It just compresses market noise into a small set of reference points.
Common mistakes with anchor candles
Choosing every bigger-than-average candle as anchor, even inside messy ranges
Ignoring higher timeframe bias and trading every signal both ways
Forcing trades on each touch of an anchor level without context
Keeping the same anchor for days when the market already formed a new impulse
Anchor candles age. Fresh impulses usually provide better structure than old ones.
A note about indicators
Many traders prefer to mark such candles and levels by hand, others rely on indicators that highlight wide range bars and draw levels automatically. Manual reading trains the eye, while automated tools often save time when many charts and timeframes are under review at once.
NQ is bullish.Let's see if NASDAQ is bullish. Interest rate decision is today (3pm NYT) so NASDAQ is particularly volatile today. If price can break and stay above 25867 then probably it will continue bullish. The volatility after the announcement might add fuel for it to push up further. It's a risk. Happy trading.

NAS100 Retest of POC: Bullish Break or Deeper Correction?I'm keeping a close eye on NASDAQ (NAS100) right now 📉📈. We’re seeing a deep pullback—a strong retracement that makes everyone ask the classic question:
Does this want to keep pushing lower and give us a bearish weekly candle, or is it gearing up to hold a level and rally back with the higher-timeframe trend?
For me, I’m a trend-continuation trader. Even if the weekly candle prints bearish, I’m not interested in selling into higher-timeframe strength. I’d rather stay patient and stick with the bigger trend direction 🧭.
Here’s the key level I’m watching:
If NAS100 can break back above the Volume Profile POC (Point of Control) — which is basically the high-value area acting as support right now — then I’ll be looking for long opportunities.
But if price breaks below the POC, that invalidates the idea and I’ll step aside. No need to force anything 👍.
Not financial advice ⚠️

NQ 100 Direction and indicationsWaiting for another indication or reversal from NQ.
Key Levels need to be broken or rejected to tell direction. Generally it is looking like NQ is bearish. Just need to wait for the right time to enter. No trading NQ for the rest of the week due to holidays and lack of Gov data.

NasdaqNASDAQ bounced from a strong demand zone, showing bullish momentum, as buyers step in, with key resistance levels ahead to watch for potential continuation.

Nasdaq100I'm biased for sell in Nasdaq100. Looking in the weekly TF look sell. Though for the entry I'm skeptical about it, I'm not sure if it will react to the entry area I marked which is the previous structure or it might break the previous structure first before it pushes the market for short. I'll be watching the market movement before I enter the market.

NAS100 H4 | Bullish Continuation?Momentum: Bullish
The price has bounced off the buy entry, which is a pullback support and is also trading above the Ichimoku cloud.
Buy entry:25,511.55
Pullback support
Stop loss: 25,222.42
Overlap support
Take profit: 26,202.94
Swing high resistance
High Risk Investment Warning
Stratos Markets Limited (tradu.com ), Stratos Europe Ltd (tradu.com ):
CFDs are complex instruments and come with a high risk of losing money rapidly due to leverage. 70% of retail investor accounts lose money when trading CFDs with this provider. You should consider whether you understand how CFDs work and whether you can afford to take the high risk of losing your money.
Stratos Global LLC (tradu.com ): Losses can exceed deposits.
Please be advised that the information presented on TradingView is provided to Tradu (‘Company’, ‘we’) by a third-party provider (‘TFA Global Pte Ltd’). Please be reminded that you are solely responsible for the trading decisions on your account. Any information and/or content is intended entirely for research, educational and informational purposes only and does not constitute investment or consultation advice or investment strategy. The information is not tailored to the investment needs of any specific person and therefore does not involve a consideration of any of the investment objectives, financial situation or needs of any viewer that may receive it. Past performance is not a reliable indicator of future results. Actual results may differ materially from those anticipated in forward-looking or past performance statements. We assume no liability as to the accuracy or completeness of any of the information and/or content provided herein and the Company cannot be held responsible for any omission, mistake nor for any loss or damage including without limitation to any loss of profit which may arise from reliance on any information supplied by TFA Global Pte Ltd.

NQ TOWARDS ALL TIME HIGHS Technical Analysis (Bullish Bias With Key Levels)
Nasdaq-100 futures (NQ) continue to show a bullish structure as long as price holds above the 25539 support zone. The market has been forming higher lows on the intraday timeframes, signaling continued buyer interest near liquidity pockets. Your bullish target at 25822 aligns with the current momentum, as price has been respecting trendline support and rotating upward from demand zones created during previous New York sessions. A clean break and hold above 25822 could open the door for an extension into the next liquidity cluster, allowing buyers to push toward psychological levels above 25900.
However, despite the bullish bias, the 25539 support remains the critical line in the sand. If this level fails, it would signal that the market has accepted lower pricing and that sellers have absorbed buy-side liquidity. A decisive break below 25539—especially accompanied by high volume—would likely trigger short-term momentum shorts targeting the imbalance zones created during the last leg up. This shift would invalidate the bullish structure and potentially initiate a deeper retracement toward the previous week’s value area. Until then, bulls remain in control, but the reaction at 25539 will determine whether the trend continues or flips.
Fundamental Analysis
From a macro perspective, NQ remains supported by strong fundamentals driven primarily by the performance of large-cap tech companies, resilient corporate earnings, and ongoing investor expectations for future rate cuts. The Federal Reserve’s tone has recently shifted more dovish, indicating that although inflation remains sticky, monetary easing is still on the table for the upcoming quarters. This keeps growth sectors—especially technology—attractive, as lower interest rates improve future earnings projections and strengthen valuation models for high-beta stocks.
At the same time, markets remain sensitive to macroeconomic data releases such as CPI, PCE, and labor-market readings. Any upside surprise in inflation or stronger-than-expected employment data could temporarily pressure NQ, as it may delay the Fed’s easing timeline. Additionally, geopolitical tensions and shifts in semiconductor policy remain potential sources of volatility. Overall, while short-term fluctuations are expected, the fundamental backdrop continues to favor higher prices for Nasdaq-focused assets, supporting your bullish outlook until key support levels fail.

Bullish bias on NAS100This is what I think might happen over the course of next week. I identified a hidden OB at the 25200 area that might get mitigated before it produces the next leg up. Price might break through the OB and tap into the low volume node. The overall trend remains bullish and there is no reason to assume a reversal is incoming.
The formation of a HL would be very welcome before a potential christmas rally starts.
For now, alerts are set

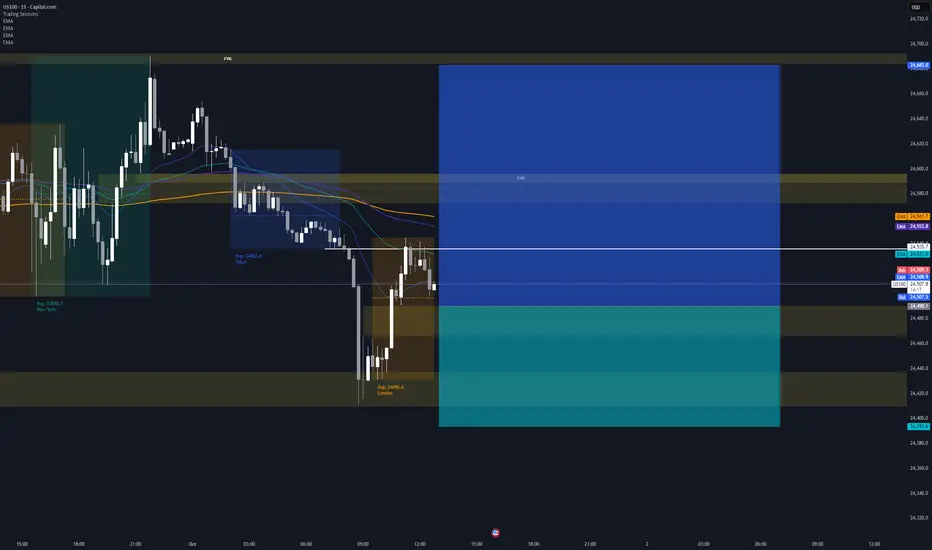
NAS Short/Long 05/12/2025Short DC1 on the M15 after tapping M15 break level, then rejecting back to H1 hold.
Closed the position once realised price was rejecting off M15 hold.
Long once above the daily open upon printing of AS4 on the M1

Buy Tech100 Futures for a swing long. Nasdaq is on the way UP and here is a pullback where you can enter for a 1:3 RR. I believe Tech100 is gunning for 26000, so I will be sitting on this position for the whole next week (hopefully). Probably adding to it if it moves in my favor with a clear bull signal.
NAS100 Trade Set Up Dec 5 2025Price has shifted to bearish structure and is targeting SSL and PDL but first i will wait for more internal structure on the 15m-5m to continue lower

Nasdaq shorts pendingOkay okay 👌🏽
$25k FLAT is what she’s hunting.
In a crucial handle as we speak and I am personally looking for some work into $26,970 early next week before bleeding this thing off into target..
Nothing more to say, keep it simple. Same goes for us30, she’s in the same boat for shorts 🩳 …
Tab up 650-690 and hopefully we can see her make a move upside to set it up?!
If not. Flip the script and play this in reverse.. ⏮️
Profile be up on next week. Watch people….
LFG 👽 🫶🏽

Nq longIf price goes back down, i'll likely take this trade. seems strong volume here, plus Japan likely to buy NQ too in their morning.
if price goes back all the way all time high, cancel this trade.

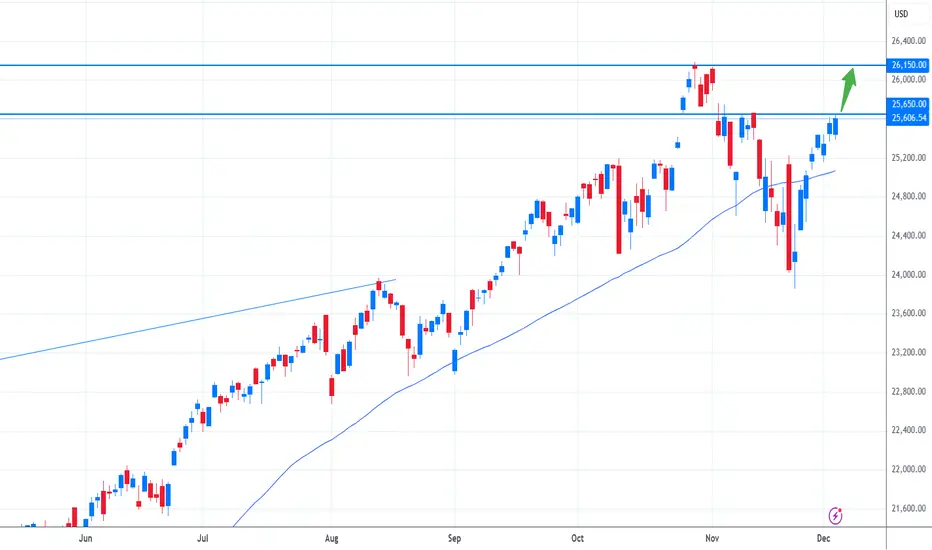
Nasdaq breakout around the corner?The Nasdaq is pushing higher as weaker US employment data boosts risk sentiment and fuels expectations that the Fed will move ahead with rate cuts. With softer labor figures reducing pressure on monetary policy, investors are rotating back into growth and tech names, supporting the broader index. The year-end rally narrative is strengthening as well, with many market participants positioning early for seasonal upside.
Lower Treasury yields are adding momentum, making equities relatively more attractive and encouraging capital to flow back into high-beta sectors. Corporate earnings remain solid in key industries, which helps stabilise sentiment after recent volatility. On top of that, easing geopolitical tensions and improved liquidity conditions are giving markets another tailwind. Market breadth has been expanding too, indicating that the upside is supported by more than just a handful of mega-caps.
From a technical perspective, the critical level to watch is the 25,700 zone. A clean break above this resistance could trigger further upside and potentially send the index toward its old all-time high. Until that breakout occurs, short-term pullbacks are still possible, but the broader setup continues to point toward a constructive outlook as long as the index holds above key support areas.
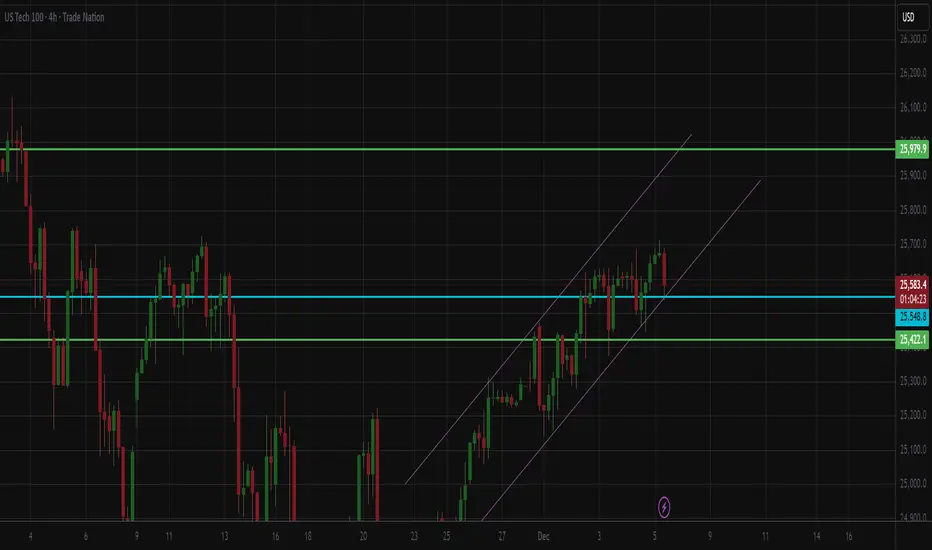
NAS100 – Riding the Channel: Will Price Respect the MidlinePrice continues to move cleanly inside the long-term ascending channel, with the midline acting as dynamic support throughout the past week. Each retest of the dashed median line has produced bullish continuation, but momentum is starting to flatten at the upper boundary.
Key Observations:
Price is currently hovering near the upper half of the channel, showing signs of exhaustion.
The dashed median line has been respected repeatedly — a key structure level to watch.
Bullish structure remains intact as long as price stays above the recent internal higher-low zones (highlighted in green).
MACD shows slowing momentum despite higher prices, signalling a possible pullback into channel support before continuation.
Levels to Watch:
Bullish continuation: If price holds above the midline, we could see another leg into the upper boundary of the channel.
Pullback zone: Watch for a corrective move into the lower channel support if buyers fail to sustain momentum.
Invalidation: A clean break below the channel would shift bias to short-term bearish retracement.
This structure is still very clean — waiting for either a respectful retest or a decisive breakout.
📌 Bias
Bullish overall structure, but expecting a short-term pullback before continuation.

NAS100 H4 | Bullish Bounce OffMomentum: Bullish
Price has bounced off the buy entry, which is acting as pullback support, and is currently trading above the Ichimoku cloud.
Buy Entry: 25,185.75
Pullback support
Stop Loss: 24,903.03
Pullback support
38.2% Fibonacci retracement
Take Profit: 25,829.99
Pullback resistance
145% Fibonacci extension
High Risk Investment Warning
Stratos Markets Limited (tradu.com ), Stratos Europe Ltd (tradu.com ):
CFDs are complex instruments and come with a high risk of losing money rapidly due to leverage. 70% of retail investor accounts lose money when trading CFDs with this provider. You should consider whether you understand how CFDs work and whether you can afford to take the high risk of losing your money.
Stratos Global LLC (tradu.com ): Losses can exceed deposits.
Please be advised that the information presented on TradingView is provided to Tradu (‘Company’, ‘we’) by a third-party provider (‘TFA Global Pte Ltd’). Please be reminded that you are solely responsible for the trading decisions on your account. Any information and/or content is intended entirely for research, educational and informational purposes only and does not constitute investment or consultation advice or investment strategy. The information is not tailored to the investment needs of any specific person and therefore does not involve a consideration of any of the investment objectives, financial situation or needs of any viewer that may receive it. Past performance is not a reliable indicator of future results. Actual results may differ materially from those anticipated in forward-looking or past performance statements. We assume no liability as to the accuracy or completeness of any of the information and/or content provided herein and the Company cannot be held responsible for any omission, mistake nor for any loss or damage including without limitation to any loss of profit which may arise from reliance on any information supplied by TFA Global Pte Ltd.
