Blur Recovers, No Longer Trading At Bottom PricesLook at this chart and consider the candles. Look at the size of the candles. What do you see?
On the left side these candles are really big. Late 2023 to early 2024.
Notice the right side of the chart, present day. See how small the candles are but notice the volume. The 21-July week has really h

BLURUSDT Forming Descending TriangleBLURUSDT is currently forming a descending triangle pattern, a structure that often signals a potential breakout — either bearish or bullish depending on key support levels. In this case, strong buying pressure and good volume hint at a bullish reversal from this consolidation phase. If price breaks
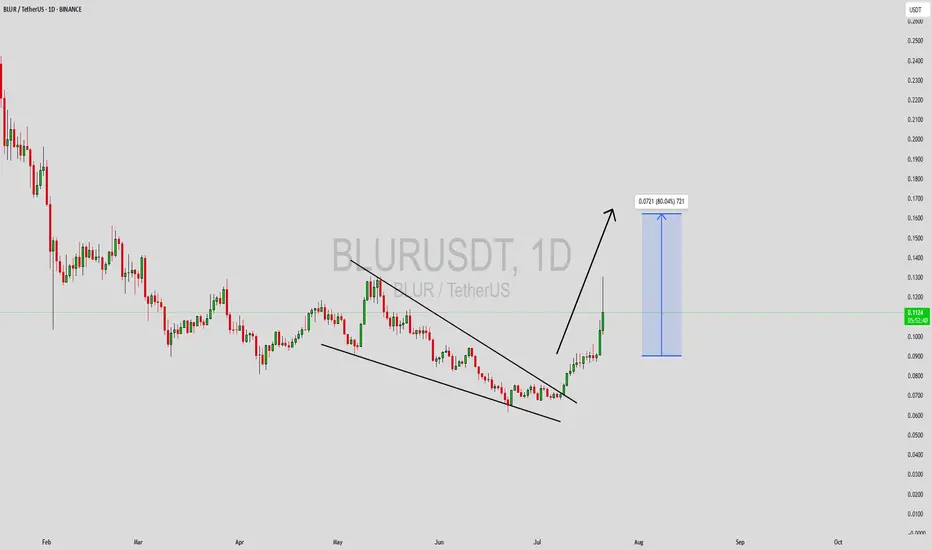
BLURUSDT Forming Bullish WaveBLURUSDT is currently shaping up a promising bullish wave that’s catching the eye of both swing traders and long-term crypto investors. With a strong surge in trading volume, this pattern indicates that fresh buying momentum is entering the market. Traders are watching closely for confirmation that

$BLUR looks good, 2x bullish rally INCOMING!SEED_DONKEYDAN_MARKET_CAP:BLUR looks good!
It looks extremely bullish for the midterm, expecting a 2x bullish rally. 📈

blurusdtblur usdt may come one candle down in our demand zone and then take out high of red candle /
never trade without sl

BLUR ANALYSIS!SEED_DONKEYDAN_MARKET_CAP:BLUR is forming a Cup & Handle pattern 📈. If it breaks out above the black resistance line ⚫:
✅ First target: Green line level 🟩
✅ Second target: Blue line level 🔵

BLURUSDT 2DBLUR ~ 2D Analysis
#BLUR If you still have a Conviction on this coin. Maybe this support you can consider to start buying back with a minimum target of 15%+

Trading opportunity for BLURUSDTBased on technical factors there is a Buy position in :
📊 BLURUSDT
🔵 Buy Now
🪫Stop loss 0.2655
🔋Target 0.3170
📏 R/R 2
💸RISK : 1%
We hope it is profitable for you ❤️
Please support our activity with your likes👍 and comments📝

Trading opportunity for BLURUSDTBased on technical factors there is a Buy position in :
📊 BLURUSDT
🔵 Buy Now
🪫Stop loss 0.2710
🔋Target 0.2950
📏 R/R 2
💸RISK : 1%
We hope it is profitable for you ❤️
Please support our activity with your likes👍 and comments📝

blurI hope this area is green, and if it can't hold, we should come and check further down the lines.

See all ideas
Summarizing what the indicators are suggesting.
Oscillators
Neutral
SellBuy
Strong sellStrong buy
Strong sellSellNeutralBuyStrong buy
Oscillators
Neutral
SellBuy
Strong sellStrong buy
Strong sellSellNeutralBuyStrong buy
Summary
Neutral
SellBuy
Strong sellStrong buy
Strong sellSellNeutralBuyStrong buy
Summary
Neutral
SellBuy
Strong sellStrong buy
Strong sellSellNeutralBuyStrong buy
Summary
Neutral
SellBuy
Strong sellStrong buy
Strong sellSellNeutralBuyStrong buy
Moving Averages
Neutral
SellBuy
Strong sellStrong buy
Strong sellSellNeutralBuyStrong buy
Moving Averages
Neutral
SellBuy
Strong sellStrong buy
Strong sellSellNeutralBuyStrong buy
Displays a symbol's price movements over previous years to identify recurring trends.