Friday Market Condition AnalysisThis is a weekly analysis of Market Conditions based on my CMT theories. There are 6 Primary Market Conditions. Each is unique and easy to identify once you understand the theory behind it. Who is in control of price.
What technical patterns are prevalent and reliable.
How Price will behave: Resistance/Support.
What trading style(s) work best.
Which indicators to use.
The inherent RISK in trading specific styles.
What Trendline Patterns are common.
Which Candlestick Entry and Exit Signals are most reliable.
The strength or weakness of the Price and Volume Patterns.
Market Condition Analysis tells you HOW and WHEN to trade, WHO is controlling price, WHAT to expect in near-term price action, WHERE to find excellent picks, HOW to enter, and WHEN to exit.
Market Condition Analysis is a road map of which Market Participants are actively trading, which are sidelined or waiting, and where we are in the overall long-term, intermediate-term, and short-term trends.
This provides the Relational Analysis needed to navigate the modern complex stock market which as 12 distinctly different Market Participant Groups.
Trade ideas

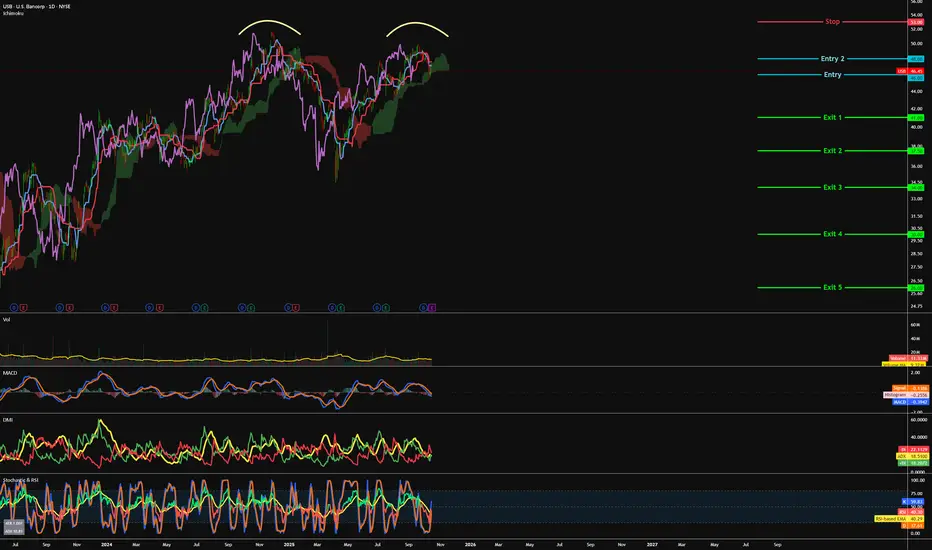
USB - Double top, on the way down.=======
Volume
=======
-neutral
==========
Price Action
==========
- Double top
=================
Technical Indicators
=================
- Ichimoku
>>> price within cloud
>>> Green kumo thinning
>>> Tenken + Chiku - within cloud and sloping downwards
>>> Kijun - within cloud and sloping downwards
=========
Oscillators
=========
- MACD still bearish
- DMI turning bullish
- StochRSI, bearish
=========
Conclusion
=========
- short to long term breakout swing
- price may reverse at current level, to enter spot or wait for pullback at entry 2.
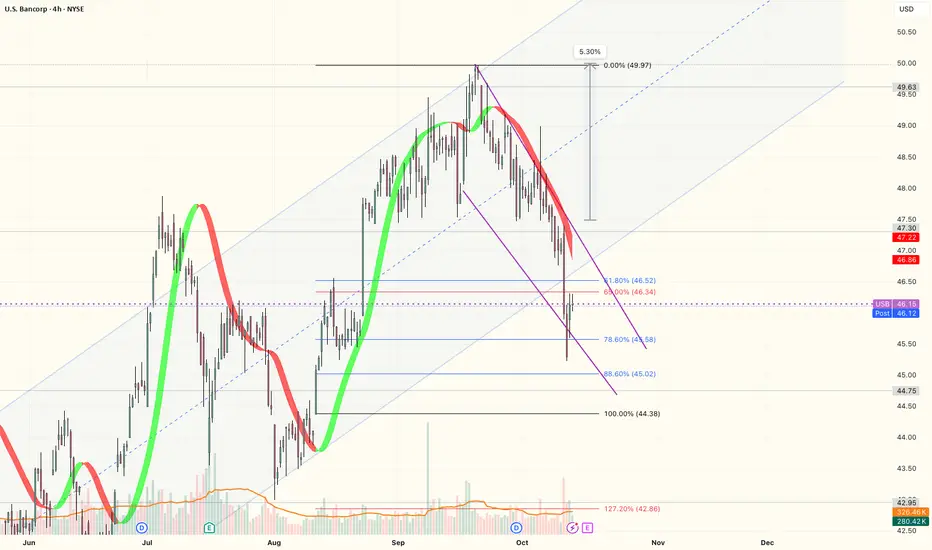
$USB OTE: 47.5, TP:50. Let see at 4H TF how is perform.
using Hullma, Price Action and Gamma & Vanna mapping.
Looks promising
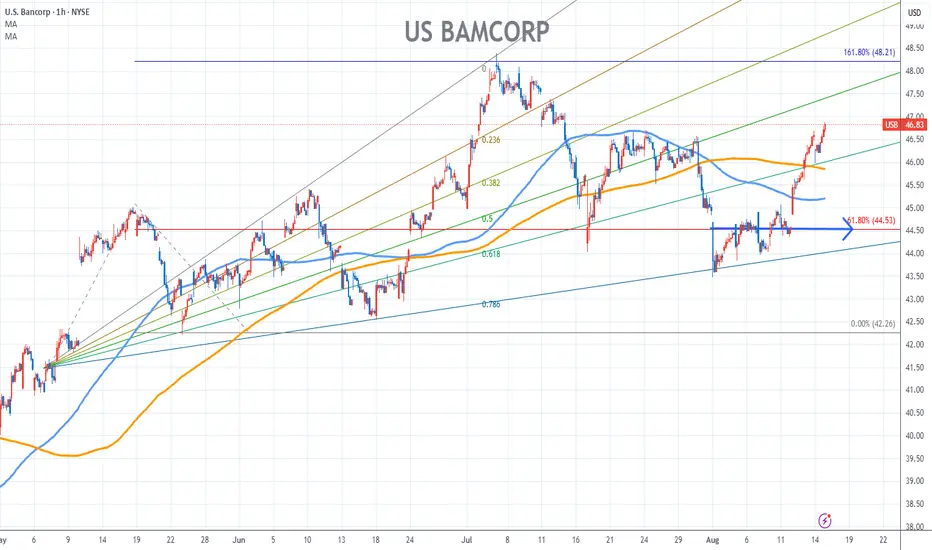
US Bancorp Stock Chart Fibonacci Analysis 081425Trading Idea
1) Find a FIBO slingshot
2) Check FIBO 61.80% level
3) Entry Point > 44.5/61.80%
Chart time frame:B
A) 15 min(1W-3M)
B) 1 hr(3M-6M)
C) 4 hr(6M-1year)
D) 1 day(1-3years)
Stock progress:C
A) Keep rising over 61.80% resistance
B) 61.80% resistance
C) 61.80% support
D) Hit the bottom
E) Hit the top
Stocks rise as they rise from support and fall from resistance. Our goal is to find a low support point and enter. It can be referred to as buying at the pullback point. The pullback point can be found with a Fibonacci extension of 61.80%. This is a step to find entry level. 1) Find a triangle (Fibonacci Speed Fan Line) that connects the high (resistance) and low (support) points of the stock in progress, where it is continuously expressed as a Slingshot, 2) and create a Fibonacci extension level for the first rising wave from the start point of slingshot pattern.
When the current price goes over 61.80% level , that can be a good entry point, especially if the SMA 100 and 200 curves are gathered together at 61.80%, it is a very good entry point.
As a great help, tradingview provides these Fibonacci speed fan lines and extension levels with ease. So if you use the Fibonacci fan line, the extension level, and the SMA 100/200 curve well, you can find an entry point for the stock market. At least you have to enter at this low point to avoid trading failure, and if you are skilled at entering this low point, with fibonacci6180 technique, your reading skill to chart will be greatly improved.
If you want to do day trading, please set the time frame to 5 minutes or 15 minutes, and you will see many of the low point of rising stocks.
If you want to prefer long term range trading, you can set the time frame to 1 hr or 1 day.
Waiting for quick correction, short term call options testing Testing medium- to high-risk short-term strategies, taking advantage of overselling and a breakout of the downtrend ceiling. We're currently waiting for a candle with volume for confirmation. We can enter a call with a strike price of 17.60 OM.

Trading US BancorpUSB's stock has created an almost perfect head and shoulders pattern, clearly marking the support line in red and recently breaking it, with a pullback included.
This leads us to believe that with the recent CEO changes, the questionable acquisition of the Southeast bank, and some fee issues, the stock may suffer in the short to medium term, potentially leading to drops of up to 14% to meet the targets set by the head and shoulders pattern.
The break of the first blue trend is already a warning signal for investors. We have an opportunity to win around 7 to 14% while risking around 3 to 4%, this makes a los of sense if you invest in the short term.

USB: False breakdown and a test of 200SMAThings that I like
1. Test at Weekly 200SMA. This MA has been key, acted as resistance prior, and now we are retesting it as support.
2. False breakdown
3. Tailwind from regional bank sector and high interest rates
4. RSI on weekly staying above 50
5. RSI on daily showing continued bullish divergence. Above 14days MA and going above 50 soon
Trade Plan
- Enter when market opens, if it hasn't fly
- TP: 53.25
- SL: 46.4
- RR: ~4.4

U.S. Bancorp Buy opportunity setting upU.S. Bancorp is a financial service holding company. The Company’s major lines of business are Wealth, Corporate, Commercial and Institutional Banking, Consumer and Business Banking, Payment Services, and Treasury and Corporate Support. The Company provides a range of financial services, including lending and depository services, cash management, capital markets, and trust and investment management services
FUNDAMENTAL METRICS
Exchange- New York stock exchange
Market capitalization- $75.73B
Basic EPS- $3.27
Total Net revenue- $28.1B
Net Income- $5.4B
Average common shares outstanding- 1.5B
Total assets- $663B
Deposits- $512B
Provision for credit losses -$2.3B
Dividends declared per share- $1.93
Financial metrics as at year ended Dec 31, 2023, Market cap as per 24.10.2024 Q4 EARNINGS SUMMARY (Date of release 16.10.2024) (Next report date Jan 16,2025)
1. Net income of $1,714 million and diluted earnings per common share of $1.03. Revenue missed analyst estimates by 1.0%. Earnings per share (EPS) exceeded analyst estimates by 4.5%.
2. There shall be a share buy back program of $5 billion.
3. The bank is focused on organic growth & broadening their reach. Not interested in mergers & Acquisitions currently. The bank's latest large investment was the acquisition of Union Bank, which closed in December 2022. This meaningfully expanded its presence in California.
4. Net revenue of $6,864 million, including $4,166 million of net interest income on a taxable-equivalent basis
5. Noninterest income of $2,817 million driven by year-over-year increases in:
i. Commercial products revenue of 12.1%
ii. Trust and investment management fees of 6.4%
iii. Payment services revenue of 3.1%
iv. Mortgage banking revenue of 7.6%
6. Non-interest expenses dropped by 1% compared to last year, but increased slightly by 0.4% compared to the last quarter, when accounting for previous notable expenses.
7. The bank's return on common equity was 17.9%, return on assets was 1.03%, and efficiency ratio was 60.2%.
TECHNICAL ANALYSIS RULES
1. Structure drawing (Trend line drawing on past price chart data)
2. Patterns identification (Naming patterns on past price chart data for future wave)- Corrective flag forming
3. Future indication (Reading indicator for future wave)- MACD 0 crossover to signal buys
4. Future wave (Drawing on future price chart using future indication from indicator)- highlighted
5. Future reversal point (Identifying trend reversal point on price chart using structure)- Target price $67.35 (top of bigger correction)
Look for the trade on lower timeframe by identifying impulses & correction as shown
Recommendation:
Buy price range: $44.8- $48
Target price: $67
Top Shareholders
The Vanguard group- 8.64%
BlackRock Institutional Trust Company- 4.85%
State Street Global Advisors- 4.26%
MUFG Bank- 4.22%
Charles Schwab Investment managers- 2.92%
Fidelity Management- 2.66%

USB Long 1Hr ChartUSB Long 1Hr Chart
Trade plan
Price is coming down to a nice buying area
If we get there buy 588 shares = $100 risk
Target is located 11:1, manage the trade once it get's us in
Try to follow price all the way to target 2

$USB with a bullish outlook following its earnings #StocksThe PEAD projected a bullish outlook for NYSE:USB after a positive under reaction following its earnings release placing the stock in drift A with an expected accuracy of 61.45%.

USB Stock Short All timeframes are massively overbought
There is a pattern on H4 and H1
This is a weekly high where there is a lot of resistance
Since it is against the trend I would normally not go for such a trade but stocks look like they need to come down so this could be a trade
tight stop loss and take profit when it hits the H4 trend as this is still very uptrend

USB U.S. Bancorp Options Ahead of EarningsAnalyzing the options chain and the chart patterns of USB U.S. Bancorp prior to the earnings report this week,
I would consider purchasing the $42.5usd strike price Puts with
an expiration date of 2024-9-20,
for a premium of approximately $4.20.
If these options prove to be profitable prior to the earnings release, I would sell at least half of them.

Bull Put Spread Strategy for US Bancorp (USB)The Bull Put Spread is a versatile options strategy that can be used to generate income and limit downside risk. It is a popular strategy among traders who are bullish on a stock but are concerned about a potential decline in price.
What is a Bull Put Spread?
A Bull Put Spread is a strategy that involves selling a put option with a higher strike price and buying a put option with a lower strike price. Both options have the same underlying asset and expiration date.
**Just sold Bull Put Spread by selling a put option with a strike price of $37.50 and buying a put option with a strike price of $36, expiring on January 26, 2024.
Stop Loss
Set a stop-loss order at 3 times the credit received, with a maximum 10% of your capital as the order amount.
This strategy will generate a profit if the stock price remains above $37.50 at expiration.

Great stock, it's a keeperPrice is forming a bullish flag to tempt a breakout of the 37.7 resistance. I already have a long term position and just added. Even if the price drops, just hold it, it pays good dividends. I think that in long term it will break the 40 level and reach 45.

USB U.S. Bancorp Options Ahead of EarningsAnalyzing the options chain and the chart patterns of USB U.S. Bancorp prior to the earnings report this week,
I would consider purchasing the 32.50 usd strike price Puts with
an expiration date of 2023-10-20,
for a premium of approximately $0.77.
If these options prove to be profitable prior to the earnings release, I would sell at least half of them.
Looking forward to read your opinion about it.

Earnings Journal 💵💵💵📶 S T A T I S T I C A L A N A L Y S I S
Current 50-Day Market Trend: short/sellers/negative.
Next Swing: negative swing to support.
Next Wave: buy wave to the deviation.
Next 50-Day Market Trend: long/buyers/positive.
Trade Type: Touch & Go don't wait for a close.
💵 E A R N I N G S A T A G L A N C E
Release Date: 10/18 BMO
Revenue Anticipations: positive surprise for Revenues.
Revenue Surprise-Confidence: on a scale of 0-9, #4
EPS Anticipations: negative surprise for EPS.
EPS Surprise-Confidence: on a scale of 0-9, #4
EPS & Revenue 2-Year Trend: the company trend in EPS is negative, the company trend in Revenues is positive.
📝 S Y N O P S I S
"I expect the market will buy the surprise if the earnings report hits the Wall Street consensus, or sell the surprise if the earnings report misses the Wall Street consensus."
🔎 R E S E A R C H D E P T H
Technical Analysis: daily chart.
Fundamental Analysis: EPS & Revenue data.
Press/News: none.
Social Media: none.

#USD trade plan up to 15-Sep
Based on our team's research of the options market, we expect buy activity at the support level or sell activity at the resistance.
We primarily consider levels to be activity zones, but not to be a super-fine level for establishing a limit order. Use them in combination with our own strategy, not in alone.
We do the best research as we can to find new opportunities in the massive amount of information every day to help you make data-driven trading decision.
Please feel free to leave any comments you have and like this idea if you agree with us. Any feedback or comments will be read. We appreciate it all!

U.S. Bank (USB) Long on ReentryReentry attempt at $31.48. I'm currently playing charts on the 5D size and reassessing them as each day passes to make sure I'm seeing if the trend turns. Since USB turned fairly tightly from the mid-point a good short could be tried at $32.93 with a tight stop.

100 target USBwith the bank contagion destroing bank shares usb has fallen victim ... but this bank is used by the us gov for many things even unempoyment payouts so you can bet this will recover. not to mention we have already a healthy bounce from the last line of defense. 28.26
im targeting 60$ I expect this around Q1 2025

💾 U.S. Bancorp 2008 Type Of Crash IncomingWe are now at #5 of the TOP10 biggest banks in the USA, this one seems pretty bad as well.
Let's start with the weekly chart and then we move to the monthly for the bigger picture:
✔️ This week USB had the worst week since Feb. 2020, Covid days.
✔️ A major support level failed in the form of 0.618 Fib. which can lead to lower prices.
✔️ We have a bearish cross on the MACD and RSI trending lower; I will show you the charts this time.
USB Weekly MACD:
USB Weekly RSI:
✔️ While the monthly chart lost EMA10 and EMA100, support was found at MA200.
✔️ The MACD is trending down while already bearish.
How far down it goes will depend on the politics, how much money they decide to print, if the banks will get a bailout or not, etc.
We have to see how it all develops.
The side effects of raising interest.
They wanted to crash the economy... It is working.
Namaste.

USB - Horizontal SupportUSB has a strong horizontal support in green that aligns perfectly with the bottom of a downward channel.
I suggest this as a reversal point for price.
The bars pattern shows some thoughts of mine regarding the recovery.

US BANCORP Stock Chart Fibonacci Analysis 051423 Trading Idea
1) Find a FIBO slingshot
2) Check FIBO 61.80% level
3) Entry Point > 28/61.80%

US Bancorp: Bullish Deep Gartley Piercing LineNYSE:USB is showing a big amount of Bullish Divergence on the Daily after printing a Bullish Abandoned Baby on the 1 Day Chart and a Piercing Line on the 2 Day Chart at the 0.886 PCZ of a Bullish Deep Gartley. If we hold above the lows it could eventually come back up to see 45-55 Dollars.
