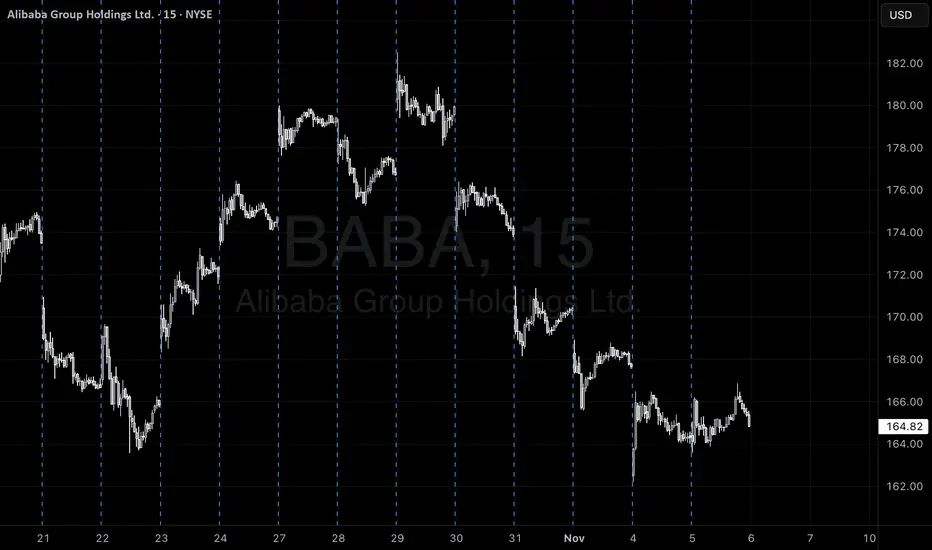
ALI BABA HIGH PROBABILITY SETUP SOON!!!🚨 BABA HIGH PROBABILITY BUY SETUP 🚨
* Here We Can See Clearly The Next Potential Moves For BABA Coming Hours/Days.
* Keep Your Eyes Close On Your Trading Positions.
* Happy PIP Hunting Traders.
FXKILLA.
Key facts today
Next report date
—
Report period
—
EPS estimate
—
Revenue estimate
—
165.91 MXN
367.46 B MXN
2.83 T MXN
2.24 B
About Alibaba Group Holdings Ltd.
Sector
Industry
CEO
Yong Ming Eddie Wu
Website
Headquarters
Hangzhou
Founded
1999
ISIN
US01609W1027
FIGI
BBG007TGGBZ7
Alibaba Group Holding Ltd. engages in providing technology infrastructure and marketing reach. It operates through the following business segments: China Commerce, International Commerce, Local Consumer Services, Cainiao, Cloud, Digital Media and Entertainment, and Innovation Initiatives and Others segments. The Core Commerce segment consists of platforms operating in retail and wholesale. The China Commerce segment includes China commerce retail and wholesale businesses. The International Commerce segment focuses on international commerce retail and wholesale businesses. The Local Consumer Services segment is involved in To-Home businesses, which include Ele.me, local services and delivery platform, and Taoxianda, and To-Destination segment businesses which include Amap, the provider of mobile digital map, navigation and real-time traffic information, and restaurant and local services guide platform. The Cainiao segment has Cainiao Network and offers domestic and international one-stop-shop logistics services and supply chain management solution. The Cloud segment includes Alibaba Cloud and DingTalk. The company was founded by Chung Tsai and Yun Ma on June 28, 1999 and is headquartered in Hangzhou, China.
Related stocks

BABA Breakout Watch: Close Above 171 Opens Path to 190Alibaba (BABA) ripped higher from late August and topped near $190 in early October. Since then, price has been correcting inside a descending channel while holding above the 60-day moving average. Short-term momentum has cooled (MACD histogram negative), but the broader structure remains constructi

$BABATechnical Outlook for NYSE:BABA : Navigating Key Levels After a Strong Rally
NYSE:BABA has demonstrated significant strength over the past several months, establishing a well-defined and respected upward trendline on its chart. This consistent pattern of higher lows indicates sustained bullish mo

BABA QuantSignals V3 Weekly 2025-11-05BABA QuantSignals V3 Weekly 2025-11-05
BABA Weekly Signal | 2025-11-05
• Direction: BUY CALLS | Confidence: 55%
• Expiry: 2025-11-07 (2 days)
• Strike Focus: $165.00
• Entry Range: $2.42
• Target 1: $3.50
• Stop Loss: $1.80
• Weekly Momentum: NEUTRAL (+0.60% 1W)
• Flow Intel: Neutral | PCR 1.18
• Ma
$BABA | ABC Correction in Progress (VolanX DSS View)Alibaba is showing early signs of completing an ABC corrective structure on the daily chart.
🔹 Structure & Levels
Wave A: Initial impulse top near $187.5
Wave B: Mid retrace capped around $179–180 (current zone)
Wave C: Expected corrective leg aiming toward the $164.38 liquidity area, possibly e

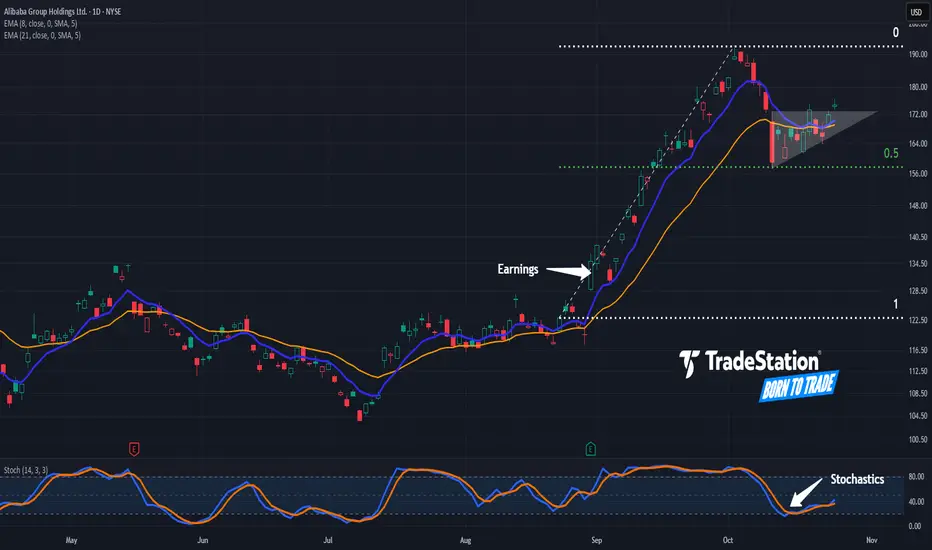
Potential Continuation Patterns in AlibabaAlibaba rallied in September. Now, after a pullback, some traders may see potential for continuation.
The first pattern on today’s chart is the advance between August 22 and October 2. The Chinese e-commerce giant stabilized after retracing half the move, which may suggest its direction remains upw
ALIBABA HIGH PROBABILITY SETUP SOON!!!🚨 BABA HIGH PROBABILITY BUY SETUP 🚨
* Here We Can See Clearly The Next Potential Moves For BABA Coming Hours/Days.
* Keep Your Eyes Close On Your Trading Positions.
* Happy PIP Hunting Traders.
FXKILLA.

Tutorial on Andrews Pitchfork on AlibabaThis is an analysis of Alibaba stock using the Andrews pitchfork.


Baba Price Reversal on Quarterly. Baba Is bullish again. This is a Quarterly chart.
Fair value Gap between $180-$204 on Quarterly chart.
Price action suggests Baba is poised to make big moves and it's P/E ratio is also only Around 12.
AI hype is coming too for Baba since they have Qwen AI on their hands.
Stop Loss and Target mentioned in the Post. No

See all ideas
Summarizing what the indicators are suggesting.
Neutral
SellBuy
Strong sellStrong buy
Strong sellSellNeutralBuyStrong buy
Neutral
SellBuy
Strong sellStrong buy
Strong sellSellNeutralBuyStrong buy
Neutral
SellBuy
Strong sellStrong buy
Strong sellSellNeutralBuyStrong buy
An aggregate view of professional's ratings.
Neutral
SellBuy
Strong sellStrong buy
Strong sellSellNeutralBuyStrong buy
Neutral
SellBuy
Strong sellStrong buy
Strong sellSellNeutralBuyStrong buy
Neutral
SellBuy
Strong sellStrong buy
Strong sellSellNeutralBuyStrong buy
Displays a symbol's price movements over previous years to identify recurring trends.
Curated watchlists where BABA/N is featured.


