GLXY- Huge potential There could be a huge trade in October, known as the strongest month for crypto. (Galaxy Digital is a fintech company focused on digital assets and data center infrastructure, providing institutional clients with crypto services such as trading, advisory, asset management, staking, and tokenization)
Next report date
—
Report period
—
EPS estimate
—
Revenue estimate
—
−40.91 MXN
1.57 B MXN
0.00 MXN
172.10 M
About Galaxy Digital Inc.
Sector
Industry
CEO
Michael Edward Novogratz
Website
Headquarters
New York
ISIN
US36317J2096
FIGI
BBG01TZLDJJ4
Galaxy Digital, Inc. engages in digital assets and data center infrastructure, delivering solutions that accelerate progress in finance and artificial intelligence. It operates through the following segments: Digital Assets and Data Centers. The digital assets segment offers institutional access to trading, advisory, asset management, staking, self-custody, and tokenization technology. The Data Centers segment competes with a range of infrastructure providers that are building or repurposing facilities to support the rapidly growing demand for AI and compute-intensive workloads. The company was founded by Michael Novogratz in 2018 and is headquartered in New York, NY.
Related stocks

$GLXY – Cup & Handle Breakout Setup with Crypto + AI TailwindsNASDAQ:GLXY – Cup & Handle Breakout Play at All-Time Highs
Galaxy Digital ( NASDAQ:GLXY ) is coiling up beautifully — a cup and handle pattern right under all-time highs, and the backdrop couldn’t be stronger.
🔹 The Setup:
After a strong run to ATHs, NASDAQ:GLXY has consolidated near the highs
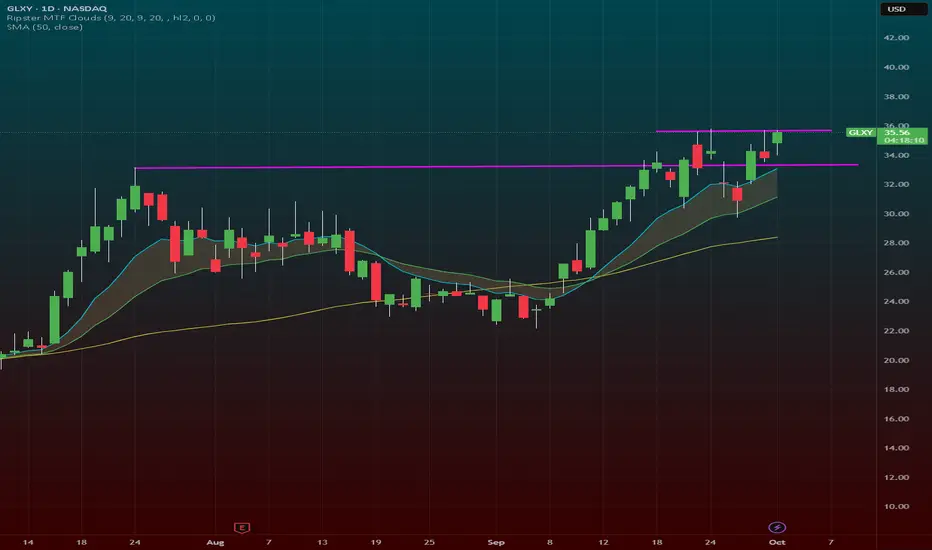
TradeUSAsignals RecommendationsLong (5% of your portfolio) GLXY (Order filled @ 29.57)
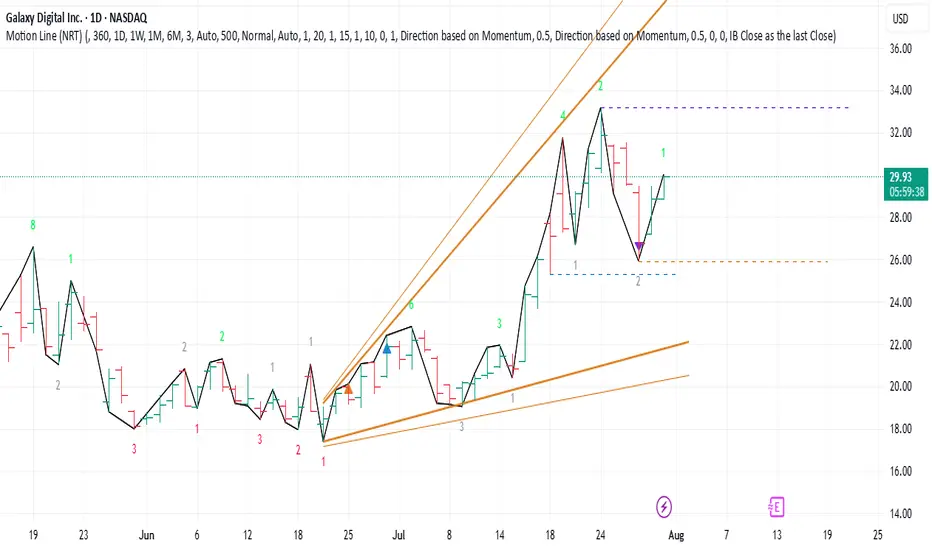
We have an up trend under Time traders control (brown arrow) with a correction more than 38.2%.
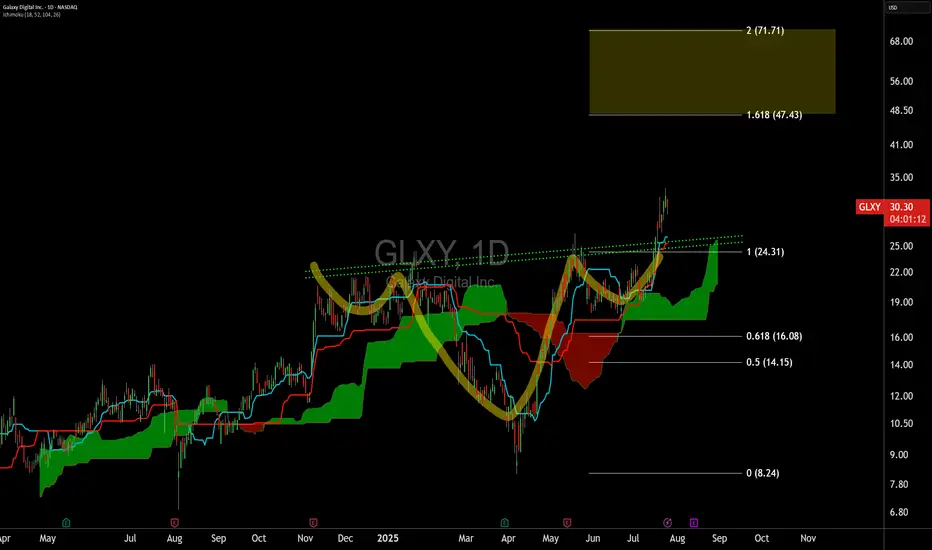
Galaxy Digital Bull Flag Breakout After a period of consolidation and finding a floor at $25, it now looks like GLXY is ready to resume the uptrend towards $45-50 by the end of year towards its 1.618 fib extension

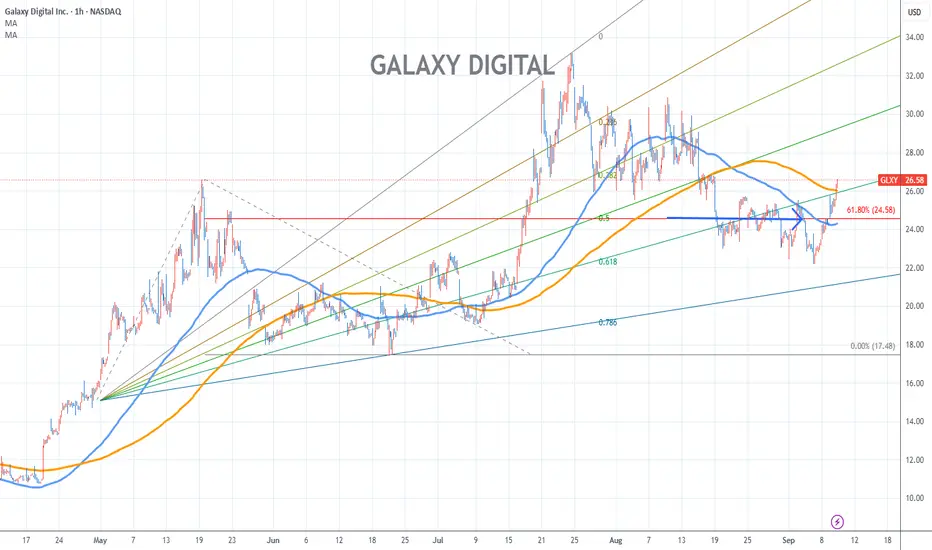
Galaxy Digital Stock Chart Fibonacci Analysis 090925Trading Idea
1) Find a FIBO slingshot
2) Check FIBO 61.80% level
3) Entry Point > 24.6/61.80%
Chart time frame:B
A) 15 min(1W-3M)
B) 1 hr(3M-6M)
C) 4 hr(6M-1year)
D) 1 day(1-3years)
Stock progress:A
A) Keep rising over 61.80% resistance
B) 61.80% resistance
C) 61.80% support
D) Hit the bottom
E
Digital Galaxy Stock Chart Fibonacci Analysis 082225Trading Idea
1) Find a FIBO slingshot
2) Check FIBO 61.80% level
3) Entry Point > 24.5/61.80%
Chart time frame:B
A) 15 min(1W-3M)
B) 1 hr(3M-6M)
C) 4 hr(6M-1year)
D) 1 day(1-3years)
Stock progress:A
A) Keep rising over 61.80% resistance
B) 61.80% resistance
C) 61.80% support
D) Hit the bottom
E

GLXY Bull flag....ready to goIt looks like GLXY is ready to pop.It looks like a bull flag on weekly time frame, ready to go,short term target $32-34 longer-term new all time high 😀

Galaxy Digital.Galaxy Digital Holdings Ltd. is showing strong potential for growth, supported by its solid financial performance and strategic expansion in digital asset management and mining. While the current technical indicators present a mixed sentiment, the overall long-term outlook remains bullish. Investors

[Galaxy Digital]In the coming weeks, Galaxy Digital will suffer from the trend reversal in the crypto market and the decline in Bitcoin.

See all ideas
Summarizing what the indicators are suggesting.
Neutral
SellBuy
Strong sellStrong buy
Strong sellSellNeutralBuyStrong buy
Neutral
SellBuy
Strong sellStrong buy
Strong sellSellNeutralBuyStrong buy
Neutral
SellBuy
Strong sellStrong buy
Strong sellSellNeutralBuyStrong buy
An aggregate view of professional's ratings.
Neutral
SellBuy
Strong sellStrong buy
Strong sellSellNeutralBuyStrong buy
Neutral
SellBuy
Strong sellStrong buy
Strong sellSellNeutralBuyStrong buy
Neutral
SellBuy
Strong sellStrong buy
Strong sellSellNeutralBuyStrong buy
Displays a symbol's price movements over previous years to identify recurring trends.
Frequently Asked Questions
The current price of GLXY is 719.00 MXN — it has decreased by −2.69% in the past 24 hours. Watch Galaxy Digital Inc. Class A stock price performance more closely on the chart.
Depending on the exchange, the stock ticker may vary. For instance, on BMV exchange Galaxy Digital Inc. Class A stocks are traded under the ticker GLXY.
GLXY stock has risen by 0.42% compared to the previous week, the month change is a 67.02% rise, over the last year Galaxy Digital Inc. Class A has showed a 187.03% increase.
We've gathered analysts' opinions on Galaxy Digital Inc. Class A future price: according to them, GLXY price has a max estimate of 824.75 MXN and a min estimate of 614.21 MXN. Watch GLXY chart and read a more detailed Galaxy Digital Inc. Class A stock forecast: see what analysts think of Galaxy Digital Inc. Class A and suggest that you do with its stocks.
GLXY reached its all-time high on Oct 10, 2025 with the price of 751.00 MXN, and its all-time low was 54.17 MXN and was reached on Jun 16, 2023. View more price dynamics on GLXY chart.
See other stocks reaching their highest and lowest prices.
See other stocks reaching their highest and lowest prices.
GLXY stock is 2.77% volatile and has beta coefficient of 4.39. Track Galaxy Digital Inc. Class A stock price on the chart and check out the list of the most volatile stocks — is Galaxy Digital Inc. Class A there?
Today Galaxy Digital Inc. Class A has the market capitalization of 129.57 B, it has increased by 14.99% over the last week.
Yes, you can track Galaxy Digital Inc. Class A financials in yearly and quarterly reports right on TradingView.
Galaxy Digital Inc. Class A is going to release the next earnings report on Nov 6, 2025. Keep track of upcoming events with our Earnings Calendar.
GLXY earnings for the last quarter are 1.52 MXN per share, whereas the estimation was 1.53 MXN resulting in a −0.81% surprise. The estimated earnings for the next quarter are 4.06 MXN per share. See more details about Galaxy Digital Inc. Class A earnings.
Galaxy Digital Inc. Class A revenue for the last quarter amounts to 172.02 B MXN, despite the estimated figure of 173.43 B MXN. In the next quarter, revenue is expected to reach 262.21 B MXN.
GLXY net income for the last quarter is 276.48 M MXN, while the quarter before that showed −6.03 B MXN of net income which accounts for 104.58% change. Track more Galaxy Digital Inc. Class A financial stats to get the full picture.
No, GLXY doesn't pay any dividends to its shareholders. But don't worry, we've prepared a list of high-dividend stocks for you.
As of Oct 13, 2025, the company has 520 employees. See our rating of the largest employees — is Galaxy Digital Inc. Class A on this list?
Like other stocks, GLXY shares are traded on stock exchanges, e.g. Nasdaq, Nyse, Euronext, and the easiest way to buy them is through an online stock broker. To do this, you need to open an account and follow a broker's procedures, then start trading. You can trade Galaxy Digital Inc. Class A stock right from TradingView charts — choose your broker and connect to your account.
Investing in stocks requires a comprehensive research: you should carefully study all the available data, e.g. company's financials, related news, and its technical analysis. So Galaxy Digital Inc. Class A technincal analysis shows the buy rating today, and its 1 week rating is buy. Since market conditions are prone to changes, it's worth looking a bit further into the future — according to the 1 month rating Galaxy Digital Inc. Class A stock shows the strong buy signal. See more of Galaxy Digital Inc. Class A technicals for a more comprehensive analysis.
If you're still not sure, try looking for inspiration in our curated watchlists.
If you're still not sure, try looking for inspiration in our curated watchlists.