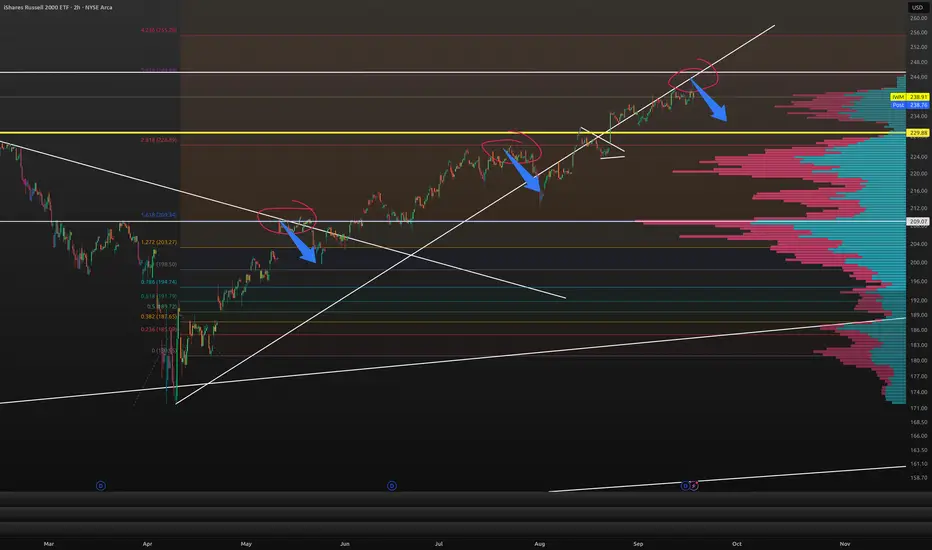
Fib Extension shows possible 5% pullback in IWMso this has worked for a while now. It looks like a pullback off the perfect pin of the 3.618 is possible. Past touches on the 1.618 and 2.618 gave about a 5% pullback. Check it out.
IWM trade ideas
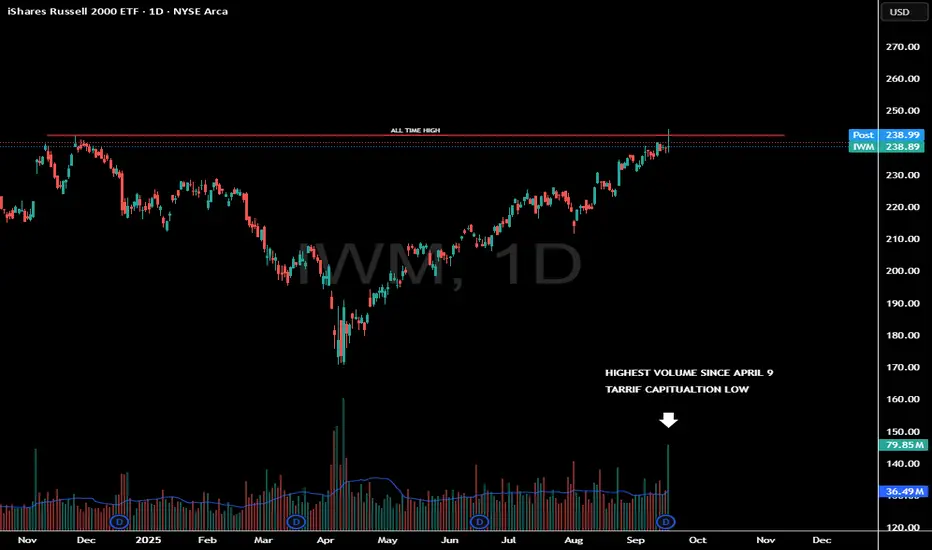
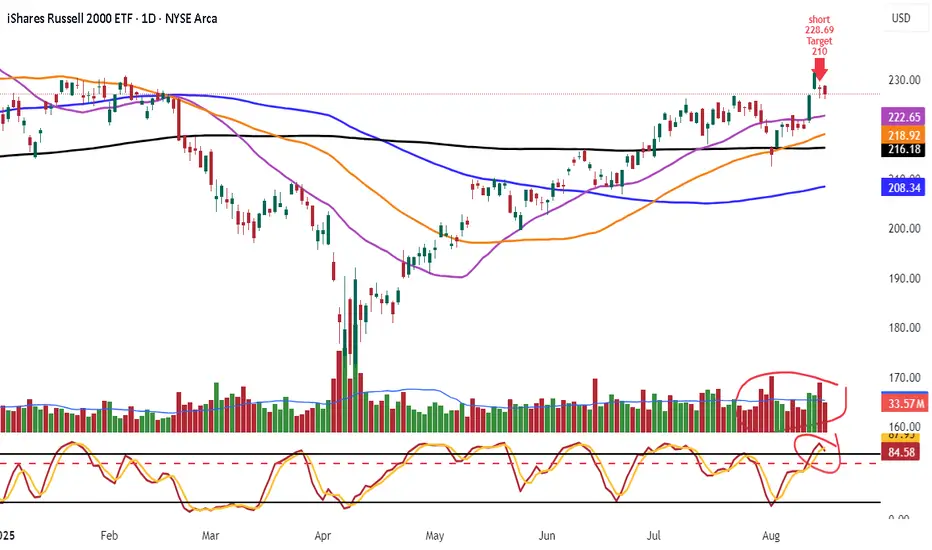
Highest Volume Candle Since Tarriff LowIWM saw a nasty reversal off the all time highs today.
A potential weekly topping tail is building.
What important about this reaction is the amount of volume that was traded.
This was the highest candle since April 9th.
High Volume reversals need to be monitored closely as it does show large money distributed into this strength.
A high volume candle marked the tariff bottom.
Will a high volume candle signal a near term top?
IWM + Total 2Risk-on vs risk-off assets → Both small-cap stocks (IWM) and altcoins (TOTAL2) are considered high-beta, speculative assets. They respond more aggressively to shifts in liquidity, interest rates, and risk appetite.
Liquidity sensitivity → When liquidity is abundant, both IWM and TOTAL2 rally harder than their large-cap counterparts (S&P 500 / Bitcoin). When liquidity tightens, they sell off harder too.
Market breadth / speculative phase → IWM is a gauge of U.S. market breadth (how smaller companies are doing), while TOTAL2 reflects risk-taking beyond Bitcoin. Both act as “speculative barometers.”
Macro correlation → In tightening cycles (higher rates, strong dollar), both tend to lag. In easing/liquidity cycles, they outperform and move almost in lockstep.
Macro Picture for IWM (Russell 2000)The macro picture for IWM is one of heightened sensitivity to U.S. economic conditions, particularly interest rates. While it has underperformed large-cap indices recently, a favorable shift in monetary policy or a strengthening domestic economy could act as a powerful catalyst for a period of small-cap outperformance. Sector-specific trends, such as the performance of financials and industrials, are key indicators to watch for signals of a broader recovery in the small-cap space.
Small-cap companies tend to carry more debt and are more reliant on bank lending than their large-cap counterparts. This makes them highly sensitive to changes in interest rates. A period of high interest rates or aggressive monetary tightening can disproportionately weigh on IWM, as borrowing costs increase and economic activity slows. Conversely, a period of falling rates or a "soft landing" for the economy can be a significant tailwind for the index. Recent discussions around potential Fed rate cuts could be a positive catalyst for IWM.
Small-cap stocks have underperformed large-cap stocks in recent years. While some valuation metrics like price-to-earnings (P/E) ratios may still appear elevated, other metrics like price-to-sales and price-to-book suggest that small caps may be undervalued relative to the S&P 500. This could present a compelling opportunity for long-term investors if the macro environment improves for these companies
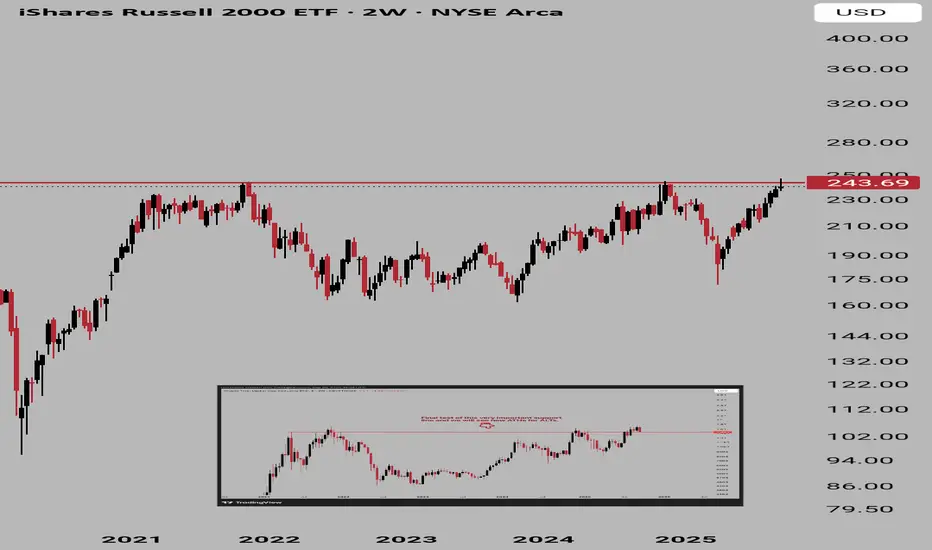
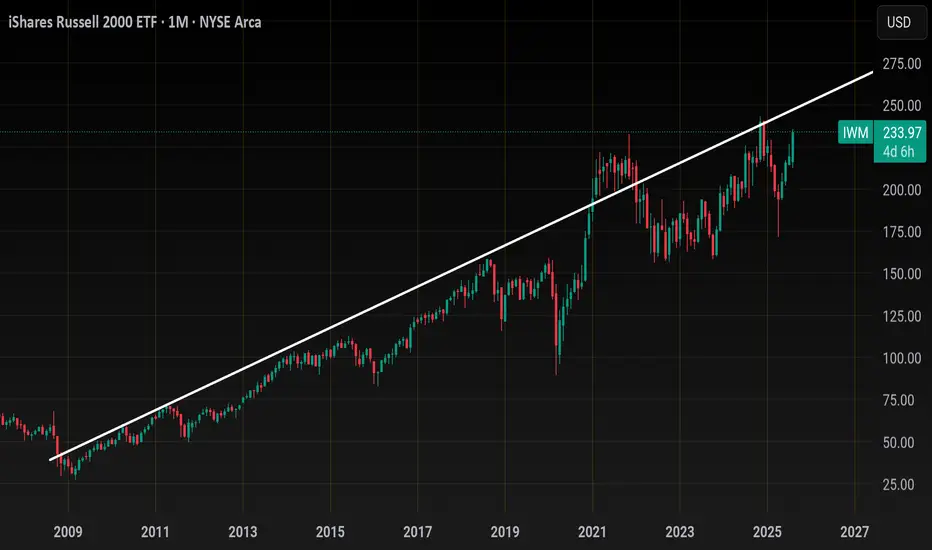
Technical Analysis-Based Ideas: Shorting at a Resistance
The long-term weekly chart shows that IWM is closer to testing a significant, multi-decade resistance line. This level has historically been a ceiling for the price, causing major pullbacks or periods of consolidation. The idea is to bet on a repetition of this pattern so play short at these resistance lines..


Shorted IWM 228.69 Target 210Look daily chart lower high stoch rolling over
look vol more selling buying
IWM Looks like 240 is incoming, most likely this move comes with a cool Core PCE this Friday and if not then, then most likely on next month job numbers .
Weekly trendline resistance from 2010 has resistance at around 240ish.
That's only another 3% upside
In an extreme move we could see price momentarily push above 240 and tag 245
From 245 I can't see price heading higher going into Seasonality of Sept.. so I'd be looking for a top signal above 240 and a correction from there to 210.00
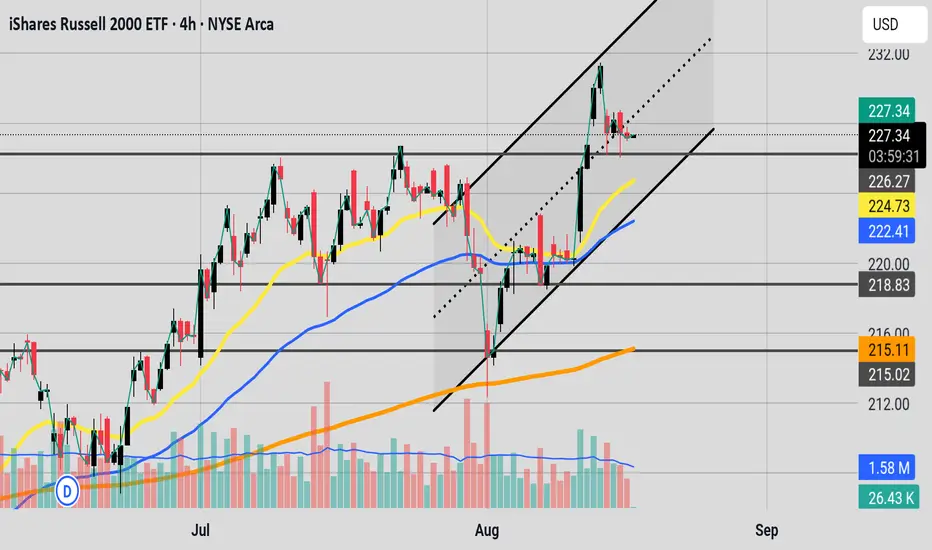
Here's the price action from April lows..
Simple channel..
I don't think we tag support again until 240 is tested, we could just grind mid channel all the way back to ATH like that Green circle of price I highlighted.. let's see if we get more of a dip towards 230-232 before Friday's core pce , IMO that would be the entry for a final leg up.
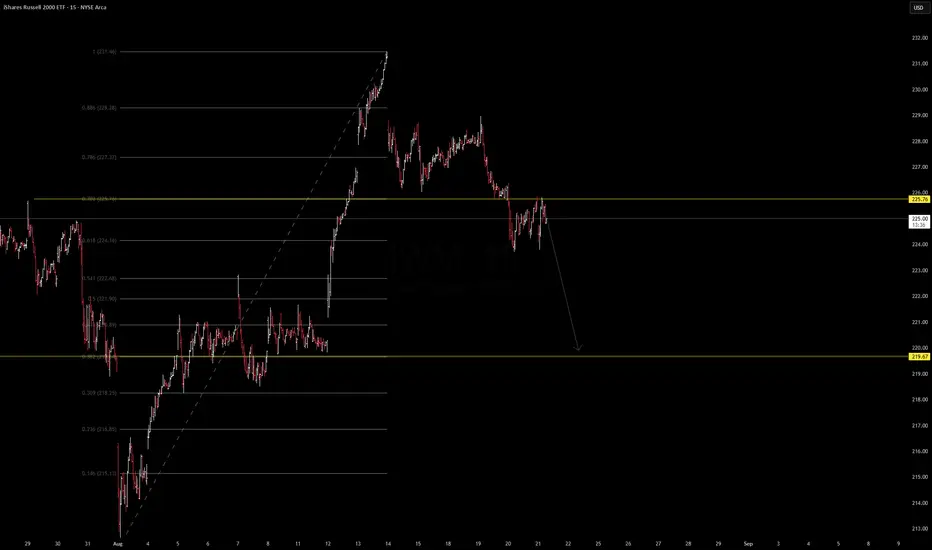
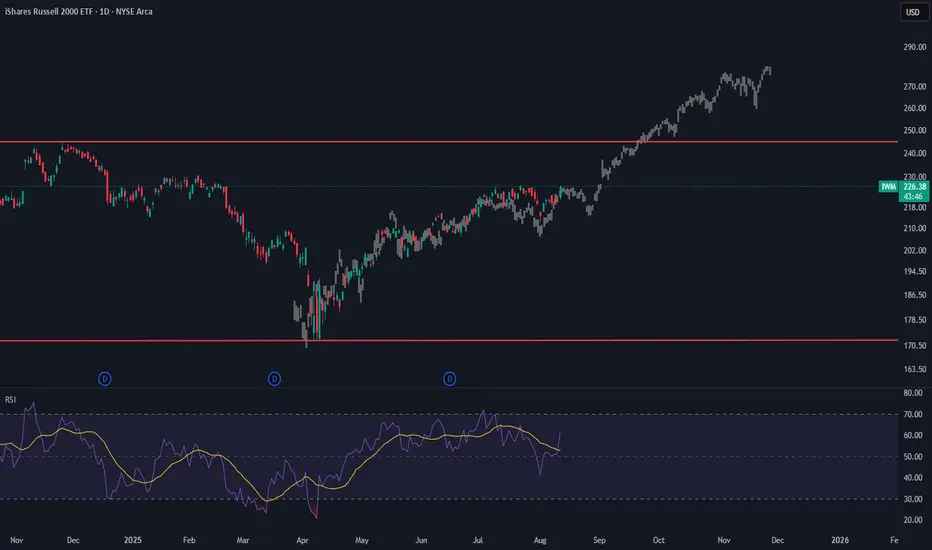
IWM (Russell 2000 ETF) Update - Bearish Analysis. IWM (Russell 2000 ETF) Update
Price rejected from the 226–227 zone (Fib 0.786) and failed to reclaim the breakout structure. Currently consolidating below resistance, which opens room for a possible leg lower.
🔹 Key resistance: 225.7 – 226.0
🔹 Target support: 219.0 zone
🔹 Bias: Short-term bearish unless buyers reclaim above 226
Watching if price accelerates into the 219 demand zone for a potential reaction. Risk management is key in this environment.
IWM Appears Due for a Minimum 40-60% Downside CorrectionOn the lower timeframes IWM has been treating $223 as short term support with much sold put leverage building at $220 and recently IWM has begun to retrace back down into those levels putting those sold puts at risk of expanding the volatility and of squeezing through these short puts as a result.
The short term the loss of this zone could likely squeeze down to $200.
However in the longer term we have been trading within this much larger parallel channel since the peak and bottom of 2008-2009 GFC and have started to form a potential peak paired with a Bearish Shark. I think that if we were to start to see some serious downside the IWM could trade back down to not just the bottom of the channel but down to one of the 3 major horizontal supports I have plotted on the cart down at $121, $85.74, or even $41.11 if things get real bad.
Personally I will be targeting one of the 2 upper horizontal supports in the longer dated positioning while targeting the $210-$200 levels in the short term.
I'd suspect this decline to come especially as Fed Rate cut expectations are completely priced out of the market, it is worth mentioning that fed funds futures around the start of the month dropped their expectations of rate cuts for the September meeting down to 0 and we may now be on the path to pricing in rate hikes as seen in the chart below.
Alternatively the expectations for rates going into the end of December has been on a fast trajectory of pricing out rate cuts as well, starting at 90BPS of rate cuts at the start of the year, now pricing in only 37.5BPS in rate cuts:
This ongoing shift in these fed futures spreads from positive to negative signifies the amount that Fed Funds Futures are expecting the Fed to hike rates with both the instance of rate hikes and rate cuts likely to cause a collapse in credit spreads as the bond market yield shift higher leaving the interest rate sensitive IWM to be one of the most negatively affected.

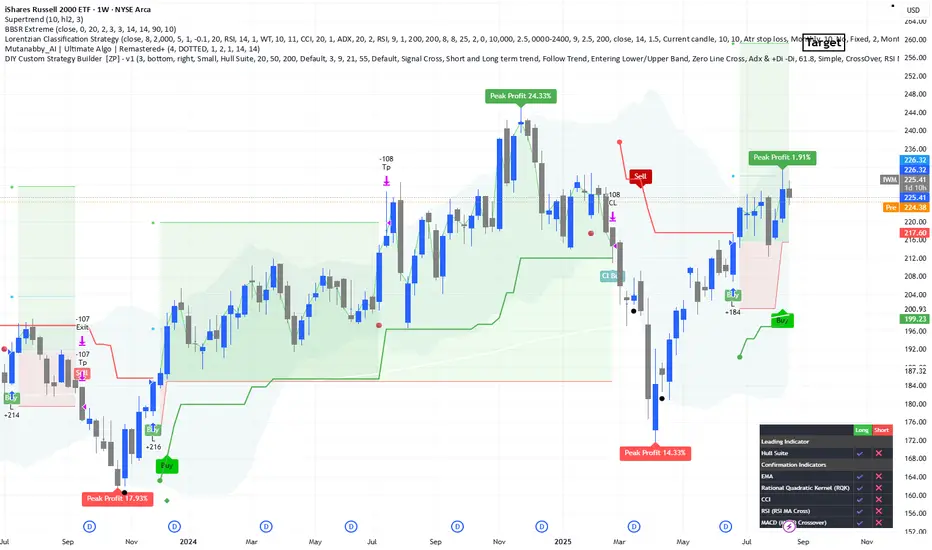
IWM Weekly Setup – Long OpportunitySpotted a promising long setup on the iShares Russell 2000 ETF (IWM) weekly chart. The price action is showing bullish momentum supported by volume and trend indicators.
🔹 Entry Zone: Current levels
🔹 Stop Loss: 196$ – below super trend line
🔹 Target: 260$
Technical indicators and moving averages are aligning for a potential breakout. Risk management is key – keep an eye on volume and macro sentiment.
Let me know your thoughts or if you're watching IWM too!
#IWM #Russell2000 #ETF #TechnicalAnalysis #SwingTrade #TradingSetup #Finance
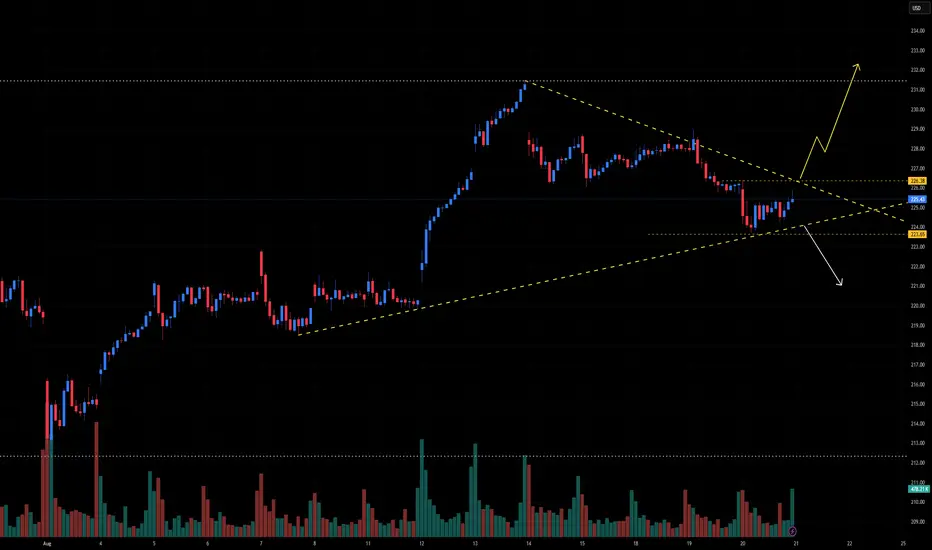
IWM is ready to make a larger move out of this wedge📈 IWM Technical Outlook – Wedge Break Imminent
Ticker: IWM (Russell 2000 ETF)
Timeframe: 30-minute candles
🔍 Current Setup
IWM has formed a symmetrical wedge, with price compressing between a descending resistance line (~227) and an ascending support line (~223.65). This pattern reflects a balance of buyers and sellers — and it’s nearing its apex, signaling that a decisive breakout is likely very soon.
📊 Breakout Levels
🚀 Upside (Bullish Scenario)
Trigger: Close above 227.00 with volume
Intermediate Targets:
231.50–232.00 → Prior swing high resistance
235.00–236.00 → Momentum continuation zone
Measured Move Target: 237.00
🔻 Downside (Bearish Scenario)
Trigger: Close below 223.65 with volume
Intermediate Supports:
221.00 → Local demand area
217.00 → Previous consolidation base
Measured Move Target: 213.50
📈 Volume Analysis
Recent candles show a pickup in volume, a classic sign that markets are preparing for a strong move.
Whichever side breaks first is likely to carry momentum, with follow-through expected.
⚖️ Probability Bias
Current price action suggests buyers are defending the rising trendline, but momentum has slowed since the last rally.
A strong close above 227 would put bulls firmly in control.
Conversely, failure to hold 223.65 opens the door for a deeper correction.
✅ Takeaway
The wedge is tight, and the breakout is imminent:
Bullish Break > 227: Look for 231.50 → 235 → 237
Bearish Break < 223.65: Look for 221 → 217 → 213.50
Stay alert — volume will confirm the true direction.
EMA stackBulls need price to show some bullish action on the 226 support level. We have a nice EMA stack 21 yellow 50 blue and 200 orange. If we do not hold the support at 226 we can test one of those EMA's, or one of the key levels under price.
IWM Day Trading chart with INV H&S PatternYesterday IWM formed an INV H&S pattern that is confirmed, and it retested the entry. Please wait until after opening and confirmation of direction to take the trade.
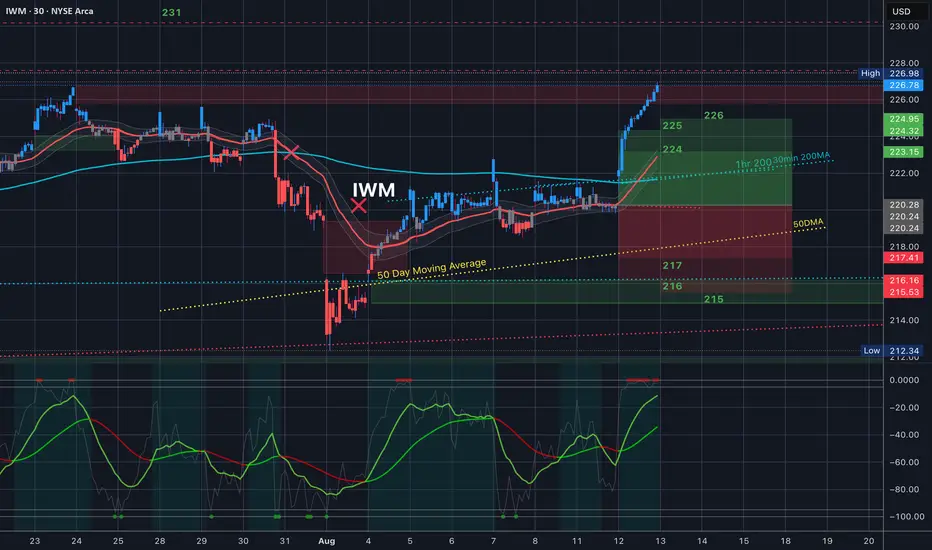
$IWM Analysis, Key Levels & Targets
WOW - look at this crazy move today after CPI. IWM gapped o er the 1hr 200MA and the 30min 200 combo and rallied like crazy. It blew passed all of the levels and filled the bear gap from last month 😳
Spread traders - wait until we are closing within the trading range consistently again.
224 tomorrow?
(HIT GRAB THIS CHART - UNDER THE CHART NEXT TO THE 🚀)
IWM: Just a patternHello,
Looks like it is following this pattern, nothing much.
Might work or not, just saw it and thought of putting it here.
Thanks AMEX:IWM
Is iShares Russell 2000 ETF Setting Up for a Bullish Breakout?Current Price: $220.32
Direction: LONG
Targets:
- T1 = $226.04
- T2 = $231.21
Stop Levels:
- S1 = $218.54
- S2 = $216.78
**Wisdom of Professional Traders:**
This analysis synthesizes insights from thousands of professional traders and market experts, leveraging collective intelligence to identify high-probability trade setups. The wisdom of crowds principle suggests that aggregated market perspectives from experienced professionals often outperform individual forecasts, reducing cognitive biases and highlighting consensus opportunities in iShares Russell 2000 ETF.
**Key Insights:**
The iShares Russell 2000 ETF (IWM), a benchmark for U.S. small-cap stocks, is in consolidation mode after modest underperformance compared to large-cap indices like the S&P 500. Technical signals suggest a potential bullish setup as long as key support levels hold. Breakouts above resistance might reintroduce momentum for long-term gains. This setup comes at a time when large-cap movements may create spillover opportunities for the broader market.
The ETF is currently navigating a support zone, where the behavior of price action will determine its trajectory. Experienced traders emphasize watching for an ascending wedge pattern, signaling upward momentum as long as the $218 support holds firmly.
**Recent Performance:**
IWM has faced short-term bearish pressure despite maintaining its position above significant long-term moving averages. The ETF is trading in a neutral-to-bearish zone with sideways movement, reflecting investor uncertainty around small-cap stocks. While the past few months have seen moderate dips, the ETF has managed to remain resilient, stabilizing within a consolidation range.
**Expert Analysis:**
Financial analysts cite that current technical patterns favor a cautious approach but highlight potential upside if resistance levels near $225.69 are breached. This move could trigger a bullish continuation rally within the small-cap sector. Conversely, a close below $218.72 may signal deeper bearish trends. Experts also note that small-cap stocks could benefit from the so-called "January Effect," where historically, small-cap equities tend to outperform at the beginning of the year, a seasonality factor worth considering.
**News Impact:**
Broader macroeconomic concerns, including inflation and interest rate uncertainty, continue to dampen sentiment in the small-cap market. Additionally, weaker earnings reports from companies within the Russell 2000 Index have dampened enthusiasm. However, the release of positive economic data, including improved employment numbers and GDP growth, along with progress in diplomatic discussions, could spark renewed interest in U.S. smaller-capitalization equities.
**Trading Recommendation:**
The iShares Russell 2000 ETF is poised for potential upside as long as support levels at $218 are defended. Traders are encouraged to take a longer-term bullish stance with targets at $226.04 and $231.21. However, it is crucial to manage risks, with stop levels placed at $218.54 and $216.78 to safeguard positions in case bearish pressure resumes. Continued monitoring for breakout signals will be key for successful execution.
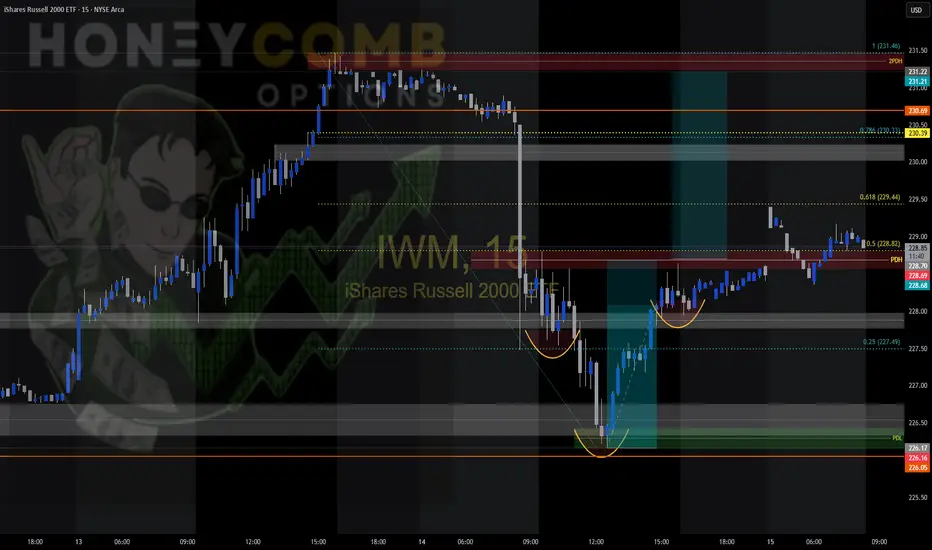
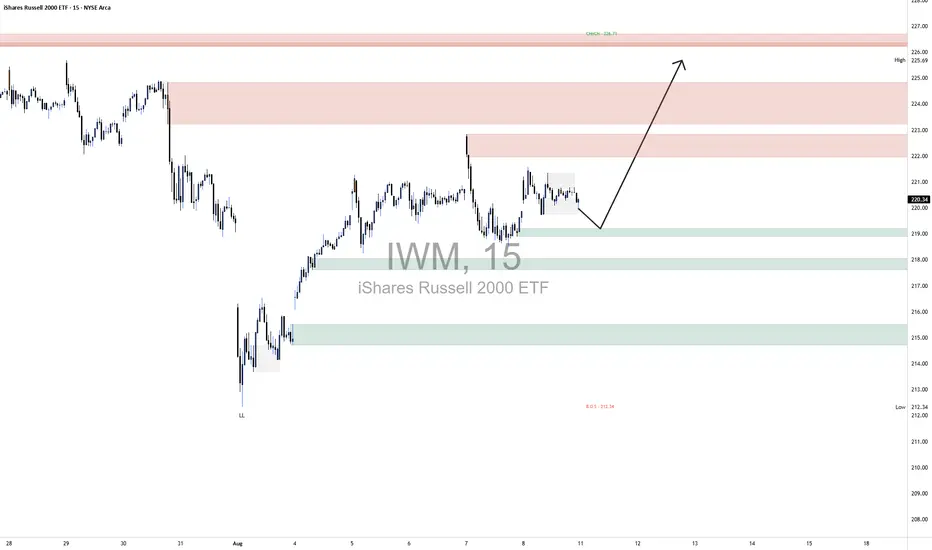
IWM LongOn the 15-minute IWM chart, the broader market structure recently shifted from bearish to bullish after printing a Change of Character (CHoCH) at 226.71, breaking above a prior lower high and signaling a potential reversal. This came after a strong rally from the 212.34 BOS point, where price had previously broken down and set a lower low. The current structure suggests buyers are attempting to reclaim control, and the higher-low pattern forming supports a continuation bias.
Demand is clustered between 217.80–218.80 and a deeper zone at 214.50–215.50. In both areas, buyers stepped in decisively in the past, causing swift upward moves, which marks them as strong zones. Supply is layered between 222.80–224.00 and 226.00–227.00. Price dropped sharply from both these regions previously, showing that sellers were aggressive there, with the upper zone being the key resistance tied to the CHoCH level.
In the marked region, price is consolidating just above the 218s demand zone, holding structure while failing to break higher immediately. This suggests a likely short pullback into the 218.00–218.80 area to reload buy orders before pushing toward the 224.00 mid-supply and possibly retesting the 226.71 high.
Trade bias: Bullish
Expected direction: Higher after a shallow pullback into demand
Invalidation level: A break below 217.80 would undermine the bullish setup
Momentum condition: Slightly favors buyers, with price maintaining higher lows despite stalling at resistance
Candle behavior: Small-bodied candles in consolidation, indicating accumulation rather than heavy selling
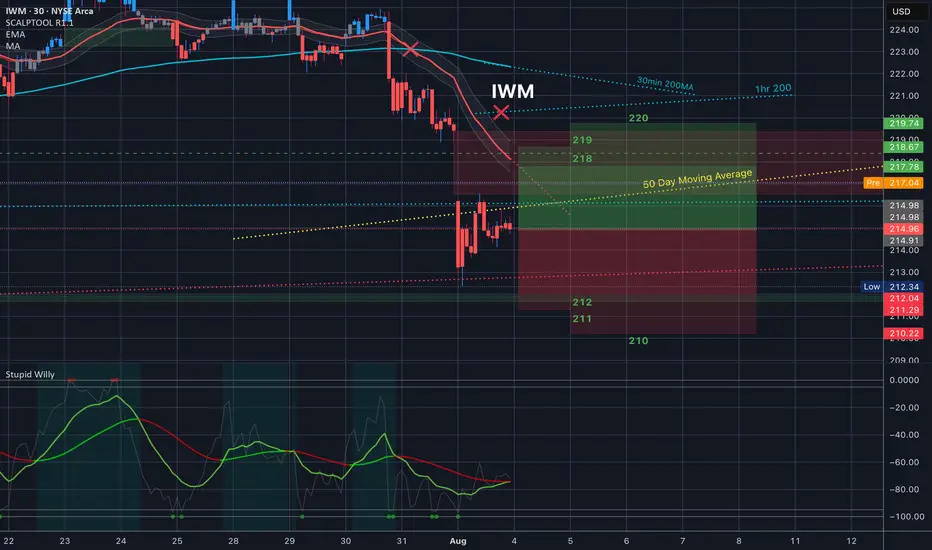
$IWM 30min200 & 1hr200 resistance // Last Friday reviewAMEX:IWM 30min200 & 1hr200 resistance // Last Friday review
Look at how the 1hr 200 and then the 30min 200 have been acting as resistance - and then how they potentially cross in tomorrow’s trading range, with the 35EMA (red line) underneath both of them.
We did start the week gapping up off of the 50Day moving average and we held that!!

The Ghost of 1986-1987 Stock Market Overlay onto $IWMThe 1986-1987 stock market advance was 48% as measured by the S&P500 Index SP:SPX from the low in late 1986 which peaked in August 1987 and crashed into October 19th's spectacular 20% decline in one day.
The advance in the Russell 2000 Index from the low in 2023 to the high in 2024 was 51%, topping the 48% gain in the SP:SPX and the meltdown wasn't as spectacular, but it was similar.
There were similar patterns in fears of trade wars, US dollar declines, new tax laws going into effect back then and tax laws sunsetting this time. Those you can go into by reviewing my other charts I have published over the years here.
I stretched the 1987 pattern to fit the low to the high, so it isn't "exactly" the same time day-to-day for this pattern.
I found it interesting because the chart of AMEX:IWM all by itself had the same "look" to me as the 1987 bull market and crash so I decided to put it together for you all here to see.
I would expect a choppy market from here on as people adjust to the new uncertainties. Sellers of this decline will be shy to reinvest anytime soon and buyers are likely afraid to step up and get aggressive with so much uncertainty.
Sentiment as measured by AAII shows an extremely fearful and reluctant investor class, which is typical to see at major market bottoms.
Wishing everyone peace and prosperity!
Tim West
11:17AM EST April 24, 2025

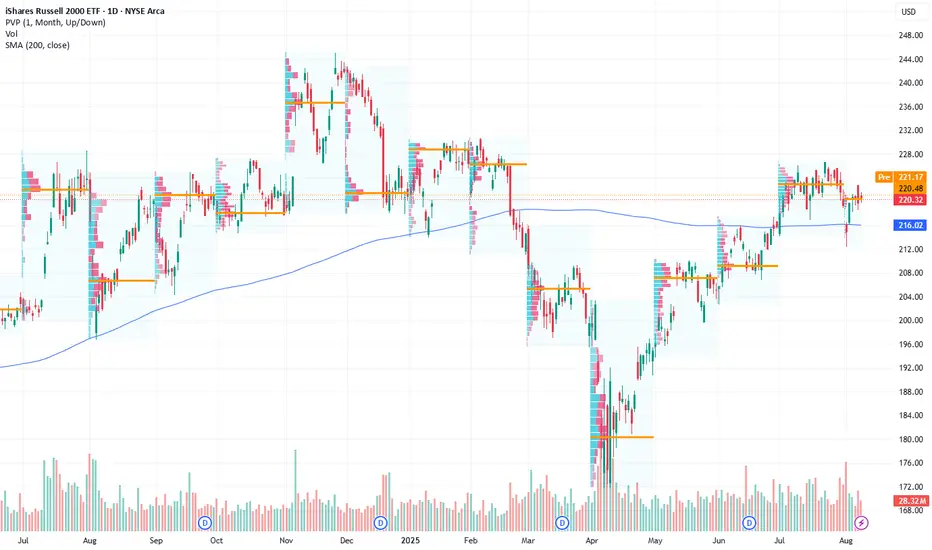
$IWM Analysis, Key Levels & Targets 8.4.25
Today’s Trading Range - we have a great range expansion here from last Friday’s drop. Some interesting targets here. Let me know what you see.
Look at this Battle zone today!! Grab this chart - and let’s go
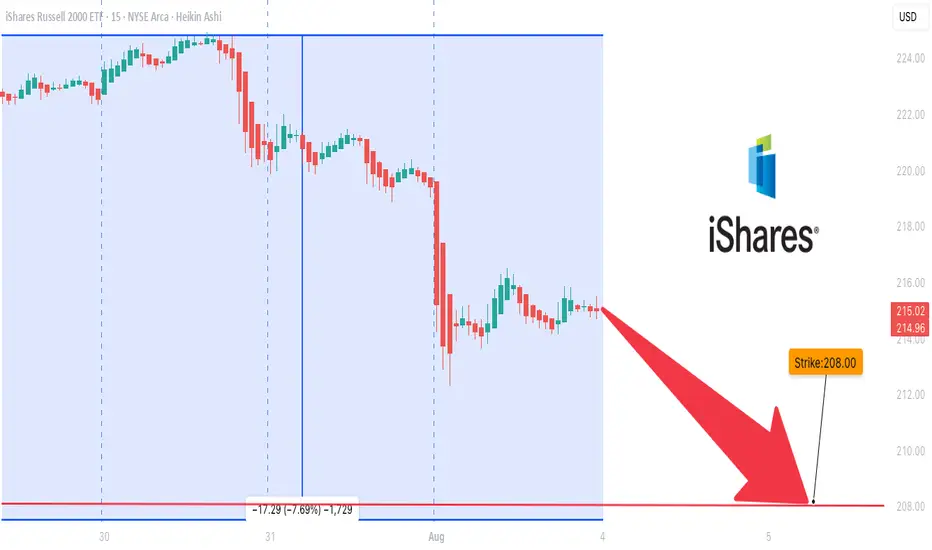
IWM is Overbought### ⚠️ \ AMEX:IWM Bearish Setup Alert — Weekly PUT Trade (Aug 3, 2025)
> **Momentum breakdown + institutional volume = high-probability short play**
📉 **Market Breakdown:**
* **📉 Daily RSI:** 34.9 → Bearish momentum under key 45 level
* **📊 Weekly RSI:** 53.0 → Neutral but slipping = trend weakening
* **📈 Volume Spike:** 1.4x → Institutional moves hint at potential sell-off
* **⚖️ Options Flow:** 1.00 C/P ratio → No bias = wait for price action
* **💀 Max Pain:** \$222.50 → Downward price magnet
* **🌪️ VIX:** 20.38 → Normal vol zone, good for option plays
---
### 💥 Trade Setup – 5D Weekly PUT
| Entry | 🎯 Target | 🛑 Stop Loss | ⚖️ R/R Ratio | 📅 Expiry |
| ------ | ------------- | ------------- | ------------ | ---------- |
| \$0.92 | \$1.35 (+50%) | \$0.45 (-50%) | 1:1.5 | 2025-08-08 |
🔻 **Strike:** \$208.00
💼 **Type:** Naked PUT
⏰ **Timing:** Enter at market open
📈 **Confidence:** 70%
🧠 **Logic:** Bearish RSI + volume surge + neutral flow = downside edge
---
### 🔍 Summary
> “IWM is losing grip. Momentum says down. Big players are already positioning.”
> 🔸 Short-term PUTs offer attractive R/R
> 🔸 Low volatility improves pricing
> 🔸 Weekly RSI still neutral → stay nimble
---
📊 **TRADE DETAILS**
🎯 Instrument: **IWM**
🔀 Direction: **PUT (SHORT)**
🎯 Strike: **\$208.00**
💵 Entry: **\$0.92**
🎯 Target: **\$1.35**
🛑 Stop Loss: **\$0.45**
📅 Expiry: **2025-08-08**
📈 Confidence: **70%**
🕒 Entry Timing: **Open**
---
### 💡 Tag It:
\#IWM #PutOptions #WeeklyTrade #BearishMomentum #RSIAlert #OptionsFlow #MaxPainTheory #VolatilityTrading #MarketOutlook #TradingView #OptionsAlert

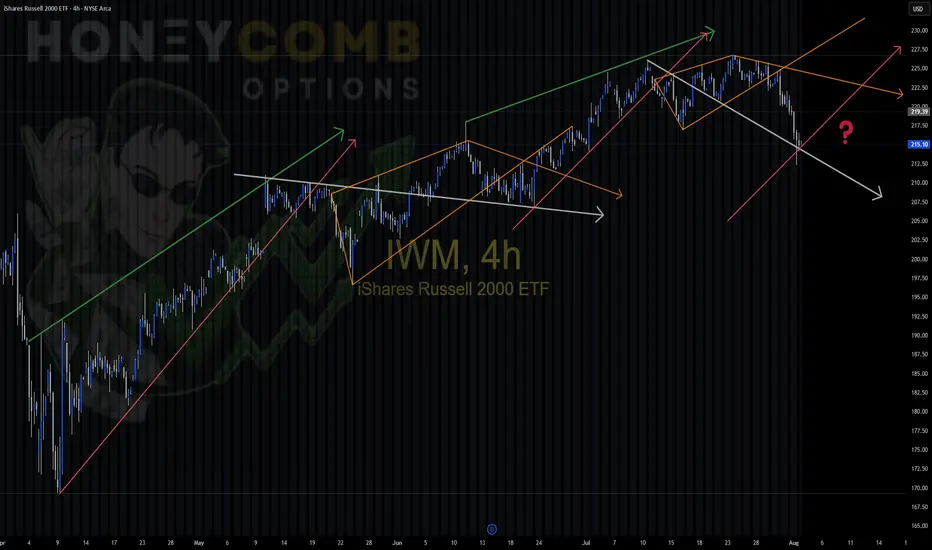
IWM repeating patterns IWM Playing around today noticed similar patterns in this uptrend, color coded for you convenience. Different sizes,, but the patterns are the same. Will we enter a new trend and start a different pattern, or will we stay in the same cycle?