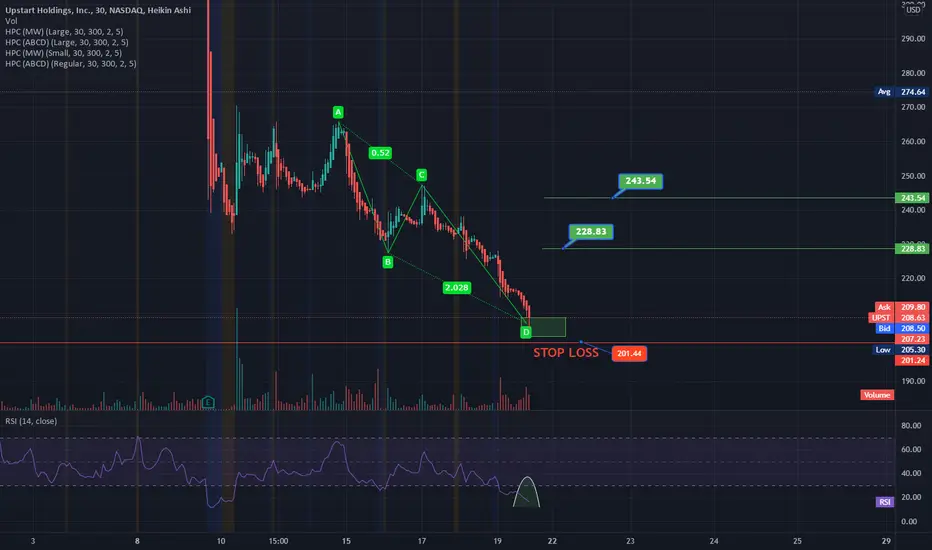
Upstart truns to Downstart???Review Upstart chart is highly recommended!
You can learn most of the technical rules in this chart!
But the most important thing you will learn is:
Market sentiment and price pattern are more important than the fundamentals!
While the fundamentals of this company became better and better, the price crashed more than 60% in the past few weeks!
Looking at my previous analysis could be interesting for you!
You can see the most important support (green lines) and resistance (red lines) to watch in the coming days in these charts!
Best,
Moshkelgosha
DISCLAIMER
I’m not a certified financial planner/advisor, a certified financial analyst, an economist, a CPA, an accountant, or a lawyer. I’m not a finance professional through formal education. The contents on this site are for informational purposes only and do not constitute financial, accounting, or legal advice. I can’t promise that the information shared on my posts is appropriate for you or anyone else. By using this site, you agree to hold me harmless from any ramifications, financial or otherwise, that occur to you as a result of acting on information found on this site.
UPST trade ideas

UPST bounce underway?Looking for a 2 legged bounce in UPST, potential for stronger price action is there.

Bear FlagThe bear flag is a bearish continuation pattern and occurs in a downtrend. The first step in identifying the bear flag is to look for a downtrend. Next, look for a flag or wedge like structure that slopes up against the prevailing downtrend. You can get an idea of where price may go by projecting the length of the pole downward from the flag.
Often when a security has lost this much ground, folks will sell on rallies up to salvage as much as they can as they are probably in financial pain at this point. This could also cause a bear flag.
It is possible for a Bear Flag to break to the upside and a Bull Flag can break to the downside.
UPST has fallen from a head and shoulders pattern a while back.
No recommendation.


Falling Wedge - Gap Fill- BullishUPST starting to look really interesting after seemingly finding a bottom after selling off post-earnings leaving a big gap to fill on the upside. Big falling wedge on the 4-hour timeframe along with a bullish cypher, RSI is also way in oversold territory. Bollinger bands are squeezing on shorter timeframes and buyer volume picking up. Bullish will be looking for a breakout from this wedge & for UPST to go for the gap fill on the upside (Broader Market Conditions Permitting)- Just some support and resistance levels to keep an eye on along with some RSI-based supply and demand zones in the meantime
- Falling Wedge
- Gap on the Upside to Fill
- RSI Oversold
- MACD Cross
- Bullish Cypher Formed
- Bollinger Bands Squeezing on the Hourly Timeframe
PT1- $220.25
PT2- $225.94
PT3- $228.04
PT4- $256.38 + Gap Fill


Upstart ~ UPSTUpstart is right at our dip buying opportunity -- I'd buy with your stop loss at 191. Target is 270-310!!!!
If this falls down even more than the 190 lvl we're looking at 173..
-- If we break 170 area then we go to the 130 support next.

UPST bounceUPST i had been tracking as a risk off play so alot of people have been selling the positions especially with high inflation scares however i am happy to see it finally bounce off the 200MA cloud on my chart i will keep watching to see it build up from here before i go long with shares and options as this would be a good entry point if it starts to consolidate here, when I first reviewed this play i was already bullish and i published that video on youtube as it's great at mitigating risk while still producing solid rev as you can see from earnings reports it has been beating estimates out of the gate

Upstart Has Pulled Back in a Big WayUpstart has been a hypergrowth stock since going public 11 months ago. It priced for $20 on December 15 and ran as high as $401.49 in mid-October. It then stalled and lost more than half its value.
The pullback has brought the fintech near some potentially important levels. First is the price area around $190, where UPST peaked in June. Traders may look for this old resistance to become new support.
Second, the 200-day simple moving average (SMA) is rising quickly from below. Given its short history, the stock has never tested this SMA.
UPST is oversold as well, based on two measures. The Stochastic oscillator fell to its lowest level ever on Friday. Price is also the furthest ever from its 50-day SMA, according to TradeStation’s custom script Distance from MA .
Finally, UPST’s fundamentals have been strong, with results beating estimates the last four quarters.
Despite these potential positives, short-term momentum remains very bearish following the sharp drop. Traders may want to watch for potential stabilization around the 200-day SMA.
TradeStation is a pioneer in the trading industry, providing access to stocks, options, futures and cryptocurrencies. See our Overview for more.

Possible bull to 649Trend based fib extension + strong support + trendline
Could it be possible to reach 649? Let me know.

UPST - BE READY - SET ALERTS All,
UPST with last ER is just a must watch down here it could hold here, or drop down but I for sure think we have a MASSIVE bounce if it drops down on that trend line.
This is all pending the market. SPY falling knives can slice any mid/large cap.

dip buy?holding the $203 support
200 moving average below it
pretty much finished the head and shoulders pattern
great last quarter earnings

UPST - has had an incredible runUPST has had quite the year producing those that took a chance on it some outstanding returns due to the fact it not only asses risk but can also manage returns with it's AI software which has led to some incredible earnings report from the GATE which does not make sense when you look at the price action why the price would fall so much, i am very bullish on this play long term as i see Ai being the future of just about everything i also made a video breakdown the company it's software and some of the price targets smart money has for them

UPST BULLISH NASDAQ:UPST
UPST Need to hold 201 level. We may see it rebound to 228-243 30/min Chart. Stop loss 201.
Is $UPST ready for breakout?After a beautiful bull run now $UPST getting correction. Need to breakout falling wedge for reversal. Mentioned in chart about reversal met support now $206 want here to create a base for reversal. If it misses to hold here next big level will be $191 support level. Good earnings and good growth in revenue stocks to be holder for long run good returns but don’t chase it in down trend let it settle down a mentioned base and start making reversal uptrend.

IS $UPST READY FOR BREAKOUT?$UPST after a beautiful bull run now it is getting correction and need to breakout the falling wedge for reversal. Mentioned points in chart about reversal. Currently $UPST met the support $206 want here to create a base for reversal if it misses to hold next big level will be on $191 support level. Good earnings and good growth stock to be hold for long run but don’t chase it in down trend let it settle down and start making reversal.

Is $UPST Ready for breakout?$UPST after a beautiful bull run now is is getting correction and need to breakout the falling wedge for reversal. Mentioned points in chart about reversal met the support $206 want here to create a base for reversal if it misses to hold next big level will be on $191 support level. Good earnings and good growth to be hold for long term but don’t chase it let it settles down and start making reversal.

$UPST $150-$200 BUY$UPST $150-$200 BUY
Will start watching this area for buying. This name has come down hard and fast and will get a good bounce for a trade at this area. Higher time frame buyers will be here too.

upst dadthis is for you -
watch for confirmation of a trend line break OR confirmation that the horizontal line is NO LONGER as strong a support

Upstart Holdings - Stop-Loss Tested On ThursdayUpstart: Stop-Loss Tested On Thursday on which the trader would have closed the trade.
Original Idea Attached.

Upstart USASun Storm Investment Trading Desk & NexGen Wealth Management Service Present's: SSITD & NexGen Portfolio of the Week Series
Focus: Worldwide
By Sun Storm Investment Research & NexGen Wealth Management Service
A Profit & Solutions Strategy & Research
Trading | Investment | Stocks | ETF | Mutual Funds | Crypto | Bonds | Options | Dividend | Futures |
USA | Canada | UK | Germany | France | Italy | Rest of Europe | Mexico | India
Disclaimer: Sun Storm Investment and NexGen are not registered financial advisors, so please do your own research before trading & investing anything. This is information is for only research purposes not for actual trading & investing decision.
#debadipb #profitsolutions

$UPST Analysis$UPST analysis
Looks like we might be nearing the W4 bottom. Could be worth a try with a tight SL below 228 and a PT of 300+
35% upside vs 3.5% risk. Shares over calls since they're expensive AF

'Just a Punt' Idea: Buy/Long Upstart HoldingsCurrent: $240.48
Stop: $228.00
Target: $270.00
Thesis: Has come off quite a bit and is printing a piercing candle.
Just a punt...so keep it small.
