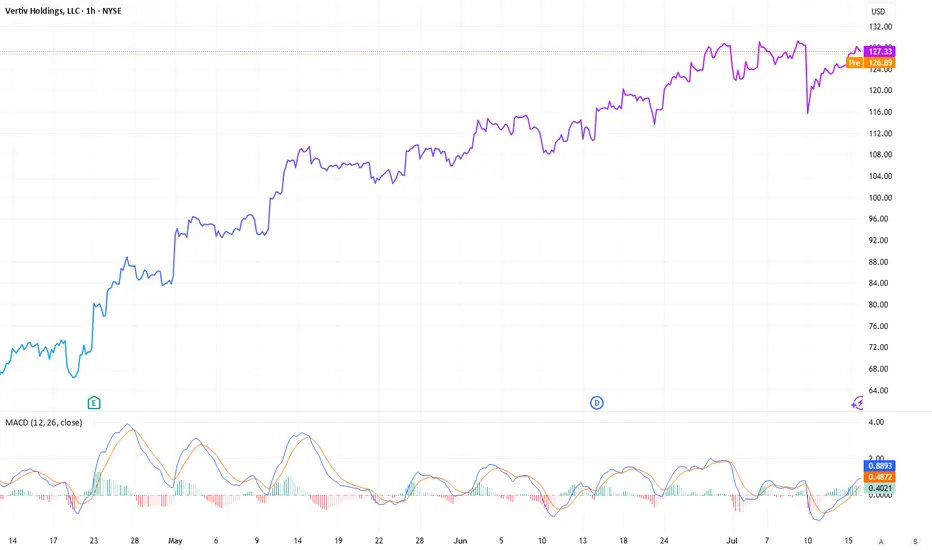
Inverse H&S forming on VRT? Am I hallucinating, or does that not look like the most clear-cut inverse H&S pattern?
Full disclosure, I have no idea whether this will breakout at all. I was just cruising through some data center-related stocks and spotted this interesting formation.
Leaving this here to look back on in a few
Next report date
—
Report period
—
EPS estimate
—
Revenue estimate
—
40.20 MXN
10.34 B MXN
167.04 B MXN
374.65 M
About Vertiv Holdings, LLC
Sector
Industry
CEO
Giordano Albertazzi
Website
Headquarters
Westerville
Founded
1946
ISIN
US92537N1081
FIGI
BBG01N2S0KS9
Vertiv Holdings Co. engages in the design, manufacture, and service of critical digital infrastructure technology for data centers, communication networks, and commercial and industrial environments. It also offers power management products, switchgear and busbar products, thermal management products, integrated rack systems, modular solutions, and management systems for monitoring and controlling digital infrastructure. It operates through the following geographical segments: Americas, Asia Pacific, and Europe, Middle East, and Africa (EMEA). The Americas segment offers products and services sold for applications within the data center, communication networks, and commercial and industrial markets in North America and Latin America. The Asia Pacific segment includes products and services sold for applications within the data center, communication networks, and commercial or industrial markets throughout Greater China, Australia and New Zealand, Southeast Asia, and India. The EMEA segment focuses on products and services sold for applications within the data center, communication networks, and commercial and industrial markets in Europe, Middle East, and Africa. The company was founded in 1946 and is headquartered in Columbus, OH.
Related stocks

VRT – Demand Zone Defense & Trend Break📊 VRT – Demand Zone Defense & Trend Break
The past four sessions tested conviction. After a clean downtrend break, NYSE:VRT tapped into the $125–127 demand zone and attracted strong buyer aggression — exactly where liquidity confluence aligned with the 0.702 retracement.
🔹 Market Structure
Down

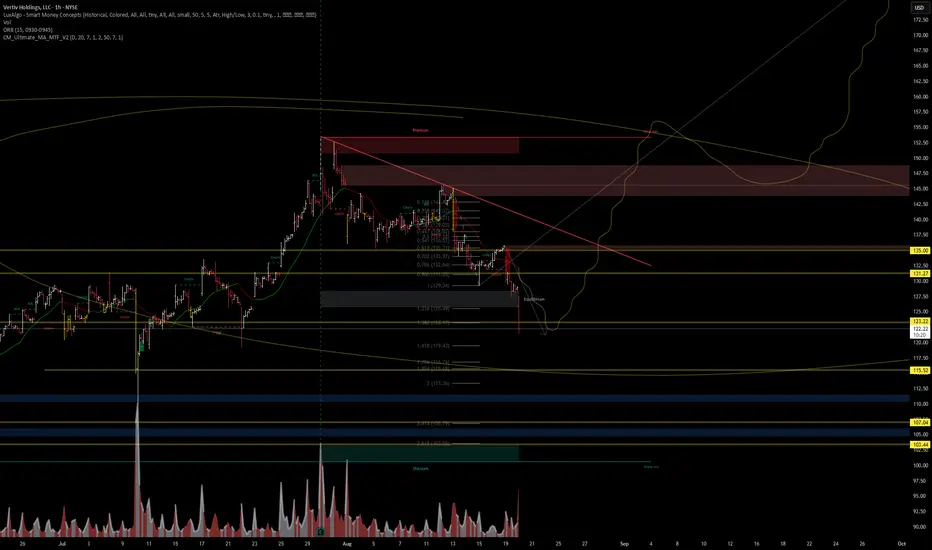
3rd Day in the trade, trusting AI to manage the risk🔎 Chart Structure & Key Zones
Trend Context: The chart shows a recent breakdown from an uptrend. Price rejected near ~$145–148 (supply zone), confirming resistance.
Current Price: ~$122, trading under key moving averages and inside a corrective structure.
Volume Profile: Distribution spikes near
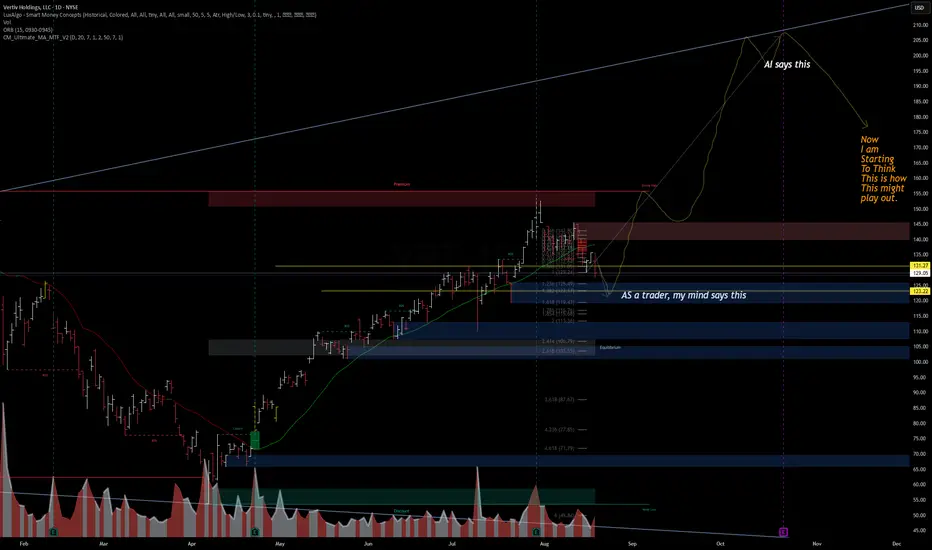
$VRT | Vertiv Holdings – AI vs Trader Mindset📊 NYSE:VRT | Vertiv Holdings – AI vs Trader Mindset
Interesting divergence here:
AI projection (yellow path) suggests a continuation higher toward $200+ before a macro pullback.
Trader’s view (blue zones) highlights liquidity gaps and possible retracement targets at $123, $116, and $106 before
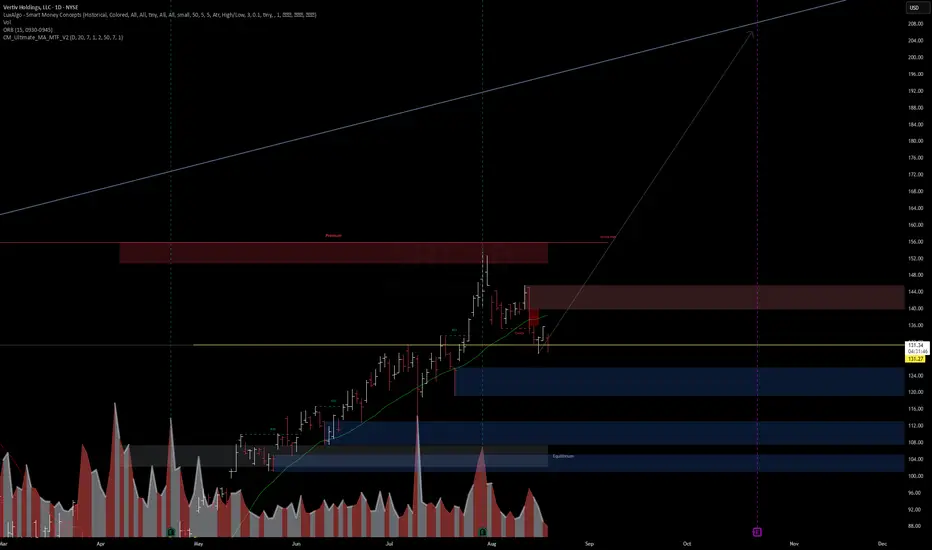
2nd Day in the trade. VRTPositions down, had an unexpected sell-off from the market. Position taken for a month, until next ER, will observe the price, volume, and participants. AI models have not changed, see you at $150
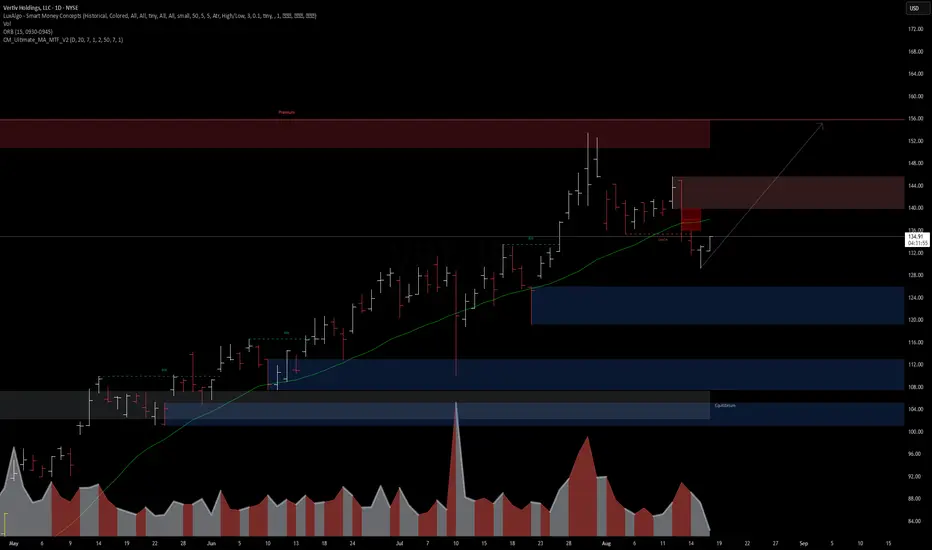
VRT (Vertiv Holdings) – Institutional Forecast & Smart Mone🔮 Forecast & DSS Outlook
Current Price: $134.77
Institutional Forecast Model: STRONG BUY
Target: $154.53 (+14.7% upside in 30 days)
Confidence Interval: $131.71 – $161.46
Expected Return: +14.66%
Risk/Reward: 1.74 : 1
Model Agreement: 7 of 9 bullish
📈 Our DSS (Decision Support System) signal
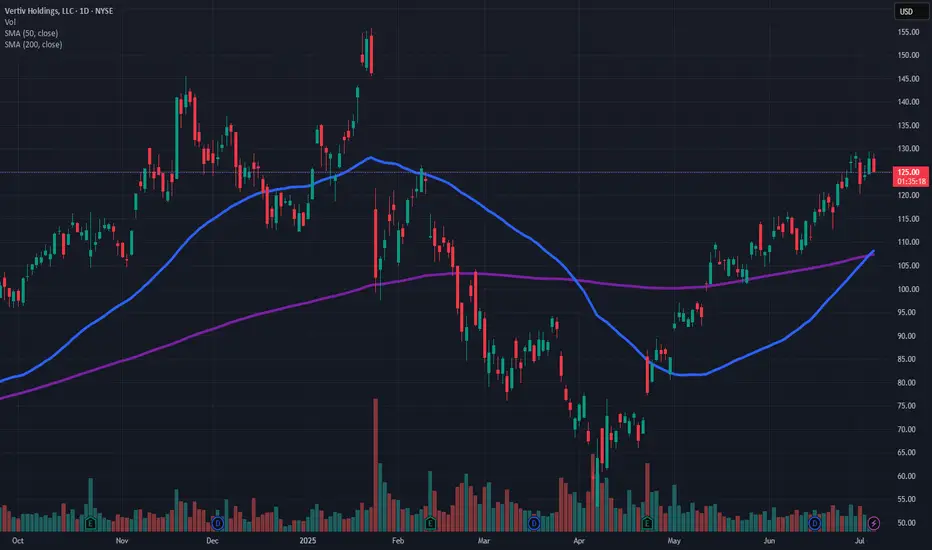
VRT : Long Position Vertiv Holdings is trading above the 50 and 200-period moving averages.
It has overcome the resistances one by one without being exposed to a very high IV.
It has started to draw a cup.
However, it is much better to focus on the big gap rather than the cup formation because with good chances it c

Vertiv Holdings: Powering the AI ProgressionNYSE:VRT NASDAQ:NVDA NASDAQ:META NYSE:ETN NASDAQ:CEG
While investors are engaged in a race “identify the next major microchip manufacturer”, a quieter opportunity is emerging at the crossroads of artificial intelligence (AI), infrastructure, and long-term demand. Vertiv Holdings (VRT), a c
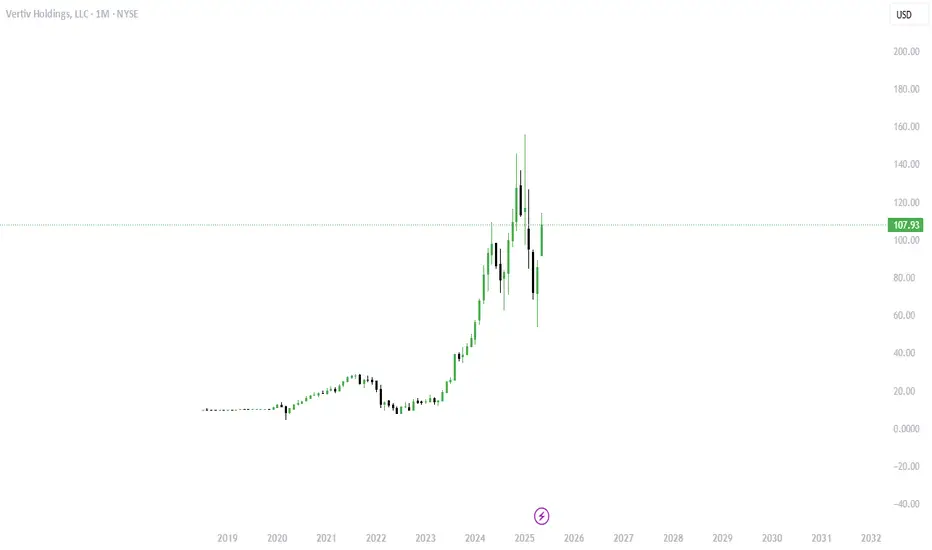
The Picks and Shovels of The AI Boom1. Six-Month Price Trend
Long-term uptrend: Over the past 6 months, VRT has climbed from ~ $54 to a recent high around $155—deep into a clear bullish channel
Pullbacks vs higher lows: Corrections have consistently bounced off rising trend-lines and key moving averages (50 & 200-day), reinforcing t
Is VRT (they make cooling systems for data centers) a buy ?Vertiv Holdings Co. (NYSE: VRT) is a leading provider of critical digital infrastructure and continuity solutions, particularly for data centers. Here's an overview of its recent performance, valuation, and potential challenges:
Financial Performance
Q1 2025 Highlights:
-Revenue: $2.04 billion
See all ideas
Summarizing what the indicators are suggesting.
Neutral
SellBuy
Strong sellStrong buy
Strong sellSellNeutralBuyStrong buy
Neutral
SellBuy
Strong sellStrong buy
Strong sellSellNeutralBuyStrong buy
Neutral
SellBuy
Strong sellStrong buy
Strong sellSellNeutralBuyStrong buy
An aggregate view of professional's ratings.
Neutral
SellBuy
Strong sellStrong buy
Strong sellSellNeutralBuyStrong buy
Neutral
SellBuy
Strong sellStrong buy
Strong sellSellNeutralBuyStrong buy
Neutral
SellBuy
Strong sellStrong buy
Strong sellSellNeutralBuyStrong buy
Displays a symbol's price movements over previous years to identify recurring trends.
Frequently Asked Questions
The current price of VRT is 2,595.00 MXN — it hasn't changed in the past 24 hours. Watch Vertiv Holdings Co. Class A stock price performance more closely on the chart.
Depending on the exchange, the stock ticker may vary. For instance, on BMV exchange Vertiv Holdings Co. Class A stocks are traded under the ticker VRT.
VRT stock has risen by 4.68% compared to the previous week, the month change is a 9.48% rise, over the last year Vertiv Holdings Co. Class A has showed a 51.49% increase.
We've gathered analysts' opinions on Vertiv Holdings Co. Class A future price: according to them, VRT price has a max estimate of 3,172.57 MXN and a min estimate of 2,053.92 MXN. Watch VRT chart and read a more detailed Vertiv Holdings Co. Class A stock forecast: see what analysts think of Vertiv Holdings Co. Class A and suggest that you do with its stocks.
VRT stock is 0.00% volatile and has beta coefficient of 2.49. Track Vertiv Holdings Co. Class A stock price on the chart and check out the list of the most volatile stocks — is Vertiv Holdings Co. Class A there?
Today Vertiv Holdings Co. Class A has the market capitalization of 1.01 T, it has increased by 0.05% over the last week.
Yes, you can track Vertiv Holdings Co. Class A financials in yearly and quarterly reports right on TradingView.
Vertiv Holdings Co. Class A is going to release the next earnings report on Oct 22, 2025. Keep track of upcoming events with our Earnings Calendar.
VRT earnings for the last quarter are 17.82 MXN per share, whereas the estimation was 15.61 MXN resulting in a 14.16% surprise. The estimated earnings for the next quarter are 18.03 MXN per share. See more details about Vertiv Holdings Co. Class A earnings.
Vertiv Holdings Co. Class A revenue for the last quarter amounts to 49.49 B MXN, despite the estimated figure of 44.16 B MXN. In the next quarter, revenue is expected to reach 47.26 B MXN.
VRT net income for the last quarter is 6.08 B MXN, while the quarter before that showed 3.37 B MXN of net income which accounts for 80.45% change. Track more Vertiv Holdings Co. Class A financial stats to get the full picture.
Yes, VRT dividends are paid quarterly. The last dividend per share was 0.69 MXN. As of today, Dividend Yield (TTM)% is 0.10%. Tracking Vertiv Holdings Co. Class A dividends might help you take more informed decisions.
Vertiv Holdings Co. Class A dividend yield was 0.10% in 2024, and payout ratio reached 8.77%. The year before the numbers were 0.05% and 2.10% correspondingly. See high-dividend stocks and find more opportunities for your portfolio.
As of Sep 21, 2025, the company has 31 K employees. See our rating of the largest employees — is Vertiv Holdings Co. Class A on this list?
EBITDA measures a company's operating performance, its growth signifies an improvement in the efficiency of a company. Vertiv Holdings Co. Class A EBITDA is 35.05 B MXN, and current EBITDA margin is 20.67%. See more stats in Vertiv Holdings Co. Class A financial statements.
Like other stocks, VRT shares are traded on stock exchanges, e.g. Nasdaq, Nyse, Euronext, and the easiest way to buy them is through an online stock broker. To do this, you need to open an account and follow a broker's procedures, then start trading. You can trade Vertiv Holdings Co. Class A stock right from TradingView charts — choose your broker and connect to your account.
Investing in stocks requires a comprehensive research: you should carefully study all the available data, e.g. company's financials, related news, and its technical analysis. So Vertiv Holdings Co. Class A technincal analysis shows the buy rating today, and its 1 week rating is strong buy. Since market conditions are prone to changes, it's worth looking a bit further into the future — according to the 1 month rating Vertiv Holdings Co. Class A stock shows the neutral signal. See more of Vertiv Holdings Co. Class A technicals for a more comprehensive analysis.
If you're still not sure, try looking for inspiration in our curated watchlists.
If you're still not sure, try looking for inspiration in our curated watchlists.