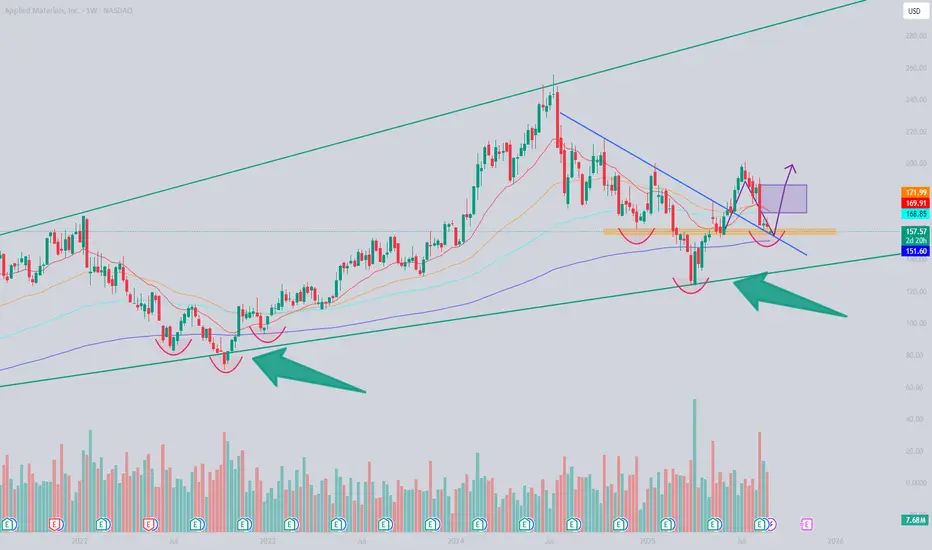
AMAT IDEACurrent demand level is a weak one and we can expect that this level will induce early buyers which can get wiped out when we set another bearish leg down to the next demand level where we can look to buy from.
Trade ideas

AMAT eyes on $228: Dual Fib zone ideal support for a Higher-LowAMAT has been lacking any direction for quite a while.
Dipped into a significant support zone at $227.70-227.99
Look for a clean bounce or a Break-n-Retest if dips below.
.
Previous Analysis that caught the EXACT BOTTOM:
Hit BOOST and FOLLOW for more such PRECISE and TIMELY charts.
========================================================
.

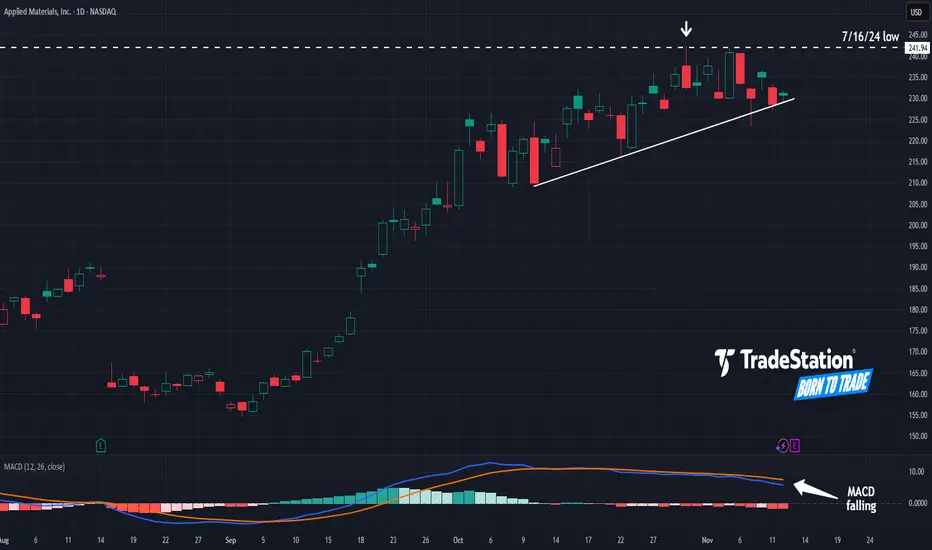
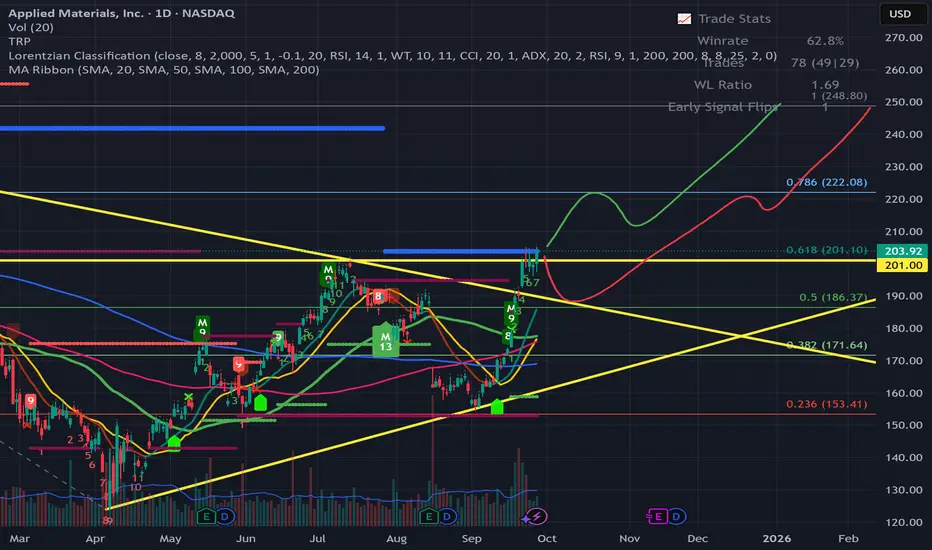
Applied Materials May Be TeeteringApplied Materials has rallied along with other tech stocks, but some traders may think the chip-equipment name is teetering.
The first pattern on today’s chart is the $241.94 level. It was a low in July 2024, immediately after the Biden Administration restricted exports to China. AMAT peaked at the same price last month, which may suggest old support has become new resistance.
Second, MACD has declined for several weeks. That may reflect slowing momentum.
Third, you have the series of higher lows since October 10. AMAT has tested that trendline recently. Could a breakdown trigger selling?
TradeStation has, for decades, advanced the trading industry, providing access to stocks, options and futures. If you're born to trade, we could be for you. See our Overview for more.
Past performance, whether actual or indicated by historical tests of strategies, is no guarantee of future performance or success. There is a possibility that you may sustain a loss equal to or greater than your entire investment regardless of which asset class you trade (equities, options or futures); therefore, you should not invest or risk money that you cannot afford to lose. Online trading is not suitable for all investors. View the document titled Characteristics and Risks of Standardized Options at www.TradeStation.com . Before trading any asset class, customers must read the relevant risk disclosure statements on www.TradeStation.com . System access and trade placement and execution may be delayed or fail due to market volatility and volume, quote delays, system and software errors, Internet traffic, outages and other factors.
Securities and futures trading is offered to self-directed customers by TradeStation Securities, Inc., a broker-dealer registered with the Securities and Exchange Commission and a futures commission merchant licensed with the Commodity Futures Trading Commission). TradeStation Securities is a member of the Financial Industry Regulatory Authority, the National Futures Association, and a number of exchanges.
TradeStation Securities, Inc. and TradeStation Technologies, Inc. are each wholly owned subsidiaries of TradeStation Group, Inc., both operating, and providing products and services, under the TradeStation brand and trademark. When applying for, or purchasing, accounts, subscriptions, products and services, it is important that you know which company you will be dealing with. Visit www.TradeStation.com for further important information explaining what this means.
Applied Materials | AMAT | Long at $169.75Republican Ashley Moody recently dropped $200k-$500k on Applied Materials $NASDAQ:AMAT. The semiconductor boom may not be over...
Price-to-earnings: 21.68x (great in comparison to others...)
Debt-to-equity: 0.34x (low)
Cash flow: $10.4 billion (FY2024)
Insiders awarded options recently
Unless NASDAQ:NVDA brings the market down, NASDAQ:AMAT is in a personal buy zone at $169.75. While the price may dip in the near-term to the $140s, bullish until the semi boom dies...
Targets:
$195.00
$215.00
$240.00

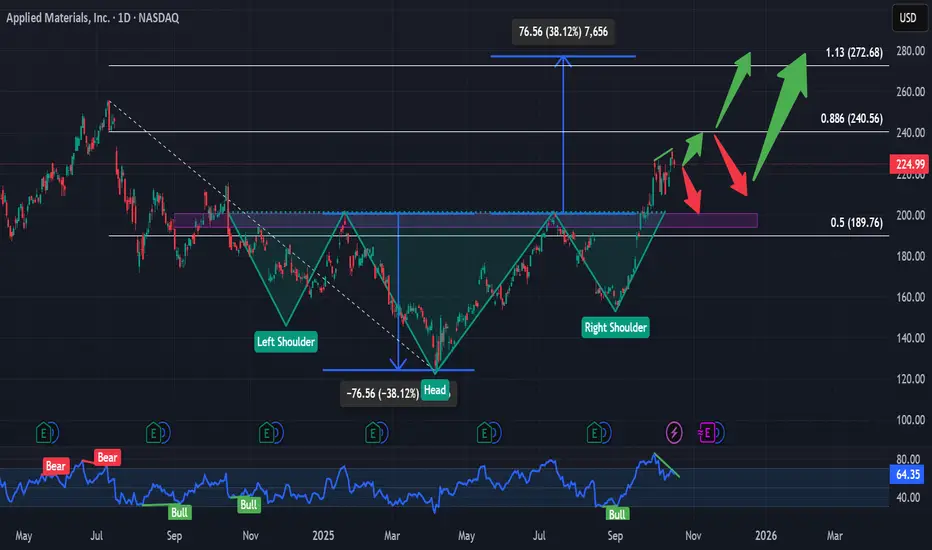
$AMAT Inverse head and shoulders patternNotes for self: will possibly buy if it follows the red arrows, sell if it reaches the green arrows.
Puts on AMAT 10/16Early morning rise then shakeout the longs. Indices down; same pattern as yesterday the15th.
Looking for further decline with uncertainty. Ie, China tariffs, Gov't shutdown

AMAT LongThe broader market structure on AMAT (15-minute) shows a clear bearish trend following the major Break of Structure (BOS) at 226.46, where price violated a previous higher low and shifted momentum downward. This BOS confirmed the end of the prior bullish leg and established a lower-high–lower-low sequence. The most recent swing low at 211–212 marks potential short-term support, and a decisive Change of Character (CHoCH) would only occur if price breaks back above 218–219, signaling that buyers have regained control.
The supply zones between 222–225 remain strong—each time price reached these areas, sellers stepped in aggressively, producing long upper wicks and strong downside moves. The most recent reaction from mid-range supply at 218–220 was particularly sharp, confirming heavy selling interest and validating the bearish continuation bias. On the demand side, the 211–212 zone has been a critical base where buyers previously stepped in with strength, creating a rally that reclaimed over four points before losing steam. This suggests the zone retains moderate strength, though it may weaken if retested quickly.
Currently, price is testing that same demand region again after a steep decline from supply, showing some stabilization but no confirmed reversal yet. Candles are forming smaller bodies with lower wicks, signaling an early response from buyers, though momentum still favors sellers after the recent impulsive drop. The likely near-term scenario is a minor pullback into the 214–215 area (50% retracement) before a potential continuation higher toward 217, provided the 211.50–212 zone holds firm. A clean break and close below 211 would invalidate the bullish retracement idea and open the path toward the deeper demand cluster near 204–205.
Momentum currently leans slightly bearish, but short-term exhaustion suggests a corrective bounce could develop. There are no major news or macroeconomic catalysts supporting this setup today, so intraday order flow and technical reaction at demand will drive the next move.
Trade bias: short-term bullish retracement within a broader bearish structure.
Key invalidation level: sustained breakdown below 211.00.

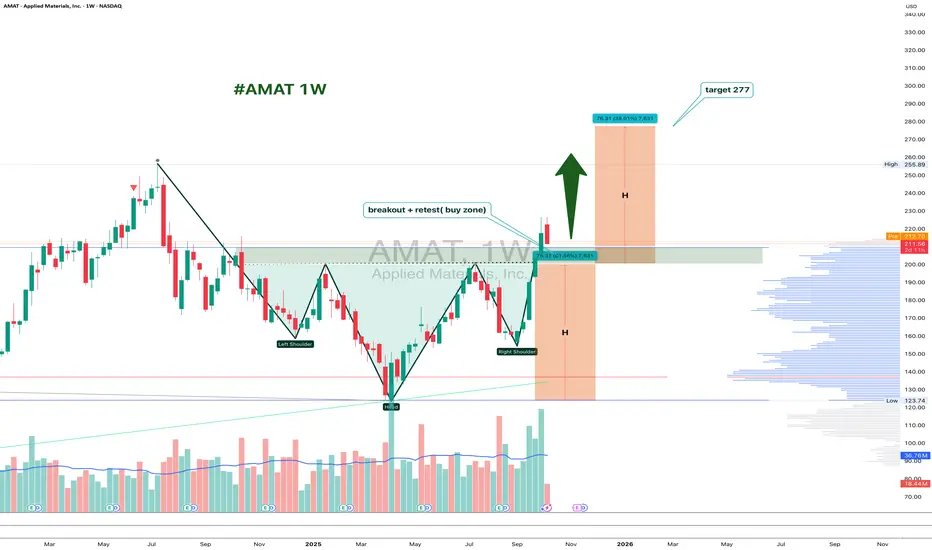
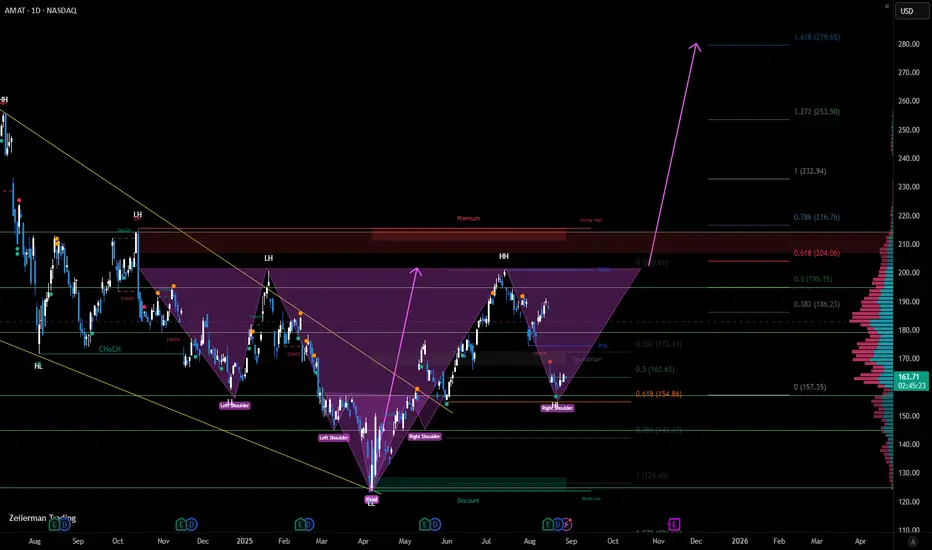
AMAT 1W: Retesting the Neckline Before the Next Move?On the weekly chart, Applied Materials (AMAT) has completed a clean inverted head and shoulders breakout around $226, and is now pulling back to retest the neckline zone near $200–211.
This area acts as strong support. If buyers defend it, the bullish pattern stays valid, with a projected target around $277, matching the 1.618 Fibonacci extension.
From a fundamental perspective, AMAT remains a key semiconductor player, benefiting from ongoing demand for chip-making equipment. The pullback looks more like a healthy pause than weakness - a classic chance for latecomers to re-enter.
Funny enough, the “head and shoulders” pattern, known for signaling tops, is doing the exact opposite here - apparently, even the market likes a good plot twist.
AMAT-upside outlookAMAT previous monthly/3 months timeframe closed pretty much confirm the reversal to the upside.
My targets are $270-440-(best case)720

AMAT, ready for next ATHAfter retracement Fib 0,618, seeking for 200, for resistance level as neckline, and then target can be 280 for inverse head and shoulders which is almost same for Fib extension of 1.618 .
* Not for trading advice *
AMAT - Applied Materials Inc. - Broke Previous HighHello Everyone,
This is the second one that i added to my Watch List.
AMAT - Applied Materials Inc. - What They do?
Applied Materials Inc. is a global technology company focused on material engineering solutions for the semiconductor, flat panel display, and solar photovoltaic (PV) industries. The company is headquartered in Santa Clara, California, and has more than 110 locations in 19 countries, including Canada, China, Japan, and Israel. Serving a global audience, the firm generates around 80% of its revenue in Asia. Applied Materials Inc. holds around 14,300 patents and was named one of the World’s Most Admired Companies by Fortune in 2021. The company has been in operation since 1967.
The firm’s manufacturing and process technologies are used to build some of the world’s most complex chips and displays, enabling the company’s customers to build faster memory chips and processors, super high-resolution displays, and flexible electronics. The company’s products are used in liquid crystal displays (LCDs), organic light emitting diodes (OLEDs), TVs, personal computers, and smart phones.
Applied Materials Inc. has a strong commitment to sustainability and corporate responsibility. Investor’s Business Daily included the firm on its list of the best ESG companies in 2020, and the company also made the Barrons list of the top 100 Most Sustainable Companies in 2021.
Base information says that it is quite sustinable Business :)
Financial Details:
Market Cap : 162.45 B
Revenue : 28.61 B
EPS : 8.3874
P/E : 24.31
Dividend (Yield) : 1.78 (0.87)
Financially they are looking in a good position as well and even they pay Dividends.
Technical Part:
I found AMAT when i performed a my scan for break out stocks . On Friday it broke to previous high level which is 201 , also begining of the last week actually there was a break out .
I see 2 possibilities like i draw Red and Green.
If it achives to stay above this level then hit to 222 and possible quick pull-back, final price target is 245-250.
If it decides to pull-back and not achive to stay above this level (201), then there is a possibility to pull-back till 186-187 . If it prices like this then these levels could be a good buy levels, and final price target is same 245-250.
It's worth to add watch list for next week.
This is just my thinking and it is not invesment suggestion , please do not make any decision with my anaylsis.
Happy Weekend to All
AMAT – Inverse Head & Shoulders BreakoutApplied Materials just broke above the $200–205 neckline of a clean Inverse H&S on the weekly chart.
After a strong run in the past month, price may pause or retest the breakout zone before continuation.
Plan:
✅ Light entry above $205
✅ Add on pullback/consolidation near neckline
❌ Invalidation below $195 / $160 (right shoulder)
🎯 Target: $250 (ATH zone)
The pattern projects even higher (~$275–280), but $250 is the first realistic milestone. Watching closely for follow-through or a healthy retest.

AMAT📌 Stock: Applied Materials (AMAT)
Current Price: ~$204
Timeframe: Daily Chart
Sector: Semiconductors / Tech
📊 Technical Structure Overview
This chart suggests a bullish long-term setup with well-defined:
Entry Zone: $170 – $185
Stop Loss: $153
Target Zone: $322 – $331
✅ Support and Entry Zone (Green Box: $170 – $185)
This area has acted as previous resistance, which has now turned into strong support (classical role reversal).
Multiple price reactions around this zone confirm its validity.
A pullback into this area offers a high-probability long entry with favorable risk-to-reward.
🟥 Stop Loss Level: $153
Placing the stop slightly below the key support ensures that you're out if the setup breaks down.
This level is well below structure and reduces chances of getting wicked out during minor volatility.
Loss at this point would suggest a change in trend and invalidation of the current setup.
🎯 Target Zone: $322 – $331 (Red Box)
This is a measured target based on previous price extensions and major resistance zone (likely all-time highs or psychological round numbers).
It also aligns with a bullish breakout pattern (potential ascending triangle or cup & handle forming).
Achieving this target implies a +60% upside from current levels.
📈 Bullish Roadmap (Blue Projection Path)
The projected price action suggests:
Higher highs and higher lows formation.
Healthy corrections followed by trend continuation.
A multi-month bullish cycle is expected.
🔍 Volume & Structure Observation
The volume appears to support a strong breakout from the previous consolidation zone.
The structure resembles a long-term accumulation base, now transitioning into a markup phase.
Historical volatility around earnings should be monitored.
🧠 Risk-Reward Analysis
Entry Range Stop Target Risk/Reward
$170–$185 $153 $322–$331 ~1:4 to 1:5
This is a highly favorable risk-to-reward ratio, making it an ideal setup for swing or position traders.
🧭 Strategic Summary
Aspect View
Trend Bullish
Current Position Breakout
Best Entry Pullback to $185–$170 zone
Risk Management Stop below $153
Long-Term Target $322–$331
Time Horizon 12–24 months
⚠️ Risk Considerations
Watch macroeconomic trends (interest rates, chip demand cycles).
Monitor earnings and forward guidance.
Maintain position sizing discipline—despite strong setup, external factors can shift sentiment quickly.

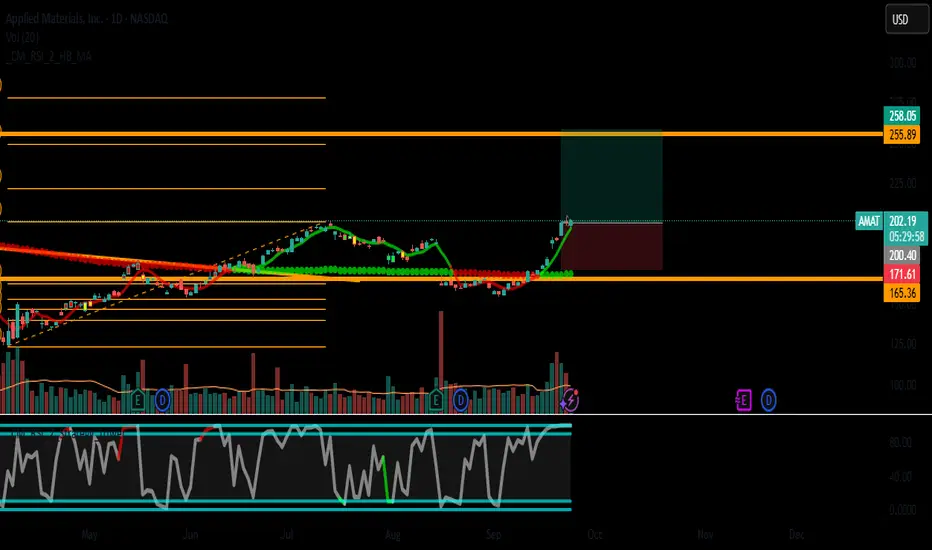
AMAT (Applied Materials, Inc.) - Long Setup🎯 Idea: LONG
⏰ Timeframe: Daily / Weekly (Position Trade)
📊 Pattern: Bullish Trend Continuation
Fundamental Context (General Knowledge - Not from provided data):
Business: World's Largest Semiconductor Equipment Supplier.
Catalyst: AI Boom, Advanced Packaging, CHIPS Act Beneficiary.
Sector Trend: Strong structural demand for semiconductor manufacturing equipment.
Technical Setup:
Trend (D1): Bullish ✅
Entry: $202.30 (Pullback to key support / moving average confluence).
Stop Loss (SL): $170.00 (Below major swing low and psychological support).
Take Profit (TP): $258.00 (Projected upside based on measured move and historical resistance).
Momentum: Price trading above key moving averages, trend structure intact.
Risk Management:
Risk/Reward (R:R): 1:1.7
Note: Wider stop due to stock's volatility. Adjust position size accordingly.
Summary: A position trade on the leader in semiconductor capital equipment, capitalizing on the long-term secular growth in AI and advanced chip manufacturing.
⚠️ Disclaimer: Not Financial Advice
This analysis is for educational and informational purposes only. It is NOT a recommendation to buy or sell any security.
Conduct your own research (DYOR) before making any investment decisions.
You are solely responsible for your own trades and investments.
Past performance is never indicative of future results.
Trading involves significant risk of loss and is not suitable for all investors.
#TradingView #AMAT #Long #Semiconductors #SemiconductorEquipment #AI #CHIPSAct #Technology #PositionTrade
AMAT - Bullish building blocks applied!=======
Volume
=======
-Stable
==========
Price Action
==========
- downtrend line of one year is broken in Jun 2025
- supported at $150 region for and rebounded at trendline
- Change of trend observed
=========
Oscillators
=========
- Ichimoku, price above cloud, kumo turns green, base + conv + lagging shows sign of piercing clouds
- MACD up
- DMI turning bullish
- StochRSI, bullish crossover + entered band
=========
Conclusion
=========
- short to long term swing, price may reverse at current level, to enter spot or wait for pullback.

AMAT watching $154-158: Double Golden zone should be VERY STRONGAMAT earnings report was heavily sold.
Now approaching a Double Golden zone.
$154.74-158.62 should be strong support.

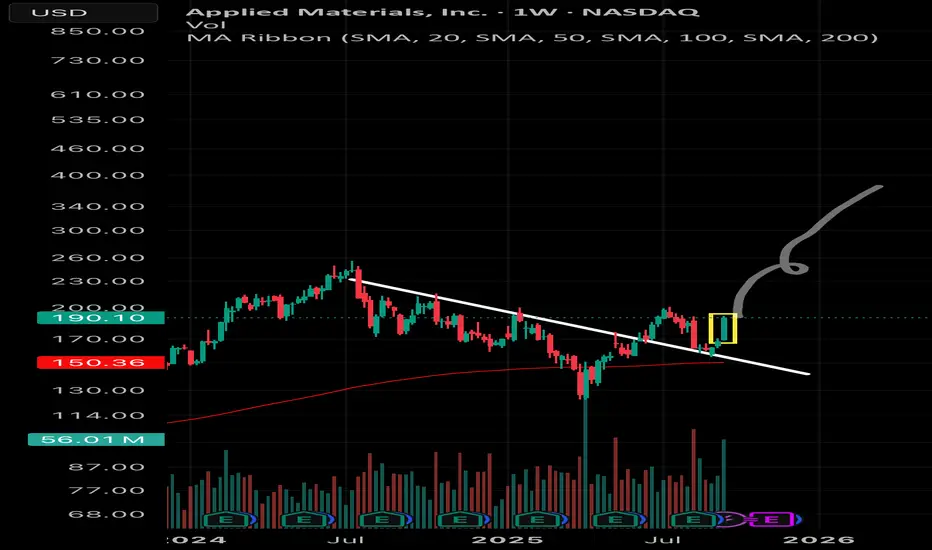
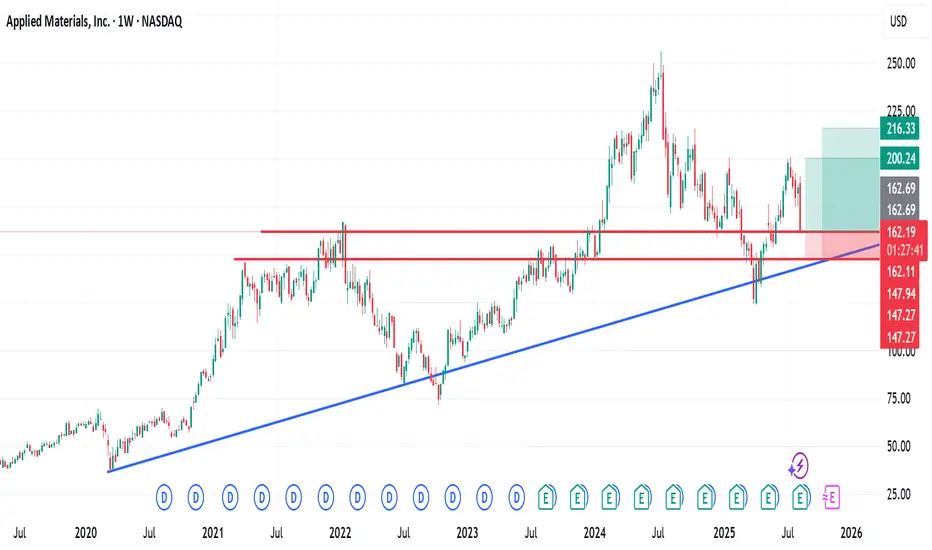
AMAT-Bullish weekly closedLovely weekly candle closed bouncing off the consolation support trend line.
Praying that we continue the bullish momentum going forward 🙏🙏🙏
AMAT - gap fill to $188.23AMAT - Stock moving higher post earnings pull down filling the gap to the upside. Calls above $180 looking good for a move towards $188.23 gap fill area. Stock seeing decent buys coming in here. If breaks $190 we can see $200 and higher.

AMAT are we about to make reversal?AMAT , Weekly candle, Seemingly closed foolishly around The support of accumulation trendline drawn as yellow line.
Just above the 200 weekly EMA
It seems like my prayer might be playing out
Let’s see how how it goes from now
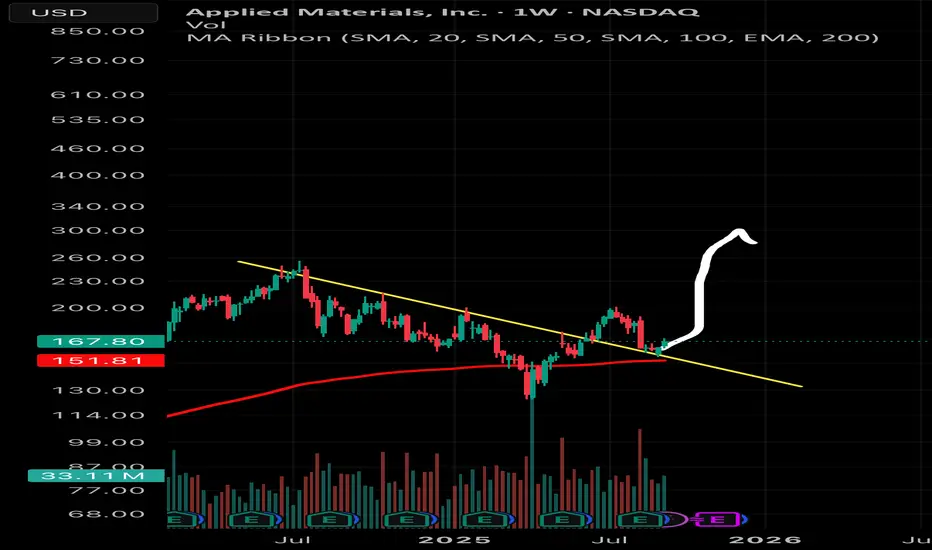
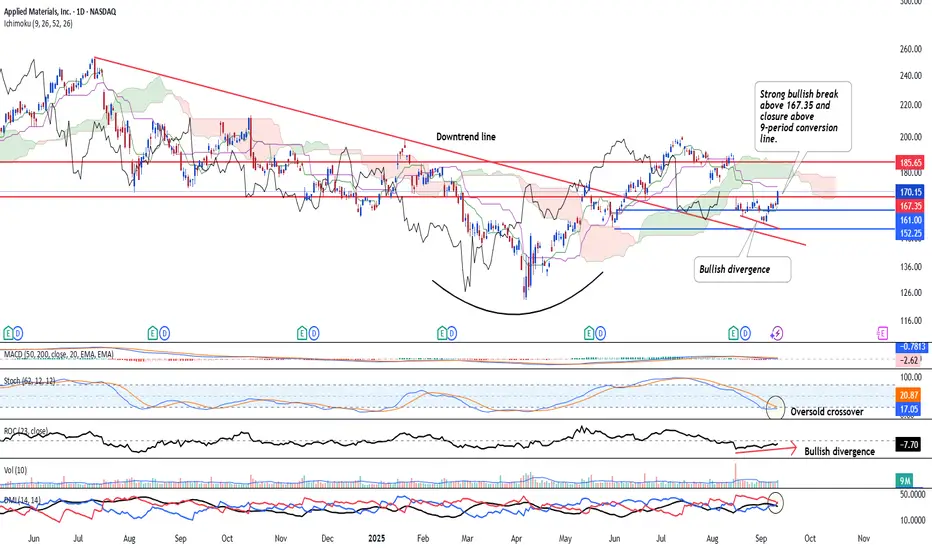
AMAT - Looking to rebound higherNASDAQ:AMAT is looking to rebound and confirm the reversal after strong bullish bar was seen breaking above the resistance of 167. Also, the stock has also broken above the downtrend line. Furthermore, the stock has also formed a v-shaped bottom. Momentum indicators shows bullish divergence and oversold crossover. TArget in near-term at 185 and 204 for the long-term.
Applied Materials ($AMAT) experienced a sharp decline Applied Materials ( NASDAQ:AMAT ) experienced a sharp decline of over 13% in the past 24 hours following an otherwise strong quarterly report.
The market reaction was driven by a weaker-than-expected forecast, which triggered heightened selling pressure and contributed to a significant decline this week.
From a technical standpoint, the $160 level is acting as a critical psychological and structural support zone, aligning with the 50% Fibonacci retracement level.
While there remains potential for further downside, I have initiated a buy position. Should the price continue to decline, I plan to add to my holdings using a Dollar-Cost Averaging (DCA) strategy.
As always, trade with caution.
I welcome your thoughts in the comments — and don’t forget to like and share for more market insights.
Trading AMAT to $165Applied Materials has been playing the earnings beat game fine for the past two quarters, but the forecast for Q4 is a full stop on optimism. The demand slump in China and export license chaos has them guiding way below expectations. Pretty sure investors didn’t appreciate the plot twist—stock fell between 11% to 14% depending on the source.

$AMAT...Chips are not finishedWhen the tariffs scares are over This stock will start to soar.
1) Inverse Head & Shoulders
2) Gap fill to 186.00
3) Just posted great earning and remain cautious during tariff talks and guidance dropped
keeping a close eye on this. When other chip stocks start to rise this will follow suit. I'd like to see it build support around this yellow block area.