Opening (IRA): ETHA November 21st 29 Covered Call... for a 27.31 debit.
Comments: Building a position, laddering out at intervals over time, assuming I can get in at strikes better than what I currently have on. Selling the -75 delta call against shares to emulate the delta metrics of a 25 delta short put, but with the built-in defense of the short call.
Metrics:
Buying Power Effect/Break Even: 27.31/share
Max Profit: 1.69 ($169)
ROC at Max: 6.19%
Will generally start to look to take profit at 50% of max, but have recently just been letting these run nearly to expiry ... .
ETHA trade ideas

Opening (IRA): ETHA November 21st 25 Monied Covered Call... for a 23.60 debit.
Comments: Adding to my position at strikes/break evens better than what I currently have on (October 17th 30 Covered Calls; November 21st 29 Covered Calls). Selling the -75 delta call against shares to emulate the delta metrics of a 25 delta short put, but with the built-in defense of the short call and to take advantage of higher IV on the call side.
Metrics:
Buying Power Effect/Break Even: 23.60/share
Max Profit: 1.40 ($140)
ROC at Max: 5.93%

Opening (IRA): ETHA October 17th 30 Monied Covered Calls... for a 28.82 debit.
Comments: Starter position. Selling the -75 delta call against shares to emulate the delta metrics of a 25 delta short put, but with the built-in defense of the short call.
Metrics:
Buying Power Effect/Break Even: 28.82/share
Max Profit: 1.18
ROC at Max: 4.09%
Will look to add at intervals, assuming I can get in at strikes/break evens better than what I currently have on.

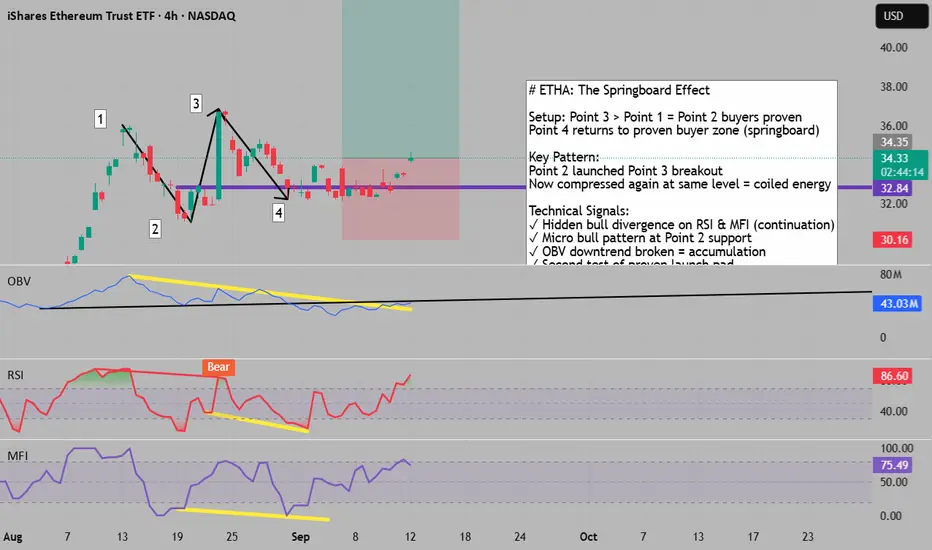
The Springboard Effect: ETHA's Coiled Energy Release# The Springboard Effect: ETHA's Coiled Energy Release
## Buyer Dominance Established (Points 1→3)
The market structure tells a compelling story: Point 3 created a higher high , decisively surpassing Point 1 sellers. This achievement transforms Point 2 into proven buyer territory - the origin point that launched Point 3's breakout. When price returns to this zone, we can expect these proven buyers to defend their stronghold.
Point 4 marks that critical return - sellers have brought price back to where buyers previously launched their assault. This sets up what I call the "Springboard Effect."
## The Springboard Mechanics
Think of Point 2 as a compressed spring. The first compression (Points 1→2) stored energy. The release (Points 2→3) proved the spring's power. Now at Point 4, we're seeing the second compression of the same spring.
What makes this powerful:
• Buyers already proved they can launch from this level
• The zone has been tested and validated
• Each test that holds adds more coiled energy
## Hidden Bullish Divergence - The Continuation Signal
• RSI: Hidden bullish divergence
• MFI: Hidden bullish divergence
Hidden bullish divergence at proven support is one of the most reliable continuation patterns. Unlike regular divergence that signals reversal, hidden divergence suggests the trend is merely pausing before continuing higher.
## The Micro Pattern Confirmation
At Point 2 support, we're seeing a micro bull pattern - a small-scale bullish formation right at the critical level. This isn't just support holding; it's buyers actively stepping in with conviction.
Micro patterns at macro levels often trigger larger moves as they:
• Confirm buyer presence
• Provide early entry signals
• Show immediate rejection of lower prices
## OBV Breakout - The Volume Story
The OBV downtrend line has been broken , revealing a crucial shift in volume dynamics. While price pulled back to Point 2, volume structure turned bullish - suggesting accumulation during the decline. This divergence between price action and volume flow often precedes explosive moves.
## The Confluence Stack
**Bullish Factors Aligning:**
• Structure: Higher high established, returning to proven support
• Divergence: Hidden bullish on both oscillators
• Pattern: Micro bull formation at macro support
• Volume: OBV breakout showing accumulation
• Psychology: Buyers defending their breakout origin
## Risk Management Protocol
Entry: Current levels (34.35) with micro pattern confirmation
Stop Loss: 30.16 (12.20% risk) - Below Point 2 support
Target: 39.36 minimum (Chaos Theory level) - aiming for 1:5 R:R
Risk/Reward Analysis:
• Risk: 4.19 points (12.20%)
• Minimum Target: 5.01 points (14.58%) = 1.2:1
• For 1:5 R:R: Need 20.95 points up = 55.30 target
Position Advantages:
• Proven support providing clear risk definition
• Multiple confirmations reducing false signal risk
• Trend continuation setup (lower risk than reversal)
• Chaos Theory indicator suggests 39.36 as mathematical target
## The Narrative Arc
ETHA's journey from Points 1→4 shows classic accumulation and markup phases:
1. Accumulation: Points 1-2 (buyers building positions)
2. Markup: Points 2-3 (breakout proves buyer strength)
3. Re-accumulation: Points 3-4 (pullback to reload)
4. Next Markup: Potential launch from Point 4
This is textbook Wyckoff theory in action - a pullback to the "creek" before the next surge.
---
Key Insight: When price returns to a level that previously launched a breakout, with hidden divergence confirming trend continuation and volume structure turning bullish, you're witnessing a high-probability springboard setup. The coiled energy from multiple successful defenses often leads to explosive moves higher.
Ethereum Rally (?) : Strong Infusion with Volume RequiredEthereum can make a very strong rally of at least 35-40 percent.
And so the same goes for the Ishares Ethereum Trust ETF. (ETHA ETF)
But it needs to break the pennant.
And we need to observe strong volume.
Also, if we stay above the 50 and 200 period moving averages while this is happening, good things can happen.
Still, I am neutral until we break the pennant.

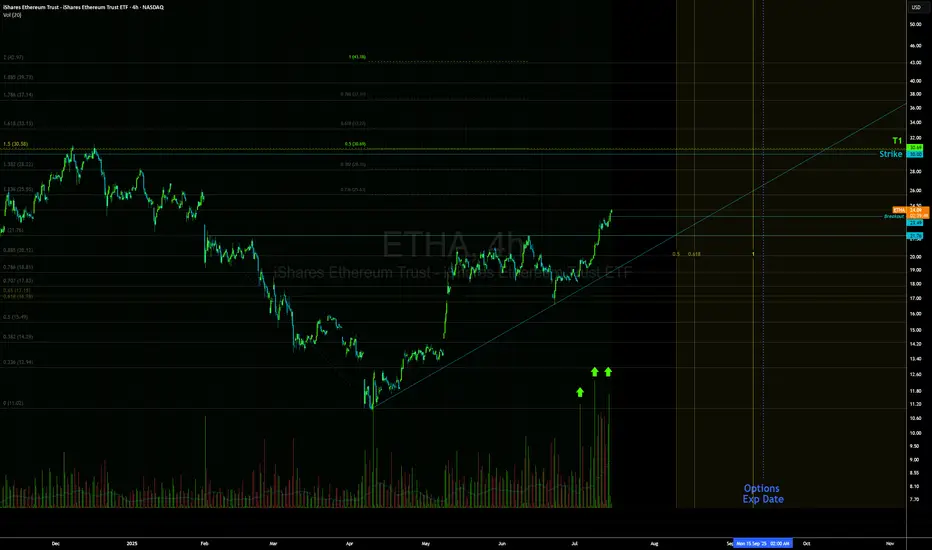
ETHA LongBreakout of inverse H&S, BTC massive breakout and following through.
Looks like we can see $30 +, Buying time on these contracts. Volume looks amazing.

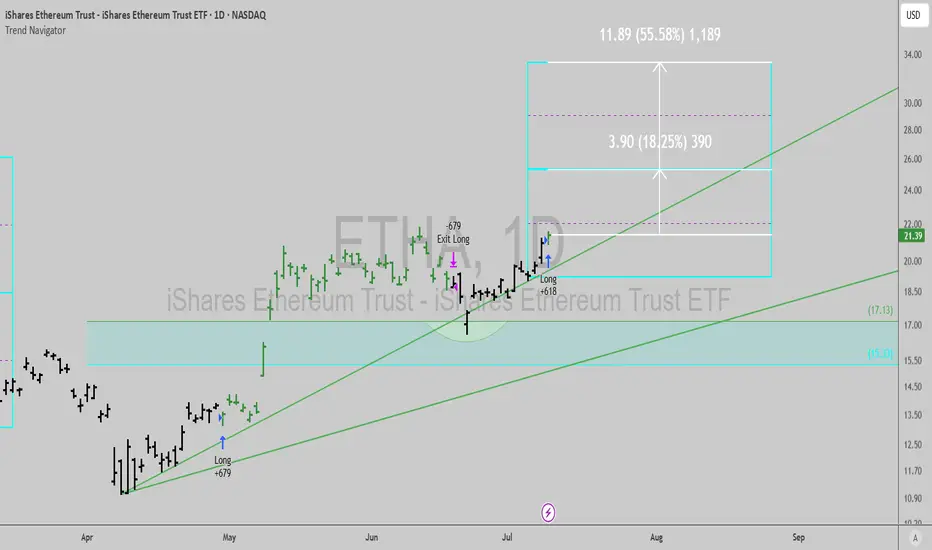
$ETHA: ETH ETF about to explode higher...For now, ETF buyers are down since inception, but that is about to change.
The Trend Navigator algo is flashing a buy signal today, as weekly flashes a Time@Mode signal.
(obligatory to mention that the Trend Navigator algo is up 30% ish in this chart in the same period)
A lot of people are either sidelined or looking to exit the market right as it's about to trend up steadily for months it seems. Don't be like them and hodl.
Best of luck!
Cheers,
Ivan Labrie.
Ethereum $ETHA ETF Daily Chart Fibonacci SupportEthereum NASDAQ:ETHA ETF Daily Chart Fibonacci Support
🚨 **Ethereum CRYPTOCAP:ETH ETF Daily Chart Update** 🚨
📊 **Fibonacci Support at 0.786 Holding Strong!**
Ethereum’s ETF chart is showing resilience at the **0.786 Fib retracement level**, a key support zone. If this level holds, we could see a bullish reversal soon! 📈🔥
🔹 **Key Levels to Watch:**
✅ 0.786 Fib Support: Strong bounce potential
🚀 Possible breakout targets: Next resistance levels ahead
⚠️ Breakdown? Keep an eye on volume & market sentiment
Are you bullish or bearish on CRYPTOCAP:ETH ? Drop your thoughts below! 👇📢
#Ethereum #ETHETF #CryptoTrading #Fibonacci #CryptoAnalysis

ETHA | Ethereum RoadmapWhat is the Blue Box?
The Blue Box represents a carefully identified price range where ETHA's price is likely to exhibit significant reactions. These reactions could result in reversals, consolidations, or breakout opportunities. This zone is identified using technical analysis tools such as historical support/resistance levels, Fibonacci retracements, and institutional trading patterns.
Why Focus on the Blue Box?
High Probability Zone: The Blue Box often represents a confluence of factors, making it a high-probability area for price action to react.
Key Decision Area: Traders and institutions typically place orders near these zones, leading to volatility and actionable setups.
ETF-Specific Behavior: As ETHA is tied to Ethereum's performance, its reaction within these zones often correlates with broader market sentiment for Ethereum.
Defining the Blue Box for ETHA
Price Context:
Identify recent swing highs and lows on the ETHA chart.
Use these levels to anchor a Fibonacci retracement, focusing on 0.618–0.786 or 0.5–0.618 zones.
Volume Clusters:
Check for volume spikes or gaps in the volume profile that align with the box's range.
Market Dynamics:
Consider news or macroeconomic factors affecting Ethereum or ETF flows, as these can amplify reactions in the Blue Box.
I keep my charts clean and simple because I believe clarity leads to better decisions.
My approach is built on years of experience and a solid track record. I don’t claim to know it all, but I’m confident in my ability to spot high-probability setups.
My Previous Analysis
🐶 DOGEUSDT.P: Next Move
🎨 RENDERUSDT.P: Opportunity of the Month
💎 ETHUSDT.P: Where to Retrace
🟢 BNBUSDT.P: Potential Surge
📊 BTC Dominance: Reaction Zone
🌊 WAVESUSDT.P: Demand Zone Potential
🟣 UNIUSDT.P: Long-Term Trade
🔵 XRPUSDT.P: Entry Zones
🔗 LINKUSDT.P: Follow The River
📈 BTCUSDT.P: Two Key Demand Zones
🟩 POLUSDT: Bullish Momentum
🌟 PENDLEUSDT: Where Opportunity Meets Precision
🔥 BTCUSDT.P: Liquidation of Highly Leveraged Longs
🌊 SOLUSDT.P: SOL's Dip - Your Opportunity
🐸 1000PEPEUSDT.P: Prime Bounce Zone Unlocked
🚀 ETHUSDT.P: Set to Explode - Don't Miss This Game Changer
🤖 IQUSDT: Smart Plan
⚡️ PONDUSDT: A Trade Not Taken Is Better Than a Losing One
💼 STMXUSDT: 2 Buying Areas

BlackRock's Ethereum ETF crosses $1B AUMBlackRock's Ethereum ETF has passed SEED_TVCODER77_ETHBTCDATA:1B in AUM.
Meanwhile, Grayscale's ETHE seems to have stabilized.
After months of sustained outflows (led by Grayscale), will ETH momentum finally emerge?

Ethereum ETF Launch Causing Temporary Crypto Dump!Last week was the official launch of the long anticipated Ethereum spot ETF. Sadly, the markets dumped right after trading went life.
We have seen the exact same thing happen earlier this year with the BTC spot ETF launch, where the ETF lost over 26% of its value in the first 7 trading days. The Ethereum ETF is currently trading at -12% after 7 trading days.
Historically, great crypto news has ALWAYS caused some kind of dump. See the analysis below for reference:
Although we're going down, I think it's a merely temporary dump. Like mentioned in my most recent BTC analysis, I think that the green area on the chart is the perfect area to start buying in again in the hopes of a turnaround in the ETF's trading direction.
Share your thoughts on whether this analysis makes sense or not. Happy to hear what you think!
