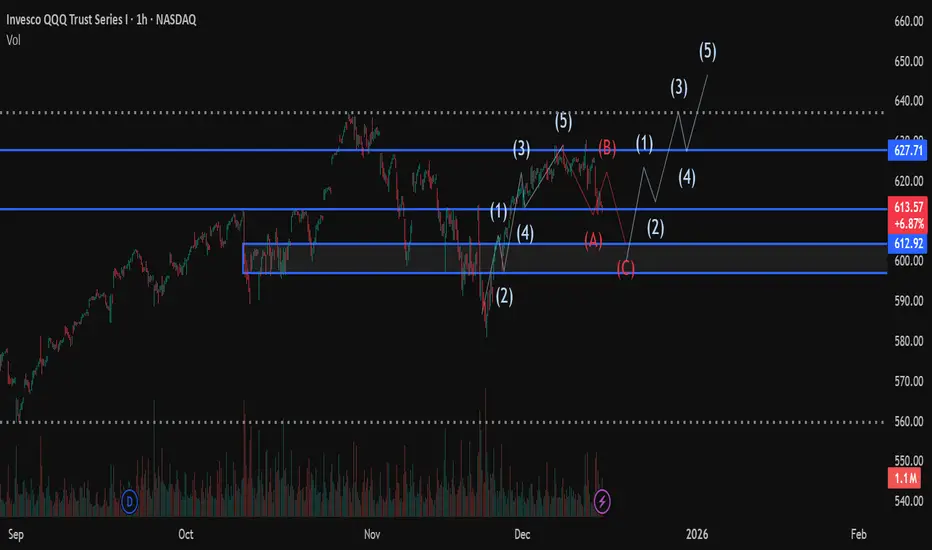
Santa Rally / V-Shaped Recovery WatchNASDAQ:QQQ continues to respect the 50 & 100 DMA, just like every selloff since July. Momentum indicators are exiting oversold territory, suggesting a familiar upside rotation.
AMEX:SPY confirms.
AMEX:IWM remains structurally bullish on the monthly (cup & handle).
CRYPTOCAP:BTC shows class
Key stats
About Invesco QQQ Trust Series I
Home page
Inception date
Mar 10, 1999
Structure
Unit Investment Trust
Replication method
Physical
Dividend treatment
Distributes
Distribution tax treatment
Qualified dividends
Income tax type
Capital Gains
Max ST capital gains rate
39.60%
Max LT capital gains rate
20.00%
Primary advisor
Invesco Capital Management LLC
Distributor
Invesco Distributors, Inc.
Identifiers
3
ISINUS46090E1038
QQQ is one of the most established and actively traded ETFs in the world, albeit one of the most unusual. The product is one of a few ETFs structured as a unit investment trust. Per the rules of its index, the fund only invests in nonfinancial stocks listed on NASDAQ, and effectively ignores other sectors too, causing it to skew massively away from a broad-based large-cap portfolio. QQQ has huge tech exposure, but it is not a 'tech fund' in the pure sense either. The fund's arcane weighting rules further distance it from anything close to plain vanilla large-cap or pure-play tech coverage. The ETF is much more concentrated in its top holdings and is more volatile than our vanilla large-cap benchmark. Still, the fund has huge name recognition for the underlying index, the NASDAQ-100. In all, QQQ delivers a quirky but wildly popular mash-up of tech, growth, and large-cap exposure. The fund and index are rebalanced quarterly and reconstituted annually.
Related funds
Classification
What's in the fund
Exposure type
Electronic Technology
Technology Services
Stock breakdown by region
Top 10 holdings

Market SignalMarket Signal is an algorithm that evaluates statistical trends in price action of QQQ and its holdings to determine whether QQQ is currently in an uptrend (📈) or downtrend (📉)
Every day after market close, our Market Signal algorithm returns a numerical market sentiment value, ranging from -9 (mos

An Urgent Warning to ALL Traders & InvestorsWhat in the world just happened to the market today? NASDAQ:QQQ AMEX:SPY AMEX:IWM
That’s exactly what we’re breaking down—calmly, logically, and from an investor’s perspective.
In this video, I walk through the major indexes ( NASDAQ:QQQ , AMEX:SPY , and AMEX:IWM ) across multiple timefra

MASSIVE RALLY OR MASSIVE CRASH...In this video we will talk about if the markets are in store for a MASSIVE RALLY OR MASSIVE CRASH...
NASDAQ:QQQ AMEX:SPY AMEX:IWM

QQQ Market Open PlaybookThe dominant structure from October-November is still up, but momentum has clearly rolled
Price is now below the anchored VWAP from the November high & hovering just above the VWAP from the November low
This is no longer trend-following territory
It’s range/distribution behavior unless reclaime


QQQ Trading Opportunity! SELL!
My dear followers,
This is my opinion on the QQQ next move:
The asset is approaching an important pivot point 617.26
Bias - Bearish
Safe Stop Loss - 620.93
Technical Indicators: Supper Trend generates a clear short signal while Pivot Point HL is currently determining the overall Bearish tre

WEEKLY QQQ (NQ-US100-USTECH) Outlook - Prediction (14 DEC)WEEKLY QQQ (NQ-US100-USTECH) Outlook - Prediction (14 DEC)
📊 Market Sentiment
Market sentiment has turned slightly bullish again following the FED’s rate cut decision. We saw the market react quickly after Powell’s speech. QE has restarted, and the FED stated it will buy $40 billion of Treasury

QQQ Two optionsThey're currently retesting this move to the high but its already been tested, could hold this second time around after the regain. If it fails expect new lows sub 588
TrenVantage LITE plotting trends

See all ideas
Displays a symbol's price movements over previous years to identify recurring trends.
Frequently Asked Questions
An exchange-traded fund (ETF) is a collection of assets (stocks, bonds, commodities, etc.) that track an underlying index and can be bought on an exchange like individual stocks.
QQQ assets under management is 402.46 B USD. AUM is an important metric as it reflects the fund's size and can serve as a gauge of how successful the fund is in attracting investors, which, in its turn, can influence decision-making.
Since ETFs work like an individual stock, they can be bought and sold on exchanges (e.g. NASDAQ, NYSE, EURONEXT). As it happens with stocks, you need to select a brokerage to access trading. Explore our list of available brokers to find the one to help execute your strategies. Don't forget to do your research before getting to trading. Explore ETFs metrics in our ETF screener to find a reliable opportunity.
QQQ invests in stocks. See more details in our Analysis section.
QQQ expense ratio is 0.20%. It's an important metric for helping traders understand the fund's operating costs relative to assets and how expensive it would be to hold the fund.
No, QQQ isn't leveraged, meaning it doesn't use borrowings or financial derivatives to magnify the performance of the underlying assets or index it follows.
Yes, QQQ pays dividends to its holders with the dividend yield of 0.46%.
QQQ shares are issued by Invesco Ltd.
QQQ follows the NASDAQ 100 Index. ETFs usually track some benchmark seeking to replicate its performance and guide asset selection and objectives.
The fund started trading on Mar 10, 1999.
The fund's management style is passive, meaning it's aiming to replicate the performance of the underlying index by holding assets in the same proportions as the index. The goal is to match the index's returns.