SIL trade ideas

Silver Miner's ETF SIL Show Powerful Upside BreakoutThe Silver Miner's ETF SIL has shown a powerful upside breakout this summer,
and the upside potential is just now being recognized.
This comes after a major accumulation of "supply"
in late 2018,by Big Money Commercials.
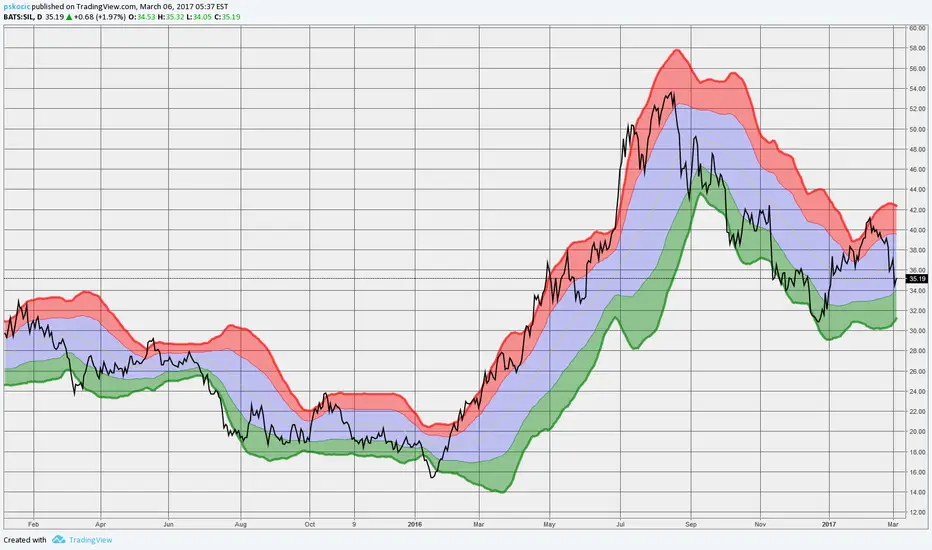
Daily Line Break Chart shown here,
shows a compelling bullish breakout,of a rounded bottom formation.
Note the successive "green bar" upside breakout pattern on the chart this summer.
If it feels like you may have missed this initial powerful burst to the upside in SIL,
this summer and you feel like you were caught sleeping at the wheel if you missed this
just try to be diligent and patient.
But do get in.
Accumulate with limit buys, below the market.
Chart Interpretation:
Upside Target for SIL could be to at least 44.00
SIL Last 28.70
THE_UNWIND
7/24/19
NEW YORK


Silver Miners Setting up for Big Bullish MoveMarkets are correlated. US equities have been staving off another major decline for the last few months, and conversely, precious metals--although impacted by a rising dollar--remain long-term bullish. We can see a nice wedge-type formation here of bullish implications. It's full target is about 40% above current prices, but then full targets are not necessarily reached. Strategy is to go long on break of trend line...this will likely take a while to play out given the chart shown is weekly.

Wyckoff accumulation on $SILThe capitulation volume (noted with arrows) got absorbed with very little price decline and the market moved strongly moved higher the following weeks. Very likely this is the start of new trend - caught early. Regardless, It is certainly an amazing RR trade, cut if a weekly candle closes below 29. Safer to wait for trend confirmation but will dramatically change risk/reward.


$SIL 36.53, looks like double bottom to me, stop 34Silver Miner ETF, 36.53, looks like double bottom to me, stop if trend changed


Changiny my view of the precious metals miners. With what looks like a reversal in the US dollar yesterday I am reevaluating my view of the miners.In both the GDX and the SIL there has been a .62 correction and the shorter term down trend lines have been broken.
There has also been a "measured move" down indicated by the down arrows. Although we have a negative reversal in the RSI, the RSI has jumped up and held in the >50 range where it often stays during advances.
These observations lead me to think the correction is most likely over with more up move to come as the dollar falls.


