SNAP: Snap back to reality, whoop there goes gravityThe stock has been performing terribly since the Earnings Report of october last year as investors pulled out. It got too extended to the down side and bounced back to touch the 50 SMA and i believe this is a good entry (40.00) for a short down to 32.11 (20%) with a large stop of 48.00 (-20%)
Trade ideas

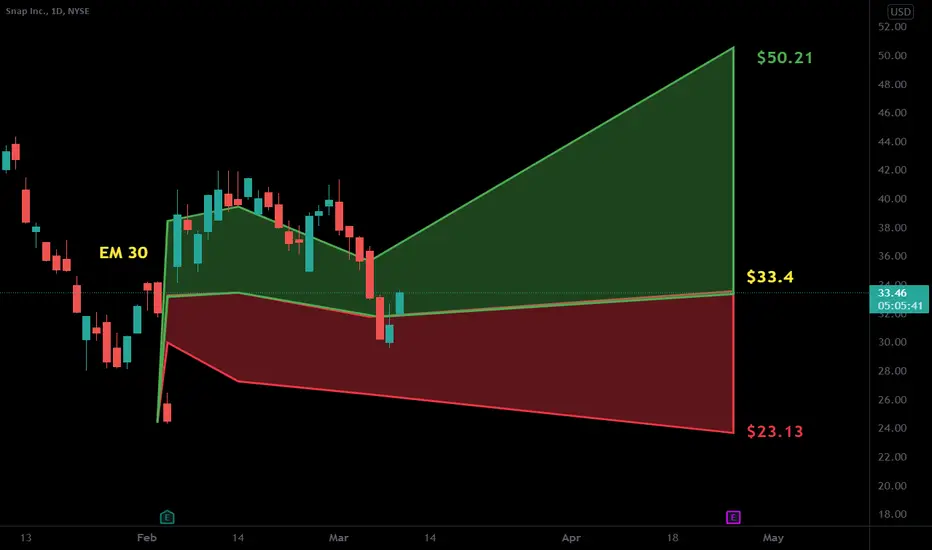
SNAPAbove the yellow line, the targets are above in the chart below it. The target is below, and the most important thing is not to break the area below by closing a day candle

SNAP is the NEW FBas consumers reject FB from around the world, this leaves SNAP to pick up the pieces. SNAP is growing earnings double digits and is accepted by a younger audience whereas FB is left for by moms and pops...Brands are moving away from FB and looking at alternatives like TikTok and FB.
SNAP has huge growth potential, it has yet to crack Asia and entire Europe...

SNAP LONGSnapchat going long because of:
- Snap is almost oversold on hour, 4 hour, and day time frame.
- Snapchat outstanding Earnings and Revenue the 3rd of February 2022.
-This started an upward trend that was quickly stopped by the 50 MA around the 16th of February.
-Even after this rejection supertrend still showing bullish trend (only with heiken ashi candles) . I'm predicting it will test the 50 MA again and maybe break
it by the end of next week.
- Bought an option contract for a call option that expired March 18th. (DO NOT COPY IM A BEGINNER)
I'm a noob so give me criticism.
My first post :)
NYSE:SNAP

SNAP: Going to $13 Snapchat looks like it will be in a corrective phase for the next year. It may be worth a swing trade at $20, where the longterm support trend line lies, but longterm it should test the $13 range which coincides with an open gap and the .786 retracement of this larger degree 3rd wave.

$SNAP with a Bullish outlook following its earnings #Stocks The PEAD projected a Bullish outlook for $SNAP after a Positive Under reaction following its earnings release placing the stock in drift A with an expected accuracy of 100%.
$SNAP GAP FILL INCOMING EASY SHORT!-Waiting for a pull back to around 34.93 levels
-if there is no pull back and we head straight down to the gap I will use the set up to my advantage and scalp on the way down
-Looking to go for 1-2 weeks out maybe more for options
$SNAP - Gap Down Slam DunkSnapchat has probably peaked in terms of its popularity.
Yes- a lot of us use the app. Including myself. But what do they really do that is hard to replicate?
All of that aside, technical analysis says this stock is overpriced.
Bearish double top. Massive gap down below that has already broken. I originally meant to share this last week.
It has also lost both major moving averages at 100 and 200 day MA's. This should be a fun short to play right now.
I have been in this play and expect it to move to around $27 or lower.

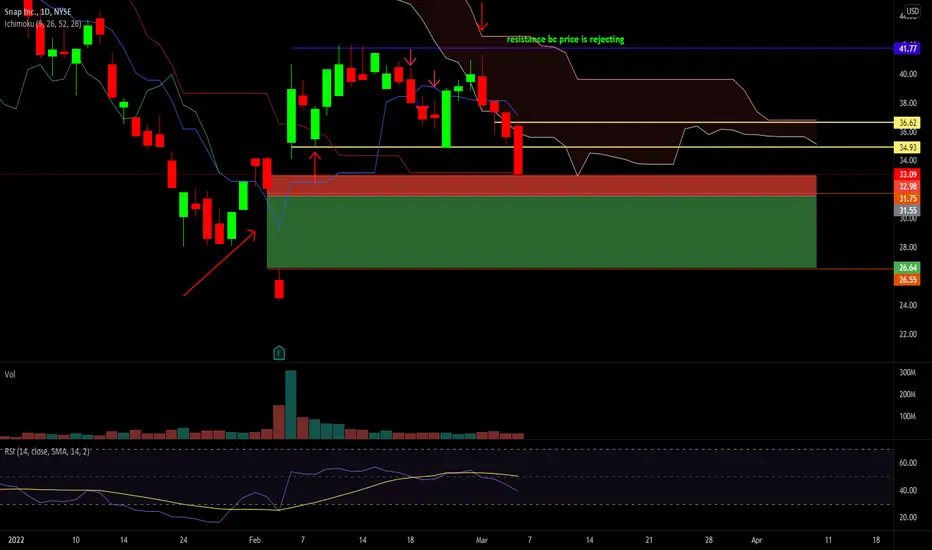
SNAP Range - Is Upside Still Possible?SNAP bounced from support @ $35.15. Price is attempting to break above the 20 MA (30 min. timeframe), as well as the descending channel, before it can target the upper range again @ $41. If the bottom support of this range ($35) doesn't hold, there is a pretty large gap to be filled down to $26.

Strong signal to buy on SNAP STOCK !Hello everyone, according to my chart analysis of SNAPCHAT stock, I recommended to keep in portfolio, because SNAPCHAT stock is showing a strong buy signal this coming weeks.

SNAP SWING TRADEBeautiful inverse head and shoulders pattern on ticker symbol SNAP. Possible 50% gainer here. Not investment advice.

Snap Decending ResistanceBuying puts here, Stop loss if the stock touches $43.00. Take profit between $28.00-$29.00
Thank you

Is Snap Overbought?Snap had a sharp rally on February 4 after quarterly results beat estimates. But now its longer-term downtrend may be reasserting itself.
The first pattern on today’s chart is the stochastic oscillator. It’s swinging back to the downside after jumping into overbought territory.
Next, price tested but was unable to break above the 50-day simple moving average (SMA). That suggests the downtrend remains in effect.
Third, notice how the recent high occurred slightly above $40, near the mid-December low. It’s also close to the high-volume breakout area in October 2020. Has this price zone become resistance?
Finally, the macro backdrop may be challenging for SNAP given the weakness in growth stocks and the broader communications sector.
TradeStation is a pioneer in the trading industry, providing access to stocks, options, futures and cryptocurrencies. See our Overview for more.
Important Information
TradingView is not affiliated with TradeStation Securities Inc. or its affiliates. TradeStation Securities, Inc., TradeStation Crypto, Inc., and TradeStation Technologies, Inc. are each wholly owned subsidiaries of TradeStation Group, Inc., all operating, and providing products and services, under the TradeStation brand and trademark. When applying for, or purchasing, accounts, subscriptions, products and services, it is important that you know which company you will be dealing with. Please click here for further important information explaining what this means.
This content is for informational and educational purposes only. This is not a recommendation regarding any investment or investment strategy. Any opinions expressed herein are those of the author and do not represent the views or opinions of TradeStation or any of its affiliates.
Investing involves risks. Past performance, whether actual or indicated by historical tests of strategies, is no guarantee of future performance or success. There is a possibility that you may sustain a loss equal to or greater than your entire investment regardless of which asset class you trade (equities, options, futures, or digital assets); therefore, you should not invest or risk money that you cannot afford to lose. Before trading any asset class, first read the relevant risk disclosure statements on the Important Documents page, found here: www.tradestation.com .

SNAP With the current market conditions being weak, lets play that strength; which at the moment might be this bearish momentum.. $36.30’s breaking can lead to a bigger short to test previous longs at the $35 range, if the intentions succeed and they are shaken out, this can only head lower possibly sub $33.

$SNAP EASY SHORT FINALLY BROKE!-We finally broke 38.94
-bit of resistance building up but we finally have a clear bounce off resistance
-looking for potential weeklies down to 34.39

Bearish short term setupSNAP failed to break the .5 fib retracement and the upper level of the descending channel. The boost from earnings weren't enough to get it done so I suspect SNAP will fall back down to the lower level of the channel or maybe even break it to fill to open gap. The inflation/Russia conflicts should also be a greater force pulling the general market down. I'll look to add a short position on Tuesday.
This is not financial advice.

Snap's futureSnap performs quite well, despite the broad market weakness.
I am seeing a huge opportunity here, but first, we might tank a bit more.
Even to the P Pivot (36,03), and that will be a good entry point.
If it gets below that, the picture will turn bearish.
Support: 36,03
Resistance: 44,11


$SNAP Key levels, Analysis & TargetsSNAP Key levels, Analysis & Targets
Time frame D1 Bullish Divergences in MACD Indicator

SNAP 30minSNAP seeing a inverse head and shoulders looking to break to the upside once we break the neckline in the 30min timeframe.

SNAP GAP FILL SHORT -SNAP doing it's own thing up here after a massive earnings run up
- Looking to hold puts through the week most likely
-looking to scalp the way down
Snap Chat Falks!!Hello There, wasssaaap every bosy??
no need to explain,, my chart is just straight forward. Snap revenues are growing ya'll :)
let's just pray Tiktok go to garbage
good luck..

Been here many times beforeOh Snap, anything if not predictable.
Done this song and dance before with SNAP, especially around earnings time.
Can you see it?
If not, check out the hourly chart and it will become clear.
If we can manage to open around 39$, we will likely retest the 40s zone. From there is where I will likely enter short.
There is the possibility it could retest 44 (I wouldn't hold my breath and I wouldn't bet money on it), but its unlikely.
If it manages to break 42.13 then we can anticipate a retest of 44, but again, its not looking promising.
Best of luck tomorrow everyone!
