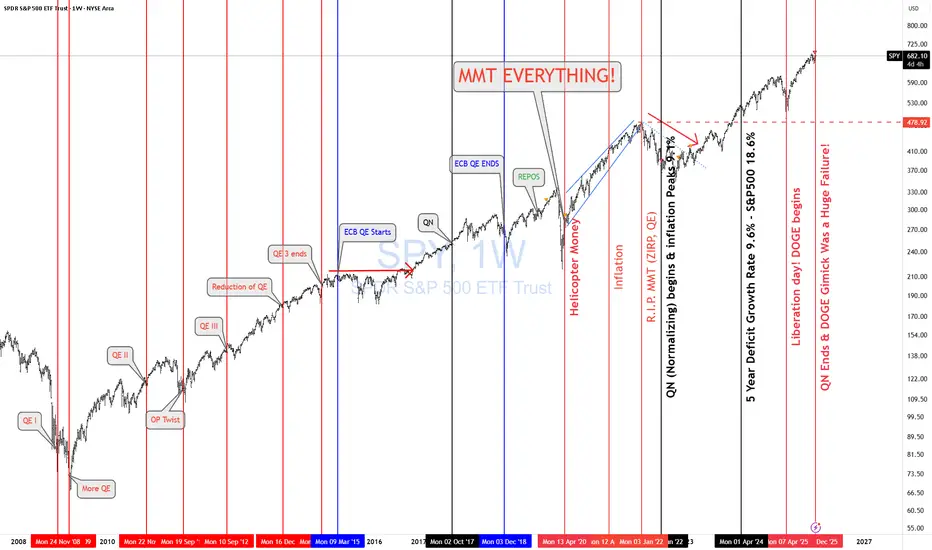
SPY WEEKLY LIVE 26 NOV 2025This is Spy weekly where I have clearly discussed why not to long here. Best is not to trade if you are not sure otherwise chances are you might get stuck at the top.
NOTE:STAY AWAY FROM GOING LONGS
Key stats
About SPDR S&P 500 ETF Trust
Home page
Inception date
Jan 22, 1993
Structure
Unit Investment Trust
Replication method
Physical
Dividend treatment
Distributes
Distribution tax treatment
Qualified dividends
Income tax type
Capital Gains
Max ST capital gains rate
39.60%
Max LT capital gains rate
20.00%
Primary advisor
SSgA Funds Management, Inc.
Distributor
ALPS Distributors, Inc.
ISIN
US78462F1030
SPY Fund Summary
The investment seeks to provide investment results that, before expenses, generally correspond to the price and yield performance of the S&P 500 Index. The Trust seeks to achieve its investment objective by holding a portfolio of the common stocks that are included in the Index), with the weight of each stock in the Portfolio substantially corresponding to the weight of such stock in the Index.
The investment seeks to provide investment results that, before expenses, generally correspond to the price and yield performance of the S&P 500 Index. The Trust seeks to achieve its investment objective by holding a portfolio of the common stocks that are included in the Index), with the weight of each stock in the Portfolio substantially corresponding to the weight of such stock in the Index.
Related funds
Classification
What's in the fund
Exposure type
Electronic Technology
Technology Services
Finance
Stock breakdown by region
Top 10 holdings

SPY & Macro HistoricalToday FED ended QN (Quantitative Normalizing NOT "T" = tightening. 1st, you normalize, then you tighten. Right??)
The Fed is continuing to let mortgage-backed securities roll off its balance sheet, while the U.S. Treasury increases T-bill issuance (cash-like instruments). That combination means mor
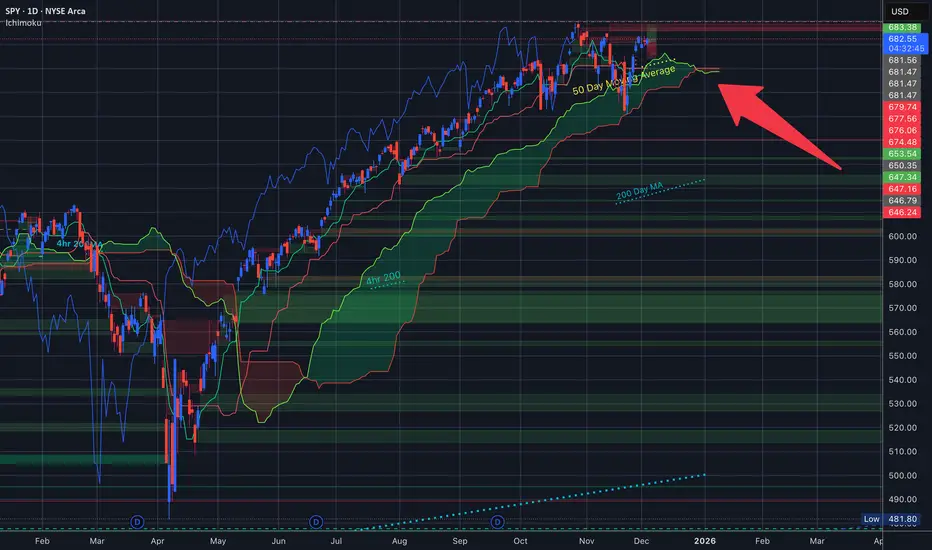
$SPY $SPX Red Ichimoku Cloud extension. This is your warning. I am not your financial advisor but this is definitely a warning signal in the charts. Top is in.
ABC easy as 123if the analysis is correct a C wave down into the middle of December and possibly longer has started this evening. I'm wrong if they get to the 18daily ma and start rallying from there. All the patterns look like AB and C coming - SPY IWM, AAPL, KRE VIX etc. Gold continues to rally but is close to i

If it's a C wave.....I go through what should happen next if it's a C wave down on SPY. The move should be relentless with very little bouncing, especially after the open. If they get aboe Friday's high the idea is invalid. Gold could be a B wave finishing, but I wouldn't recommend trading it. BTC probably continues to

15M/30M Possible Wyckoff Distribution on $SPYFor tomorrow for me it's pretty simple, looking at the 15M and 30M charts.
Break above $685 with some force and I re-analyze what I thought was a Wyckoff Distro on the 15M/30M charts.
Chop between $683 & $685, then look for a break below $685 and it aligns with Phase C > Phase D LPSY.
Not financi

SPY ~685.90 to 686.80I am relatively new to trading, so please let me know if anything is incorrect. Here is my analysis of a potential long position in SPY.
Spy is currently in an uptrend. The price closed above a high-volume node in the larger, zoomed-out perspective. The candle did close red, and on the hourly chart

Stock Market Forecast | BTC TSLA NVDA AAPL AMZN META MSFTStock Market Forecast | CRYPTOCAP:BTC SP:SPX NASDAQ:NDX NASDAQ:QQQ
Mag 7 | TSLA NVDA AAPL AMZN META MSFT GOOGL

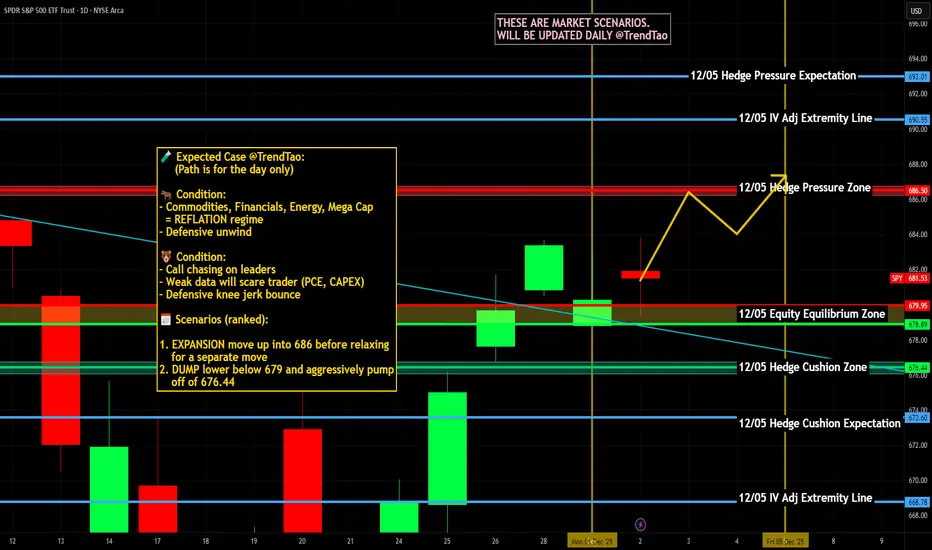
$SPY & $SPX Scenarios — Wednesday, Dec 3, 2025 🔮 AMEX:SPY & SP:SPX Scenarios — Wednesday, Dec 3, 2025 🔮
🌍 Market-Moving Headlines
💼 Labor + services-heavy morning: ADP, import prices, services PMIs, and ISM all land before 10 AM — a full macro pulse on jobs, inflation pressure, and service-sector strength.
🧾 Shutdown-delayed September rep
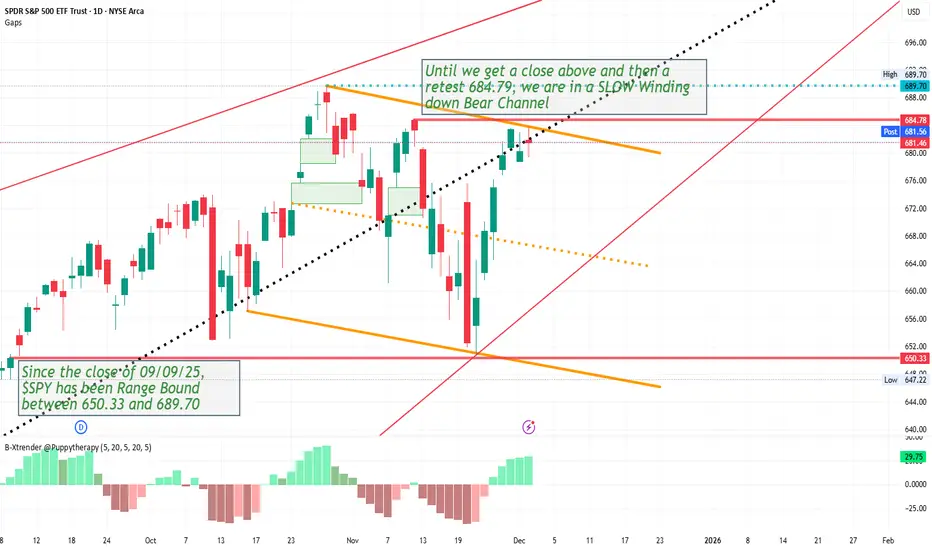
$SPY has been Range Bound going on 3 months... Teeter Tottering!This is what I'm seeing when looking at the Daily Chart of AMEX:SPY
I'll leave it up to the experts and professionals regarding price predictions... I just like to follow the price action. As you can see, since 9/9 AMEX:SPY has been stuck teeter tottering between the close of 9/9 and the ATH of
See all ideas
Displays a symbol's price movements over previous years to identify recurring trends.
Frequently Asked Questions
An exchange-traded fund (ETF) is a collection of assets (stocks, bonds, commodities, etc.) that track an underlying index and can be bought on an exchange like individual stocks.
SPY assets under management is 701.54 B USD. AUM is an important metric as it reflects the fund's size and can serve as a gauge of how successful the fund is in attracting investors, which, in its turn, can influence decision-making.
Since ETFs work like an individual stock, they can be bought and sold on exchanges (e.g. NASDAQ, NYSE, EURONEXT). As it happens with stocks, you need to select a brokerage to access trading. Explore our list of available brokers to find the one to help execute your strategies. Don't forget to do your research before getting to trading. Explore ETFs metrics in our ETF screener to find a reliable opportunity.
SPY invests in stocks. See more details in our Analysis section.
SPY expense ratio is 0.09%. It's an important metric for helping traders understand the fund's operating costs relative to assets and how expensive it would be to hold the fund.
No, SPY isn't leveraged, meaning it doesn't use borrowings or financial derivatives to magnify the performance of the underlying assets or index it follows.
Yes, SPY pays dividends to its holders with the dividend yield of 1.06%.
SPY shares are issued by State Street Corp.
SPY follows the S&P 500. ETFs usually track some benchmark seeking to replicate its performance and guide asset selection and objectives.
The fund started trading on Jan 22, 1993.
The fund's management style is passive, meaning it's aiming to replicate the performance of the underlying index by holding assets in the same proportions as the index. The goal is to match the index's returns.