Most hated V-recovery deja vuDoes anyone else see this? It's been 5 years since the most hated v-recovery of 2020. Will the 2025 most hated v-recovery play out the same?
Trade ideas

Market preview November 5thI still think the market will drop to 6700 or below before a more significant bounce. I'm wrong if it gets over yesterday's high. BTC also in a channel and I think it will breakdown. Gold is in balance and a test of the low may trigger a short covering rally. Oil, nothing new, same consolidation.

$SPY $SPX Scenarios — Wednesday, Nov 5, 2025🔮 AMEX:SPY SP:SPX Scenarios — Wednesday, Nov 5, 2025 🔮
🌍 Market-Moving Headlines
🚩 First clean data of the week: After delays in earlier reports, Wednesday brings ADP Employment and ISM Services — the first confirmed macro prints to gauge real economic momentum.
📉 Labor tone check: ADP’s private payroll growth of 22,000 vs -32,000 prior suggests continued softness but potential stabilization ahead of Friday’s NFP.
💼 Services resilience: ISM Services expected to tick up slightly to 50.5, hovering near the expansion line — a critical signal for Q4 GDP trajectory.
💬 Market tone: With shutdown-delayed data still missing, traders focus on rate-cut odds, yields, and Treasury auctions for directional cues.
📊 Key Data and Events (ET)
⏰ 8:15 AM — ADP Employment (Oct) | +22,000 vs -32,000 prior 🚩
⏰ 9:45 AM — S&P Final U.S. Services PMI (Oct) | 55.2
⏰ 10:00 AM — ISM Services (Oct) | 50.5 expected, 50.0 prior 🚩
⚠️ Note:
Unlike earlier-week reports, all of Wednesday’s data are confirmed to release on schedule — making this the first meaningful macro catalyst since the FOMC. Expect intraday volatility around 8:15 AM (ADP) and 10:00 AM (ISM).
⚠️ Disclaimer: Educational and informational only — not financial advice.
📌 #trading #stockmarket #SPY #SPX #ADP #ISM #PMI #yields #Fed #inflation #bonds #economy #macro

SPY DEMAND LEVEL BELOW|LONG|
✅SPY tapped into the demand level and printed bullish reaction wicks, signaling a short-term rebound toward 678$. Liquidity above minor highs could be targeted. Time Frame 2H.
LONG🚀
✅Like and subscribe to never miss a new idea!✅

Update on the markets November 4thSPX rallied in the morning but was rejected at the trendline I was following. Vix now over it's 18ma. My feeling is this will continue to drop with some small bounces here and there. If it gets over 6820 I'm incorrect.

Only one sector keeps the S&P 500 alive.Since 2019, Technology (XLK) has surged +199.7%, almost doubling the S&P 500’s +101.8%.
The remaining 10 sectors have lagged behind, creating one of the largest performance gaps in S&P history.
The equal-weighted index (RSP) tells the truth behind the headline numbers:
up only +57.5% vs +101.8% for the cap-weighted SPY —
a −44 pp underperformance that exposes just how concentrated this market really is.
Some sectors have barely moved or even declined:
🏠 Real Estate (XLRE) −2.5%
🧺 Consumer Staples (XLP) +17%
⚡ Utilities (XLU) +26%
💭 Reflection:
This isn’t a broad bull market — it’s a tech-driven rally.
When leadership narrows this much, strength becomes fragility. The S&P 500 looks healthy on the surface, but its heartbeat comes from a single sector.

Sell signal on the SPXWe hav brokend support overnight. Any bounce should be sold into unless there's another bear trap in the making. Vix above it's 18ma. Gold bear flag broken. Oil still holding above it's 18ma. BTC probably will test 100k but not much support until 97k

$JNK signalling headwind for the equity market AMEX:SPY AMEX:JNK : There is a renewed bearish divergence between AMEX:JNK (high yield bonds ETF) and AMEX:SPY , as . Throughout recent sessions, the relative performance of AMEX:JNK vs AMEX:SPY has dropped sharply. This resembles the situation that began in early October when AMEX:JNK weakness preceded a pullback in $SPY.
Key Technical Insights
The current gap between AMEX:JNK and AMEX:SPY repeats the bearish divergence seen weeks ago, which ultimately led to a short-lived correction in equities.
Historical observation: When the high-yield market, as represented by AMEX:JNK , weakens ahead of stocks, it often signals increased risk aversion and signals downside risk in the equity market. ( AMEX:JNK is a leading indicator)
If this relative weakness in JNK persists, it again warns that AMEX:SPY may be vulnerable to a pullback, following the pattern established earlier this fall.
In summary, the renewed divergence between AMEX:JNK and AMEX:SPY is a bearish signal for equities, highlighting building risk in the credit market.

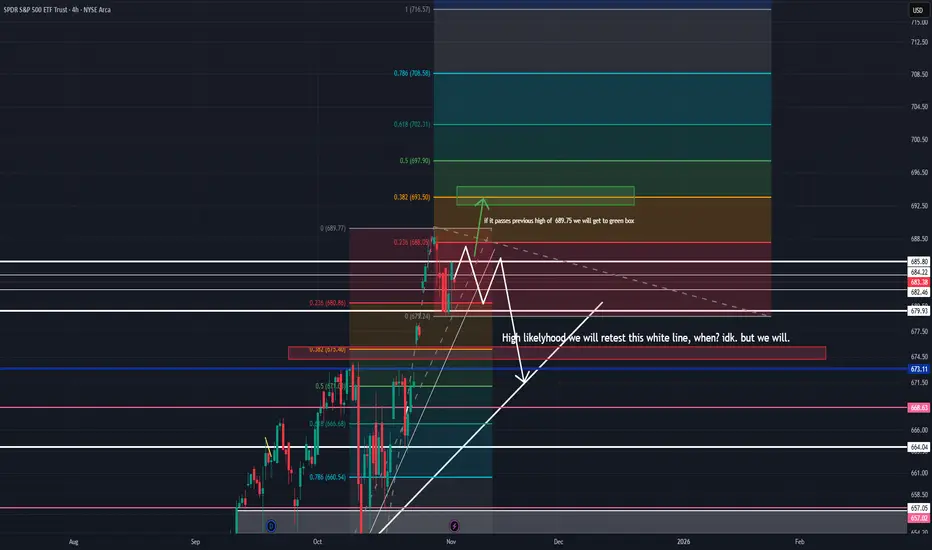
bearish vibeslooking at AMEX:SPY we have some key levels I want to see broken. 689.77 for more upside to golden fib level of 693.50 and possibly higher eventually. rsi is showing small bearishness that could easily be shaken off. there is a large trendline on the 4 hour I have strong conviction that we will touch again, when? idk- but we will touch it again.This chart excites me as a bear. I would love to see a strong push up, making the downside to that white line even stronger. profit boxes are marked conservatively as I am a scalp trader mostly and will be looking for break outs and reversals as well as momentum plays mostly on the 4h 15m and 1m. Gaps excite me as a bear, these ghostly floating october candles will come back to haunt us before the ghost of chrismas pasts come back to visit (it will likely gap and retest in november). I would think sooner than later we test that white like and likely jump up off of it on the first test then possibly flush below it. Fundementals and news play into this as well. The news might be the catalyst to allow volume and momentum to flush or propel us upward more.
Remember the market is not "rational" we play in probabilities, patterns, discretion, behavior, politics, and within the space of predictive sentiment.
I'm also watching macro sentiment by looking at CBOE:VIXY and COMEX:GC1! even looking at $NASDAQ:TLT. These can help predict SPY & QQQ sentiment.
Watch for earnings and possible gov't shutdown news that might shift price. Any emotional tilt can send price into dramatic (and often temporary) moves. looking at the ADX Dmi +,- there is a due break out coming soon. All points are converging in to the center - aka its getting a little too quiet. I expect a good move sometime this week before we come into 11/10.
SPY to 730 by January: The Great Eruption of 2025You ever look at a chart and feel like it’s whispering to you? Not in a calm, analytical, “buy-low-sell-high” way — no, I mean a chart that’s practically begging to burst through resistance like a teenager discovering caffeine and leverage at the same time. That’s exactly what SPY looks like right now: a coiled spring, a powder keg, a loaded slingshot — pick your metaphor, because they all end the same way — up, violently, and unapologetically.
Our God and Savior big daddy Trump has been rumored to be calling this one the “Chart of Destiny”, but some have affectionately dubbed it “The Rocket of Shame.” It starts innocent enough — a few bumps, a little consolidation — and then suddenly, the price action starts tightening, curling up like it’s holding something in. The candles get smaller, volume gets quieter, and then BOOM — that blue line eruption that could make a nun blush. SPY shoots its shot straight toward 730, leaving bears questioning every decision they’ve ever made.
Now, let’s talk fundamentals (because if we don’t, people might think this post isn’t serious). Inflation? “Contained.” Rates? Probably high enough to choke a small economy, but who cares when liquidity finds its way back into tech like it’s spring break in Miami. Earnings? Corporate America is back on its gym grind, trimming fat, buying back shares, and flexing margins like it’s about to post a thirst trap on Bloomberg.
Technicals? Oh, baby. You’ve got a bull flag within a bull flag, nested like Russian dolls of degeneracy. Every EMA is curling upward like a smirk on Jerome Powell’s face when the market refuses to die. RSI? Not overbought — motivated. Volume profile? Looks like a staircase to Valhalla. And that dashed trendline? That’s not resistance. That’s foreplay.
We’re sitting around 681 right now, and people are calling it “toppy.” Cute. That’s like calling a SpaceX launch “just a campfire.” Look closer: higher lows, breakout pressure, and enough built-up energy to launch this ETF into orbit. The move to 730 isn’t just possible — it’s inevitable. Think of it like a market-sized sneeze: you can feel it building, you can’t stop it, and when it happens, it’s going to be loud, messy, and probably land on someone’s short position.
Now I know what you’re thinking: “But Mike, what if it doesn’t happen?” Well, in that case, we’ll just say it’s consolidating before the “real” move. That’s the beauty of modern analysis — as long as you sound confident and draw enough lines, you’re never wrong, just early. Besides, the market isn’t about being right — it’s about being early enough to brag on X (formerly Twitter) and delete the post if it goes the other way.
But mark my words — by the time the calendar flips to January, SPY’s gonna be making the kind of move that turns skeptics into believers, traders into prophets, and bears into memes. You’ll see it climbing past 700, teasing 710, winking at 720, and when it finally breaches 730, we’ll all pretend we saw it coming. Because deep down, looking at this chart — you did see it coming.
So grab your popcorn, set your alerts, and maybe light a candle for the shorts. The setup is too clean, the energy too thick, and the chart… well, let’s just say it’s giving “pent-up potential.” If this thing rips, it won’t be a rally — it’ll be a spectacle.
SPY to 730 by January. Not financial advice — just a man reading the most seductive chart in the market and hearing it whisper, “higher Daddy, higher."
Don't let your bear friends get to far away though, when this baby takes off you'll want to be close enough to hear them crying "spit on it papaw! it hurts!"

SPY at a Critical Inflection — (Nov. 3-7)SPY at a Critical Inflection — Liquidity Games This Week (Nov. 3–7) ⚠️📈
Weekly Structure (Macro Bias)
Market Structure:
SPY has been grinding at the upper boundary of its rising macro channel, continuing a long series of BOS pushes. The most recent CHoCH was instantly reclaimed — that’s a bullish tell and suggests smart money defended aggressively. We’re now sitting right under fresh liquidity resting above last week’s highs.
Liquidity:
Current price action shows clean liquidity grabs above prior pivot highs, followed by stabilization instead of sharp rejection. That’s constructive — but we’re reaching a zone where profit-taking historically appears.
Trend Direction:
Still bullish on the weekly. Higher highs and higher lows are intact, but we’re extended into premium.
Weekly Supply & Demand:
* Demand: 613 → 600 (macro buy zone if we get any corrective rotation)
* Deeper Demand: 535 (big institutional buy pocket)
* Supply: 682–690 channel ceiling; don’t underestimate this
Smart money tends to rebalance right here before extending.
Indicators:
* 9EMA > 21EMA with a widening slope — momentum intact
* MACD histogram still building positive bars; momentum hasn’t rolled
* Stoch RSI elevated, but SPY can ride overbought for weeks
Volume expansion on up candles suggests real positioning, not just passive drift.
Daily Structure (Swing Bias)
Market Structure:
The daily trendline from late summer continues to be respected. We got a push into 685, then a controlled pullback. As long as price respects the diagonal support, momentum stays bullish.
Key Daily Levels to Watch:
* Support: 671.50 → 668.50
* Resistance: 685 → 689
* Breakout Trigger: 690+ (potential extension squeeze)
A clean daily close above 685 flips the door open for a measured move higher.
Order Blocks & Liquidity:
There’s a clean bullish OB around 667–672. If price rotates into this zone and rejects hard, that’s your high-prob entry.
Above 685, stops cluster — good fuel for a pop.
Indicators:
* EMAs trending up and separating
* MACD curling positive again; momentum rebuilding
* Stoch RSI cycling from a near-top, but not diverging yet
Momentum is cooling, not reversing.
15-Minute Structure (Intraday Rotation)
Market Structure:
Intraday, SPY is surfing inside a descending micro-channel. We printed a BOS early, followed by a cleanup CHoCH that suggests accumulation at 679–680. Small liquidity grabs are forming under price.
This is the kind of structure that breaks upward if futures align.
Intraday Liquidity Zones:
* Above: 684–686 (magnet if shorts get squeezed)
* Below: 679 (trap zone)
* Deeper: 676 (big footprint buying interest)
Indicators (M15):
* MACD flattening — momentum pause
* Stoch RSI reset and curl up — room for upside rotation
Don’t be surprised by a morning liquidity sweep followed by continuation.
1-Hour GEX Map (Options Positioning & Dealer Flows)
This is where things get interesting.
Positive Gamma Walls (resistance):
* 685
* 690
Dealers hedge short-term options demand by capping volatility. That explains the sideways grind.
Put Support:
* 678
* 675
If price breaks 678 with force — volatility instantly expands. Dealers will hedge by shorting futures.
Max Pain Behavior:
Gamma supports chop with mild upward bias. Don’t expect clean trends unless we break outside this GEX bracket.
Sentiment:
Puts still hold 62% — traders are hedged. That often creates upside drift as protection decays.
Trade Scenarios
✅ Bullish Scenario
Condition: Reclaim and hold above 683.50
Entry: Break and retest of 685
Targets: 689 → 692
Stop: 681.25
Invalidation: Full body close below 679
Notes: If futures are green, upside squeezes happen fast.
⚠️ Bearish Scenario (Counter-Trend)
Condition: Fail and reject 685 with a strong red impulse
Entry: Breakdown of 679
Targets: 676 → 672
Stop: 682
Invalidation: 683 reclaim
If SPY gives us a morning sweep + reclaim, shorts get trapped.
What to Watch This Week
* Liquidity hunts above 685 are likely
* Bears only gain momentum below 679
* Keep an eye on NQ — SPY is following tech rotation
If we hold 680–681 during the first hour, the setup favors upward continuation.
Closing Outlook
SPY is in a premium zone of its macro channel, and this is where markets loves to play games with psychology. Until sellers take initiative, momentum favors continuation with shallow dips.
My eyes are on:
* Reaction to 685
* Dealer hedging pressure shifting
* Early week liquidity sweep under 679
A clean reclaim after a trap is your squeeze ignition.
Disclaimer
This analysis is for educational purposes only and not financial advice. Always trade with risk discipline.
$SPY $SPX Scenarios — Tuesday, Nov 4, 2025🔮 AMEX:SPY SP:SPX Scenarios — Tuesday, Nov 4, 2025 🔮
🌍 Market-Moving Headlines
🚩 Jobs data on deck: Tuesday’s focus is on labor demand — the JOLTS report remains a key barometer for wage pressure, though it may not print due to the shutdown.
⚠️ Data blackout continues: The Trade Balance and Factory Orders are both delayed government releases, keeping markets dependent on Fed tone and price action.
💬 Fed-speak pre-jobs: Vice Chair Bowman’s early-morning remarks will frame policy bias ahead of ADP and Friday’s NFP.
💻 Volatility compression: With few confirmed reports, traders watch AMEX:SPY ’s range behavior and TVC:VIX positioning before the labor-data surge mid-week.
📊 Key Data and Events (ET)
⏰ 6:35 AM — Michelle Bowman (Fed Vice Chair) speech
⏰ ⚠️ 8:30 AM — U.S. Trade Deficit (Sept) — may not print
⏰ ⚠️ 10:00 AM — Factory Orders (Sept) — may not print
⏰ ⚠️ 10:00 AM — Job Openings (JOLTS, Sept) — may not print
⚠️ Note:
All three macro reports are subject to delay under the continuing government shutdown. Expect headline-driven trading and low data-volume volatility until Wednesday’s ADP and ISM Services releases.
⚠️ Disclaimer: Educational and informational only — not financial advice.
📌 #trading #stockmarket #SPY #SPX #Fed #Bowman #JOLTS #TradeBalance #FactoryOrders #bonds #yields #economy #shutdown #macro

All good things come to an endIt is inevitable that we will have a 5 year retest, that time frame is nothing. Everyone saying we will never go back to covid levels. Their about to eat thru everyones longs.
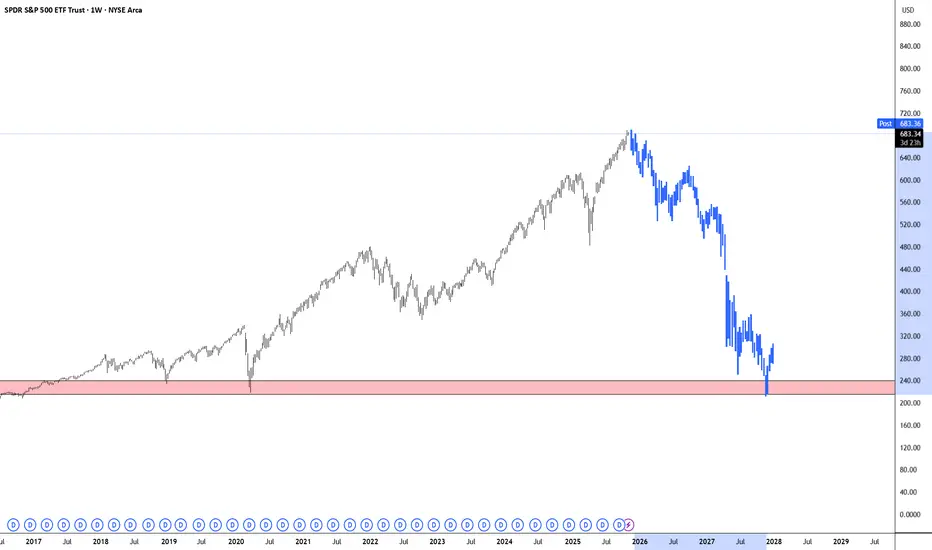
My work and projection take notice The chart posted is something I post as I feel major events or turns .I have Not needed to alt this chart since we have evolved in the pattern As you notice the next projection in the 6900 ;s zone notice the BB band s . and be ready !

SPY it's time to come down to 666Its time for SPY to go down.All I see is around 666 area if it doesnot bounce from there then big turbulance is on the way.

Possible bear trap herecaution is needed here. If they rally, expect 6900 to be revisited before a bigger fall.

First Monday of NovemeberSPX still in a consolidation but can hit 6900 today on a bounce. taking out Friday' lows would be bearish. Usoil still holding above it's 18ma, needs to get above 63 for a significant move up to start. BTC still battling with 110k, but looking weaker. Gold still in a bear flag formation.

November 3 - November 7The market has been showing no signs of slowing down as of late. Every dip is being aggressively bought and fear hedging of SPX puts and Gold is appearing to be providing more liquidity to keep prices moving higher. I posted this in Minds earlier and will add because it sums up my assessment of where the market is currently at and it’s potential achilles’ heel.
“The US will continue to have one of the most stable market environments compared to the rest of the world, making it a safe place to store capital. While the trade deficit gives the US some leverage over China when it comes to trade, the fact that China is the #3 foreign holder of US debt gives them the “trump card” in the trade war.
Rate cuts will continue to be stimulative and help keep the Fed’s interest payments from getting out of control (for now) but things can quickly unravel if yields start rising to the point where it forces the Fed back into QE prematurely.
This is why Trump keeps backing down from the most extreme measures in the trade war. He knows US companies cannot withstand 100%+ tariffs and China could stop buying Treasuries and start pushing yields higher. This is why I keep an eye on TVC:MOVE when there is stock market volatility to make sure there isn’t growing institutional hedging of Treasuries.
I still need to look everything over to determine my bias for this week but with the trade war entering what I think will be a temporary phase of relief, I’m not seeing strong bearish fundamentals at this point in time.”
Here is what I’m seeing for the week ahead.
+-+-+-+-+-+-+-+-+-+-+-+-+-+-+-+-+-+-+-+-+-+-+-+-+-+-+-+-+-+-+-+-+-+-+-+-+-+-+-+-+-+-
1. Macro
The dollar TVC:DXY is reaching the top of its range and the hollow candles have been less than bullish, so I think the index may once again peak around 100 before reverting back to the average. I am keeping this in mind when comparing other assets to the dollar.
The TVC:US03MY / TVC:US10Y yield spread is once again quite wide, which was recently driven by a rise in the 10Y yield while the 3M yield mostly remained flat, as I suspected would happen in my previous post. The overall trend for both is still slanting downward, so while it’s never great to see the 10Y yield rising, the wider spread is healthier to see. On the contrary, FRED:DFII10 (inflation-indexed 10Y bond) went up on the last available date, Thursday 10/30, so it will be important to watch the Forward Inflation Gauge (bottom right) to see if the market starts to send any inflation signals.
I have updated the formula for the inflation gauge as well to broaden the scope. The new formula is
= US03MY*0.25+US10Y*0.50+US30Y*0.25-DFII10
I decided to include the TVC:US30Y bond since its yield is of the biggest concern to policymakers and weight the average to place the most significance on the 10Y yield. As the shutdown continues, the Fed will be placed in an increasingly difficult position without official data. Since PCE was not published on Friday, this is depriving us of a key piece of data that would show if the market is correct in pricing in lower inflation or if the spread between Real/Implied inflation will continue to widen. This is why yields will yields will provide important clues, especially if the shutdown starts nearing an end. If real employment and inflation data will be released soon after, will the market begin to sell bonds due to lack in confidence or continue the course?
Next on commodities, TVC:GOLD is sitting on its average level and could go either way from here. I’d expect a retracement higher but who knows. As I mentioned above, if the dollar TVC:DXY starts to revert lower, it could help Gold move back up a few points. I’m not expecting much out of Gold for at least another week. It will be interesting to see what happens with Oil and Commodities (bottom right) this week in relation to the dollar index. If for whatever reason, the dollar rallies, it could push oil and ag/metal commodities down, but the alternative may be of greater concern: if the Dollar moves lower again, commodities could surge well above the average in correlation which could be perceived as inflationary since the rise in prices (especially when it comes to copper) has more to do with US trade policy rather than pure international demand. I read earlier today in The Economist that Copper is trading at a higher spot price on the New York exchange compared to London, so to summarize, I will be watching the Macro chart very closely this week, as I think important signals are on the horizon.
2. FX
Other currency indices continuing to fall will help bolster the dollar’s relative standing, so it will be important to keep an eye on this as well as the week unfolds for clues on the Dollar, which in turn will have an effect on commodities. I have the bond yields indexed to 100 again here to show the change and as I mentioned in the introduction, the 3M chart (top) shows how investors are much calmer on the US in the short term compared to other countries. 10Y bonds rose across the board at the end of October but seem to be leveling off.
3. Risk
I don’t draw on my charts as much these days but I think there are some interesting points on this layout that I want to illustrate. First, on the corporate bond yield premium spread (high yield - investment grade) the most recent data (Thursday 10/30) shows the spread went up, which could potentially be a higher low. It will be important to watch this and, to a lesser degree, $HYG/LQD (for intraday) for signals of stress in credit markets.
Next, I still believe the $ES1!/GOLD chart shows the spread found a bottom, so even if Gold gains on ES this week, I think gold’s preference over stocks may continue to decline. Another important development last week was how AMEX:SPY broke out of the rising channel over AMEX:RSP (equal weighted ETF) and held on Friday. As you can see on the bottom chart, TVC:NDQ outperformed the other indices quite well, so I take this as a signal of extreme demand for Tech and other mega-cap stocks that are weighted the highest.
Takeaway: Keep an eye on corporate credit but unless there is a significant change, stocks look biased in favor of Tech and other mega caps.
4. Sector Bias
Tech ( AMEX:XLK ) has been moving up against SP:SPX since the end of October, so the risk appetite is continuing to grow. As I mentioned about $SPY/RSP , this supports that the highest weighted stocks will continue to outperform.
5. Futures Bias
There was some bearish intraday activity on Futures at the end of last week, especially on Friday, where Realized Volatility increased and institutions hedged by buying SPX puts ( TVC:VIX ) and VIX calls ( CBOE:VVIX ), USI:PCSPX was quote high, however there was divergence with VIX, so the weighted index so the institutional interest may have been lower than what the weighted index was indicating.
On the right side, you can see the CVD momentum was in a downtrend from Wednesday-Friday which reacted ahead of the ES price and captured a maximum 1.46% decline
Lastly, I have switched back to Renko from Line Break, as I think the ATR calculation provides better noise filtering while being more reactive to fast changes. Here you can see that the price could not reclaim weekly VWAP (dotted line) Thursday or Friday, so sellers were in control those days and dealers bought into the volatility. It also looks like the price tried to form a range and failed, causing it to slide lower. Right now it will be important to see which way the price goes. If it retraces higher, will it make a new ATH or fail to do so? That could be an important signal to gauge how much strength buyers still have.
Conclusion:
Out of all the charts, I would say that if I were to view the ES chart in isolation I would probably have a bearish bias, and beyond the chart there are developing macro signals that could provide support to the bearish fundamental case (commodity rally, rising corporate credit spreads, dealers short gamma) that will be important to watch for signs of continuation. On the flip side, if I were to view every chart excluding ES, I would say this environment could still support continued upside for the indices (ES1!/Gold spread, the weighted index outperforming unweighted, AMEX:XLK pivot, and low Treasury volatility TVC:MOVE ).
I think this juxtaposition illustrates that the market is uncertain as well. Macro indicators are at what may be an inflection point, so the fear hedging after the 10/22 to 10/30 rally is justifiable since stock market performance will likely be greatly influenced by Macro forces if anything changes. It also seems like arguments can be made that the Dollar rising or falling this week (especially if it’s quick) could have negative ripple effects in the markets this week. I believe the worst case for stocks this week would be a dollar sell off.
For these reasons, it would be reckless to be anything but Neutral here. I’d prefer to play the bull side if it seems like volatility will “unwind”, but if the market seems like it’s going to keep buying into Volatility, I will expect to see lower prices across the indices.
Regardless of what happens this week, I do think SPX hitting 7k this year is all but inevitable, so if I do take a bearish bias, it will be for the short term and will be reassessed on a daily basis. Let me know what you think and thanks for reading.

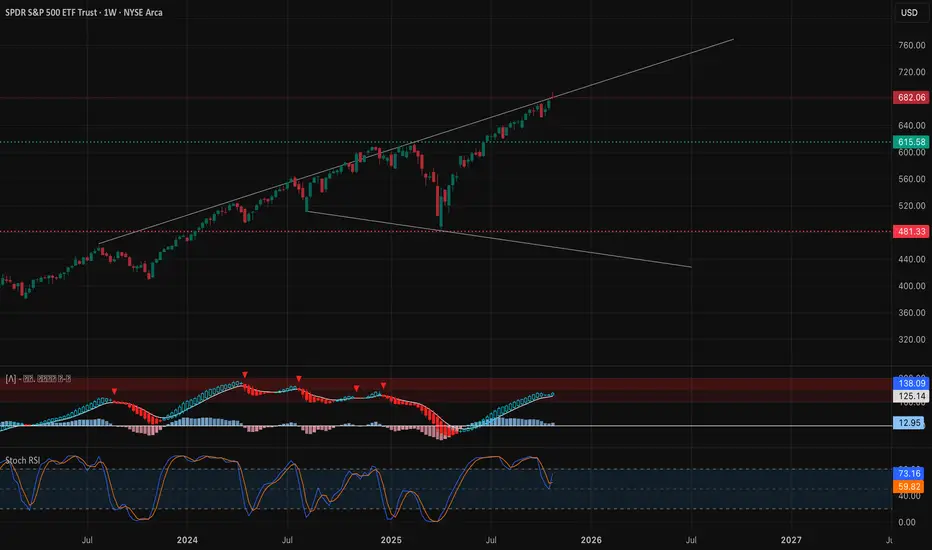
$SPY Bearish Divergence on the DailyOctober revealed a clear bearish divergence, with weak momentum hiding behind price strength. Volume remained notably low throughout the month — a classic sign of waning conviction beneath the surface.
We’re now sitting at a high-risk zone, and I’m calling the top here.
Sentiment has shifted into overconfidence, with investors seemingly ignoring the growing cracks beneath the surface. Fundamentals simply don’t support these elevated levels — and market breadth continues to deteriorate. Fewer and fewer stocks are leading this move, and that’s rarely a sign of a healthy or sustainable rally.
We’ve seen this setup before. It doesn’t end well.
Sell it all.
Also note - I am not your financial advisor. Do your own due diligence

$SPY $SPX Scenarios — Week of Nov 3 → Nov 7, 2025🔮 AMEX:SPY SP:SPX Scenarios — Week of Nov 3 → Nov 7, 2025 🔮
🌍 Market-Moving Headlines
🚩 Post-FOMC digestion: After Powell’s Oct 29 presser, traders watch whether yields and the dollar cool or extend higher.
📈 Labor-week spotlight: Friday’s Jobs Report (NFP, wages, unemployment) anchors the week — rate-path odds hinge on those prints.
💬 Fed tone in focus: Multiple governors and regional presidents hit the circuit after the FOMC — every nuance matters for December guidance.
⚠️ Shutdown watch: Several BEA and Census releases (Factory Orders, Trade Balance, GDP components) may not print on time if the government remains partially shuttered.
💻 Earnings taper off: Final big-cap names and sector leaders wrap Q3 results, shaping sentiment into mid-November.
📊 Key Data and Events (ET)
Mon Nov 3
⏰ ⚠️ 8:30 AM — Durable Goods Orders (Sept) | Ex-transportation subset — BEA report; possible delay
⏰ 10:00 AM — Factory Orders (Sept) ⚠️ possible delay
Tue Nov 4
⏰ 9:00 AM — S&P Case-Shiller Home Price Index (Aug)
⏰ 10:00 AM — Consumer Confidence (Oct) 🚩
Wed Nov 5
⏰ ⚠️ 8:30 AM — Advanced Trade Balance in Goods (Sept) | Retail and Wholesale Inventories — Census; may be delayed
⏰ 10:00 AM — Pending Home Sales (Sept)
⏰ 🚩 2:00 PM — FOMC Rate Decision
⏰ 🚩 2:30 PM — Fed Chair Powell Press Conference
Thu Nov 6
⏰ 🚩 8:30 AM — Initial Jobless Claims (Oct 25) expected on schedule
⏰ 🚩 8:30 AM — GDP (Q3, Advance) ⚠️ BEA data; delay possible
⏰ 9:55 AM — Fed Vice Chair Michelle Bowman speaks
Fri Nov 7
⏰ 🚩 8:30 AM — PCE and Core PCE (Sept) along with Personal Income, Spending, and Employment Cost Index ⚠️ BEA risk
⏰ 9:45 AM — Chicago PMI (Oct)
⏰ 12:00 PM — Cleveland Fed President Hammack and Atlanta Fed President Bostic remarks
⚠️ Note:
Shutdown risk applies to BEA and Census releases marked with ⚠️
Confirmed live data include Jobless Claims, FOMC decisions, and Fed speeches — these will drive most of the week’s price action.
Friday’s PCE print (if released) remains the key inflation gauge.
⚠️ Disclaimer: Educational and informational only — not financial advice.
📌 #trading #stockmarket #SPY #SPX #Fed #Powell #FOMC #PCE #GDP #JoblessClaims #inflation #bonds #yields #economy #macro

SPY 30 minute outlook for 3 to 7 NovemberThe most important thing first
Only trade at the map levels. For this week that list is short. 678, 682, 685, 690, and the gap zone 671 to 672. Everything else is noise until price reaches one of these spots. Your job is to listen for acceptance or rejection at the level, then act with a small number of simple rules.
Why this matters this week
The last print on Friday was near 682. Buyers defended higher lows for two weeks, yet supply still lurks above 685. This creates a tight battlefield where patience has an edge. We also walk into a week with event windows that can move liquidity at specific times. That makes a level based plan far more useful than chasing mid range impulses.
The map you can trade
Place these levels on a clean thirty minute chart. No indicators are required for the core read.
700 round number magnet. Respect the gravity if price runs
690 first upside checkpoint above the band
685 first breakout gate. Acceptance here often pulls price into 690
682 pivot around Friday close. That is the middle of the week map
678 first support inside balance
671 to 672 open gap zone from late October
665 next shelf under the gap
661 to 662 fifty day context on the daily, not a trigger but important reference
Mark a simple session based VWAP if you like, only as a way to define impulse and pullback structure. If VWAP pins near 682 during cash hours, treat that as the intraday axle.
Catalysts to respect
Write the event times directly on your chart. Private payrolls, the two ISM prints, and Treasury supply updates are the likely spark plugs. The idea is not to predict the number. The idea is to protect your risk into the time stamp and let the reaction tell you when to press or stand down. Most reactions that stick will retest a level. That is the entry you want.
Three rules for entries and exits
Keep it simple. You need only three.
Break and hold
Above 685 for fifteen minutes, buy the first pullback that holds the breakout line. Use the impulse low as your stop. First target 690. If momentum stays firm, trail under higher swing lows and let the tape pull you toward 700. If the retest under 685 appears, stand aside and wait for a clean reclaim before trying again.
Reject and rotate
If price rejects 685 early and bleeds back under 682, fade pushes back into 682 only when the tape is balanced and liquidity is thick. First target the other edge at 678. Second target is a test of the 671 to 672 gap zone. Cut the idea if a higher low forms above 682 and buyers reclaim the pivot.
Explore and revert
If 678 breaks and fails to reclaim, let price explore 671 to 672. Two ways to trade it. Either do nothing and stalk reversal structure inside the gap zone, or short failed bounces that cannot get back above 678 with a target at the top of the gap. In both cases the invalidation is a fast reclaim of 682 with improving tape.
How to size and manage
Define one Discipline unit for the week. That is your full risk per idea
Use one half unit when you trade against the outer edge of the weekly options expected move. At Monday open write the current expected move upper and lower bounds on your chart and treat them as fences for scaling
Take partials into logical magnets. Into 690 from a 685 break. Into 678 from a 682 rejection. Into 671 to 672 after a 678 failure. The objective is to convert risk into house money early, then trail with intent
What to watch intraday
A breadth or depth improvement during a 685 reclaim. That is usually the cleanest long of the day. You will see it in tape speed and order book thickness rather than in oscillators
A stall near 690 with lower highs on five minute bars. That is usually the place to stop pressing longs and to hand the rest of the work to the trail
A false break under 678 that immediately rips back through 682. That is the place to flip your bias for a rotation toward 685 again
Scenarios in plain language
Trend continuation
If buyers clear 685 and hold it on the retest, the path of least resistance is higher. Aim for a measured push into 690. If the tape is squeezing and liquidity stays supportive you can keep a runner for a look at 700. The evidence you need is simple. Higher lows on five and ten minute bars and no heavy selling into the bid.
Range rotation
If we reject 685 early, expect a ping pong week between 678 and 685 with a pivot near 682. You fade the edge only when the tape is calm. You do not fade when a data release has just hit, because the first reaction can keep running.
Pullback to value
If 678 gives way and cannot reclaim, let it go. The highest quality buy zone is down near 671 to 672 where trapped shorts may cover. The first long is often the retest that holds the top of the gap and prints a higher low on five minute bars.
Risk and discipline
Cut losers fast at the level, not in the middle of the range
Never widen stops during event minutes
Do not add size mid range. Add only at the level after confirmation
If you take three trades and all three fail to hold structure, step away for an hour. That reset often saves the day
Closing note
You do not need ten indicators and a dozen opinions this week. You need five levels, three rules, and one risk unit. Write them down. Trade only when price comes to you. Let the market do the heavy lifting.
Reminder
Education and analytics only. No advice. No guarantees. Process beats prediction.

SPY: First week of November and Seasonality!Hey everyone,
The obligatory SPY post has arrived.
In it, I talk a bit about seasonality and some outstanding high probability targets on SPY, as well as the levels for next week.
Hope you enjoy! And as always, safe trades!

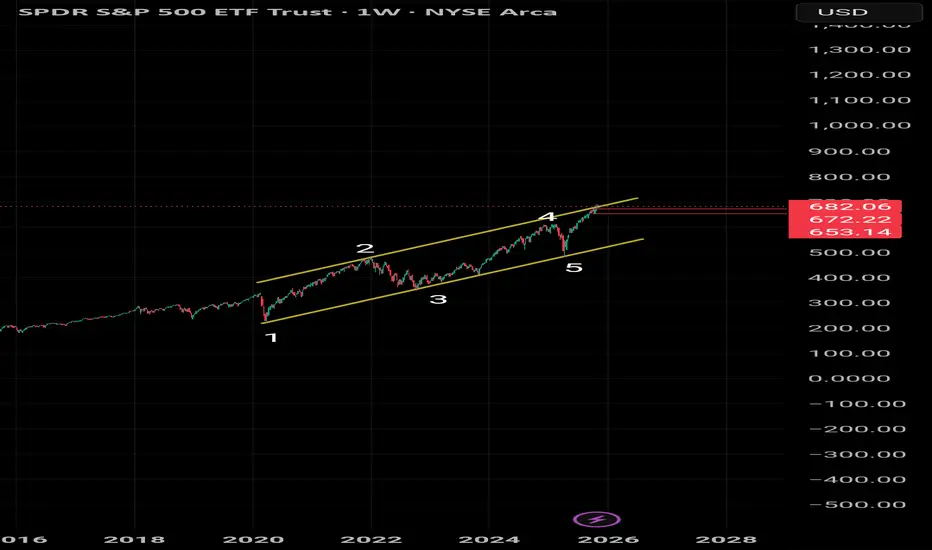
Something bad could be comingIt looks like we're completing wave 5 on the weekly chart, meaning we might get a massive correction in the next coming months.