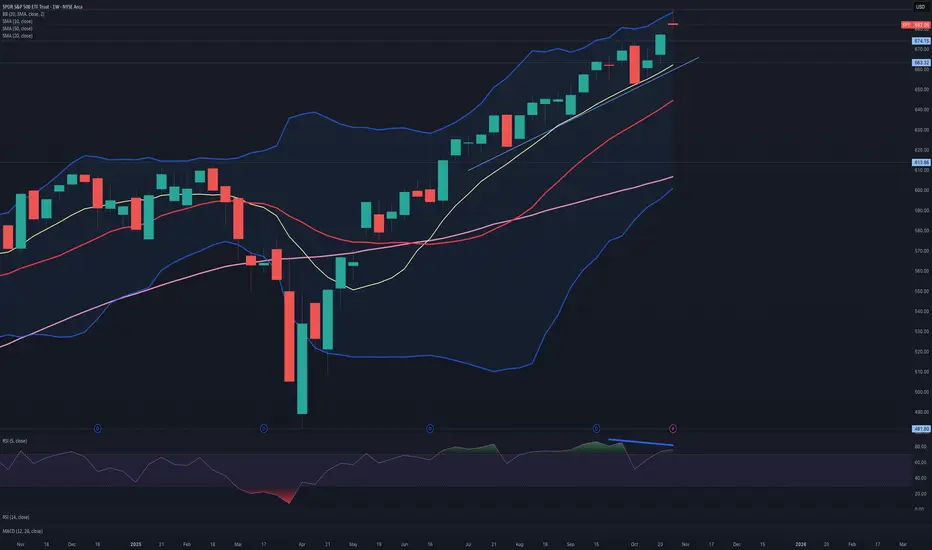
Something bad could be comingIt looks like we're completing wave 5 on the weekly chart, meaning we might get a massive correction in the next coming months.
Trade ideas
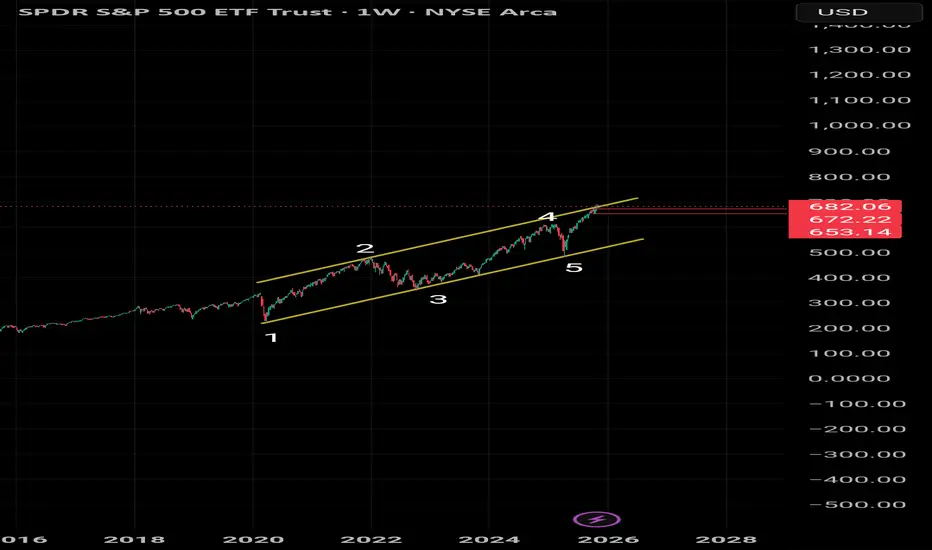
SPY BEARS ARE STRONG HERE|SHORT
SPY SIGNAL
Trade Direction: short
Entry Level: 681.87
Target Level: 650.12
Stop Loss: 702.99
RISK PROFILE
Risk level: medium
Suggested risk: 1%
Timeframe: 9h
Disclosure: I am part of Trade Nation's Influencer program and receive a monthly fee for using their TradingView charts in my analysis.
✅LIKE AND COMMENT MY IDEAS✅

FII Inflows vs. Outflows: Understanding Market SentimentIntroduction
In the ever-evolving landscape of global finance, Foreign Institutional Investors (FIIs) play a pivotal role in shaping the sentiment and direction of emerging markets like India. FIIs — such as hedge funds, pension funds, mutual funds, and insurance companies — bring large volumes of capital into domestic markets, seeking growth and diversification. Their investment behavior, whether inflows (buying) or outflows (selling), often acts as a powerful barometer of market confidence, macroeconomic outlook, and global risk appetite.
Understanding the dynamics between FII inflows and outflows helps investors, policymakers, and analysts interpret shifts in market sentiment and anticipate potential market movements. These capital flows can amplify trends, fuel rallies, or trigger corrections — depending on their magnitude and timing.
1. Who Are Foreign Institutional Investors (FIIs)?
Foreign Institutional Investors are large investment entities registered outside the domestic country that invest in financial assets like equities, bonds, or derivatives. They differ from Foreign Direct Investors (FDIs) because FIIs typically invest in financial markets for shorter durations rather than building physical assets or infrastructure.
Examples of FIIs:
Global mutual funds like BlackRock, Vanguard, and Fidelity.
Sovereign wealth funds from countries such as Singapore’s GIC or Norway’s NBIM.
Hedge funds and private equity firms seeking high returns in emerging economies.
Pension and insurance funds looking for diversification and long-term growth.
Their decisions to enter or exit a market depend on several factors — ranging from macroeconomic stability and policy reforms to global interest rates and currency strength.
2. The Concept of FII Inflows and Outflows
FII Inflows
These occur when FIIs purchase securities in the domestic market, leading to a net inflow of foreign capital. This typically indicates positive sentiment, suggesting investors have confidence in the country’s growth prospects, policy stability, or corporate earnings potential.
FII Outflows
Conversely, when FIIs sell domestic assets and repatriate funds, it leads to an outflow. This usually signals risk aversion, uncertainty, or profit-taking, reflecting a decline in investor confidence or shifts toward safer global assets.
The net FII position — inflows minus outflows — is a key metric that analysts monitor daily. Sustained inflows can lift stock indices, strengthen the domestic currency, and improve liquidity, while sustained outflows can depress markets and weaken sentiment.
3. Why FIIs Matter to Emerging Markets
FIIs are critical to the functioning of emerging economies for several reasons:
Capital Boost: They inject much-needed liquidity into the capital markets, helping firms raise funds efficiently.
Market Depth and Efficiency: FII participation improves price discovery and reduces volatility over the long term.
Currency Support: Inflows strengthen the domestic currency as foreign investors convert their dollars or euros into local currency.
Confidence Indicator: The presence of FIIs signals global confidence in the country's financial stability and growth prospects.
However, dependence on foreign capital can also make markets vulnerable to global shocks. Sudden withdrawals, as seen during crises like 2008 or 2020, can trigger sharp corrections and currency depreciation.
4. Factors Influencing FII Flows
The movement of FII money is influenced by a complex mix of global and domestic factors:
A. Global Factors
US Federal Reserve Policies: Higher US interest rates often trigger FII outflows from emerging markets as investors shift to safer, higher-yielding US assets.
Global Risk Sentiment: During geopolitical tensions or financial crises, FIIs typically move money to safe havens like the US dollar or gold.
Commodity Prices: Changes in crude oil or commodity prices can influence inflation and currency strength, indirectly affecting FII behavior.
Exchange Rates: A weakening local currency reduces returns for foreign investors, often leading to outflows.
B. Domestic Factors
Economic Growth Outlook: Strong GDP growth, industrial production, and corporate earnings attract FIIs.
Inflation and Interest Rates: Moderate inflation and stable monetary policy create a favorable investment climate.
Government Reforms: Policy measures such as tax simplification, infrastructure development, or digitalization enhance investor confidence.
Political Stability: A stable political environment assures investors of continuity in policy and governance.
5. The Relationship Between FII Flows and Market Sentiment
A. Inflows Reflect Optimism
When FIIs pour money into equity markets, it signals confidence in future growth and profitability. Such periods often coincide with bullish market phases, rising stock prices, and increased participation from domestic investors.
For example, in 2020–2021, FIIs heavily invested in Indian markets, betting on post-pandemic recovery, leading to a massive rally in benchmark indices like Nifty and Sensex.
B. Outflows Indicate Caution or Fear
Outflows usually occur during economic uncertainty, inflation fears, or political instability. When FIIs sell, markets tend to correct sharply due to the sheer volume of their trades. Domestic investors often interpret outflows as early warning signs, triggering a chain reaction of selling.
C. Market Sentiment Feedback Loop
FII behavior not only reflects market sentiment but also amplifies it. Positive inflows drive asset prices up, which in turn attracts more investors — creating a self-reinforcing cycle. Conversely, heavy outflows can depress prices, leading to panic and further withdrawals.
6. Impact of FII Flows on Key Market Variables
A. Stock Market Performance
FII inflows increase demand for equities, driving prices up and expanding market capitalization. Conversely, sustained outflows can cause sharp corrections. FIIs often focus on large-cap stocks and sectors like banking, IT, and energy, which heavily influence benchmark indices.
B. Currency Exchange Rate
Inflows strengthen the local currency as foreign investors convert foreign exchange into domestic currency. Outflows do the opposite — large-scale selling can weaken the currency, making imports costlier and impacting inflation.
C. Bond Yields
In the debt market, FII participation affects yields and borrowing costs. Heavy inflows reduce yields, signaling strong demand, while outflows push yields higher due to reduced liquidity.
D. Market Liquidity
FII inflows improve liquidity and enhance market efficiency, allowing smoother trade execution and tighter spreads. Outflows, however, can reduce liquidity and increase volatility.
7. Case Studies: FII Flows and Market Behavior
A. The 2008 Global Financial Crisis
During the 2008 crisis, FIIs pulled out billions from emerging markets amid a flight to safety. India witnessed a sharp fall in equity indices as foreign investors exited in panic, illustrating how global shocks translate into domestic volatility.
B. The Post-Pandemic Rally (2020–2021)
After the initial selloff in early 2020, FIIs returned aggressively as liquidity surged globally due to low interest rates and stimulus packages. India saw record FII inflows, propelling markets to all-time highs by 2021.
C. The 2022 Tightening Cycle
When central banks, led by the US Federal Reserve, began hiking rates in 2022, FIIs started withdrawing capital from riskier markets. This led to corrections in emerging market equities and depreciation of currencies like the Indian rupee.
8. The Role of Domestic Investors (DIIs) as a Counterbalance
Domestic Institutional Investors (DIIs) — such as mutual funds, insurance companies, and pension funds — often act as a stabilizing force. When FIIs exit, DIIs tend to buy the dips, cushioning the market from excessive volatility.
For example, in 2022, even though FIIs sold heavily, Indian markets remained relatively resilient due to strong DII inflows supported by growing domestic retail participation through SIPs (Systematic Investment Plans).
This increasing domestic base reduces overdependence on FIIs, making markets more internally stable over time.
9. Interpreting FII Data to Gauge Market Sentiment
Market participants regularly track FII activity to understand near-term and long-term sentiment.
Key indicators include:
Daily/Weekly FII Net Investment Data: Published by exchanges like NSE and BSE.
Sectoral FII Holdings: Shows which sectors are favored or avoided.
Derivative Positions: Reveal whether FIIs are bullish or bearish through futures and options data.
Typical Interpretations:
Continuous Inflows: Indicate optimism and risk appetite.
Moderate Outflows: May suggest short-term profit booking.
Heavy Outflows: Reflect fear or macroeconomic stress.
Mixed Trends: Suggest uncertainty or global event-driven reactions.
10. Policy Measures to Attract and Retain FII Investment
Governments and regulators often adopt strategies to maintain investor confidence and encourage foreign participation:
Stable Tax Regime: Simplified and predictable tax structures attract long-term investors.
Ease of Capital Entry and Exit: Liberalized investment norms ensure flexibility for FIIs.
Robust Regulatory Framework: Transparency in corporate governance and accounting standards boosts trust.
Infrastructure and Reform Push: Continuous improvement in logistics, digitalization, and reforms strengthens the investment ecosystem.
11. Risks of Overdependence on FII Flows
While FII inflows are beneficial, overreliance can be risky. Markets heavily influenced by foreign flows become vulnerable to global shocks. A sudden reversal in sentiment can trigger:
Sharp market corrections.
Currency depreciation.
Capital flight and liquidity stress.
Negative wealth effect on domestic investors.
Hence, building strong domestic participation and promoting long-term investments are key to achieving market resilience.
12. Future Outlook: FII Behavior in a Changing Global Landscape
As global markets evolve, FII strategies are becoming more data-driven, ESG-oriented, and diversified.
Trends to watch include:
Shift Toward Sustainable Investments: Environmental, Social, and Governance (ESG) factors are influencing allocation decisions.
AI and Quantitative Investing: FIIs increasingly use algorithms to detect opportunities in real-time.
Focus on Emerging Economies: Despite risks, long-term growth prospects in India, Indonesia, and Brazil continue to attract interest.
Rising Domestic Institutional Strength: With DIIs gaining momentum, the market is gradually balancing foreign and local influences.
Conclusion
The battle between FII inflows and outflows serves as a pulse check on global and domestic market sentiment. Inflows bring optimism, liquidity, and growth; outflows bring caution, correction, and discipline. Together, they reflect how global investors perceive a nation’s economic health and future trajectory.
For traders and policymakers alike, understanding the patterns and triggers of FII movements offers valuable insights into market cycles, risk trends, and sentiment shifts. While FIIs will continue to influence markets, a robust domestic investor base ensures that the market’s foundation remains resilient — balancing the scales of global capital dynamics.
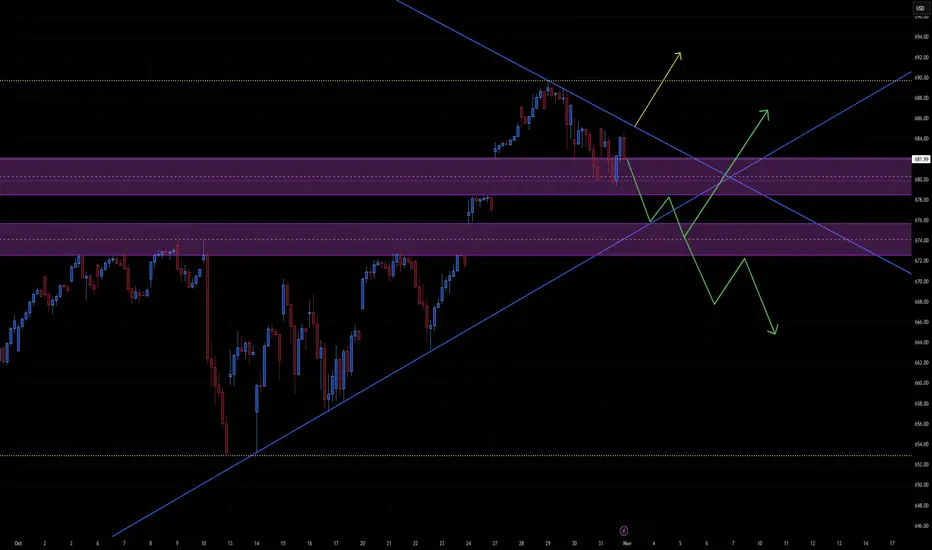
SPY indecision with a bigger move coming in next 2 weeksThe chart shows SPY (S&P 500 ETF) with:
Descending resistance trendline from recent highs
Ascending support trendline from the October lows
Two horizontal demand/supply zones around 675–678 and 680–684
Potential breakout and breakdown paths (yellow and green arrows)
This suggests you’re analyzing a symmetrical triangle or descending channel meeting an ascending trend, which typically resolves with a directional breakout soon.
📈 Bullish Case (Yellow Path)
Setup:
Price currently around 681–682, testing the upper supply zone and descending trendline.
Confirmation Needed:
Break and close above 684–686 (top of purple zone and descending resistance)
Hold that level as new support
Target Zones:
690–692 — measured move from the triangle and prior local resistance
700+ — if momentum builds on macro catalysts (earnings, rates, etc.)
Bullish Catalysts:
VIX cooling off, risk-on sentiment
Strong earnings / dovish Fed remarks
Volume-supported breakout above 684
Invalidation:
Failure to hold above 678 after breakout retest
📉 Bearish Case (Green Path)
Setup:
Rejection from the 681–684 resistance area and continuation under descending resistance.
Confirmation Needed:
Breakdown below 676, invalidating the ascending support trendline
Lower high confirmation near 681
Target Zones:
670–672 — first reaction zone (lower purple band)
662–664 — measured move from descending wedge
650–654 — extended target (matches prior low and yellow dotted support)
Bearish Catalysts:
Rising yields or hawkish Fed tone
Weak labor/inflation data
Broad risk-off correction
Invalidation:
Break above 686–688 with volume
⚖️ Neutral Outlook (Next 2–3 Weeks)
SPY is coiling tightly between 676 and 684, and volatility compression suggests a breakout likely within 1–2 weeks.
The key pivot is 680–682: above it favors short-term bulls; below 676 shifts momentum bearish.
🧩 Summary Table
Bias Confirmation Short-term Target Stop/Invalidation Notes
Bullish Close above 684 690–692 <678 Momentum breakout scenario
Bearish Close below 676 670 → 662 >686 Breakdown from wedge
Neutral Range 676–684 — — Wait for breakout confirmation
S&P 500 — Sector Performance Analysis (1Y, EUR)Over the past year, only 3 sectors have outperformed the index (+11.2%):
🔺 Technology ( AMEX:XLK +26.9%)
🔺 Communication Services ( AMEX:XLC +17.0%)
🔺 Consumer Discretionary ( AMEX:XLY +14.3%)
Meanwhile, 8 out of 11 sectors underperform the benchmark, and 5 of them are even in negative territory — including Energy, Health Care, and Materials.
💭 This highlights the narrow market breadth driving the S&P 500: a handful of mega-cap tech names are carrying the entire index while most sectors lag behind.
📈 Chart: TVC:SPX sectors — 1-year total return in EUR

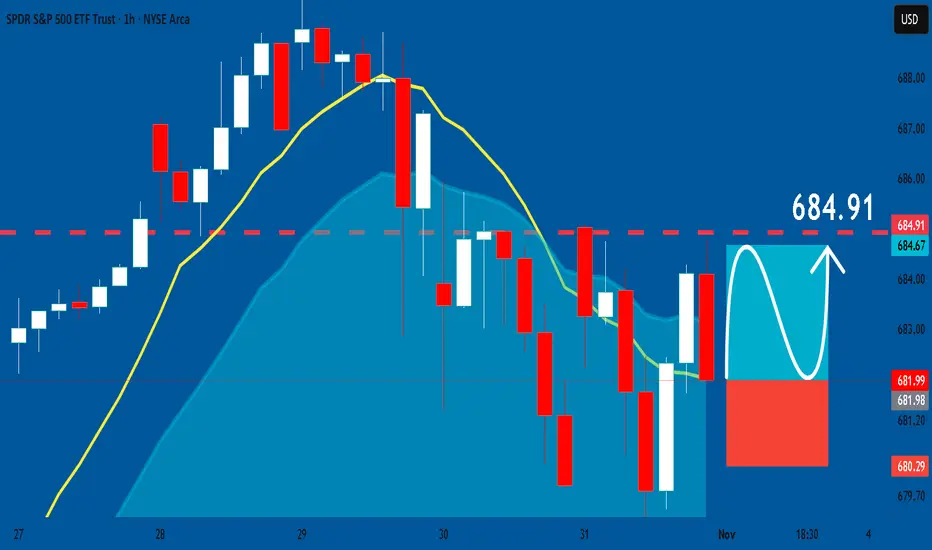
SPY: Long Signal with Entry/SL/TP
SPY
- Classic bullish pattern
- Our team expects retracement
SUGGESTED TRADE:
Swing Trade
Buy SPY
Entry - 681.99
Stop - 680.29
Take - 684.91
Our Risk - 1%
Start protection of your profits from lower levels
Disclosure: I am part of Trade Nation's Influencer program and receive a monthly fee for using their TradingView charts in my analysis.
❤️ Please, support our work with like & comment! ❤️
$SPY ends the week with a Shooting Star AMEX:SPY : The week ends with a Shooting Star pattern and a negative RSI 5 divergence.
Levels to watch if the Shooting Star pattern indicates a correction:
1. The last breakout resulted in a new all-time high at 674.
2. The last higher low, which coincides with the 10-week simple moving average, is a key support level that must hold for the uptrend to continue at 663.
Earnings Which Way Do We Go Pure TAStaying long took some off
see what earnings bring warning we can drop and continue lower to 460
Weekly stoch tuning up BUT has not broken the red line bottom up through 30%
no VOL

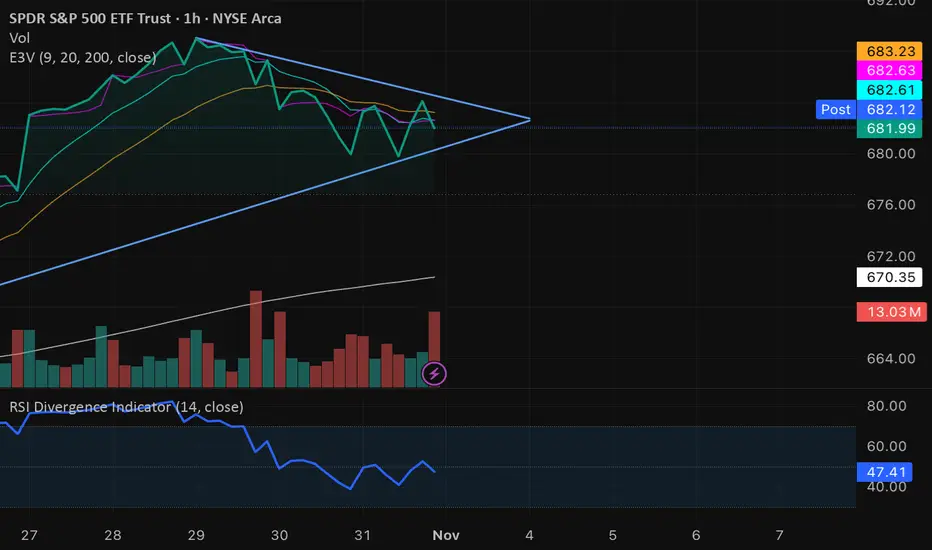
$SPY Symmetrical Triangle at Resistancewww.tradingview.com
Currently watching AMEX:SPY coil inside a symmetrical triangle after a strong run-up. Price is compressing between higher lows and lower highs. Volume is also tapering off, which is a classic sign of a potential breakout coming soon.
Sentiment for Next Week: Leaning Bullish
Unless AMEX:SPY breaks below the rising trendline with volume, the structure favors a bullish continuation breakout to the upside for next week ahead of earnings. If that lower trendline snaps, we could see a quick move into 675–670.
Bullish Confirmation : ABOVE 684
Bearish Confirmation : BELOW 680 / treadline support
Halloween Part 2SPX may gap down monday, if so, the ramp up at the end of the day was a C wave. Bias is still up. Oil closed the week above it's daily 18ma, so far so good for bulls. Vix pulled back from it's 18ma, but did not break it's lows. Gold still bear flagging. BTC closed the day below resistance and it's daily 18ma. The weekend will tell us more. Have a nice Halloween!

Opening (IRA): SPY February 20th -600P... for a 6.09 credit.
Comments: Laddering out at strikes better than what I currently have on. It would be better if I had weakness, but I've got dry powder for that should it occur.
Targeting the strike paying around 1% of the strike price in credit. Will generally roll to lock in realized gains and/or "window dress" (i.e., roll down and out to a lower strike paying approximately the same amount of credit.

HalloweenSPY may chop around and end bullish for the day but I think it would still be a sell into next week. Gold still bear flagging. Oil - a little pump but dropping quickly. VIX still at support. BTC testing it's 110k resistance and 18 daily ma.

$SPY - Weekly Parabolic channelCheck this monthly chart
SPY
on the monthly chart continues to respect a long-term ascending channel that began after the 2020 crash.
Price has now re-entered the multi-year supply/demand zone from 2021–2022, which previously acted as strong resistance and may now serve as a key support base.
SPY
Since late-2023, momentum has accelerated within a steeper rising channel, hinting at potential overextension as the two channels converge near the 690–700 area.
Key points:
Primary trend: bullish since 2020 within the orange channel.
Multi-year S/D zone: 2021–2022 highs acting as structural support.
Secondary (steep) channel: signals short-term momentum that could face exhaustion soon.
Watch for either a breakout continuation above 700 or a pullback toward the mid-trendline for mean reversion.
Bias: Neutral to mildly bullish short term, but watching for signs of exhaustion as SPY approaches long-term resistance.
#SPY #S&P500 #TechnicalAnalysis #TradingViewIdeas #PriceAction #SupplyDemand #ChannelPattern

$SPY– Daily Parabolic ChannelCheck this monthly chart
SPY
on the monthly chart continues to respect a long-term ascending channel that began after the 2020 crash.
Price has now re-entered the multi-year supply/demand zone from 2021–2022, which previously acted as strong resistance and may now serve as a key support base.
SPY
Since late-2023, momentum has accelerated within a steeper rising channel, hinting at potential overextension as the two channels converge near the 690–700 area.
Key points:
Primary trend: bullish since 2020 within the orange channel.
Multi-year S/D zone: 2021–2022 highs acting as structural support.
Secondary (steep) channel: signals short-term momentum that could face exhaustion soon.
Watch for either a breakout continuation above 700 or a pullback toward the mid-trendline for mean reversion.
Bias: Neutral to mildly bullish short term, but watching for signs of exhaustion as SPY approaches long-term resistance.
#SPY #S&P500 #TechnicalAnalysis #TradingViewIdeas #PriceAction #SupplyDemand #ChannelPattern

Wait for the BuyWe're cruising along today. The market pushed down this morning, then into accumulation, wait for the push lower. If its rejected, we'll see a push to the upside and close above 686 indicating a higher movement to come, followed by a pull back into our buying opp. Stay bull, we're headed back to 690.

SPY to 670 area Even if it floats up today I think a sell to 670 is likely. Vix holding support above 16. Gold flagging but probably goes higher. Oil needs to start attracting buyers otheriwse the downtrend continues. BTC looks like it will drop to 105k minimum.

History Repeats (Dot Com Bubble but this time AI Hype)Jan, 2028 will probably see the height of the bubble at around $966 for SPY. Recycle, Reuse, Rinse, Repeat. Looking forward to being right, moreso than generating about a 5x return. See you on the dark side of the moon.

Post PowellSPX found resistance again at the structural trendline but bias is still up. VIX is holding above 16 but bias is still down. Gold liely rallies more overnight and into tomorrow. BTC is testing support again and may break. Oil is still above the 18 but not attracting buyers just yet.

$SPY– Multi-Year S/D Zone & Riding a Parabolic ChannelAMEX:SPY AMEX:SPY on the monthly chart continues to respect a long-term ascending channel that began after the 2020 crash.
Price has now re-entered the multi-year supply/demand zone from 2021–2022, which previously acted as strong resistance and may now serve as a key support base.
AMEX:SPY
Since late-2023, momentum has accelerated within a steeper rising channel, hinting at potential overextension as the two channels converge near the 690–700 area.
Key points:
Primary trend: bullish since 2020 within the orange channel.
Multi-year S/D zone: 2021–2022 highs acting as structural support.
Secondary (steep) channel: signals short-term momentum that could face exhaustion soon.
Watch for either a breakout continuation above 700 or a pullback toward the mid-trendline for mean reversion.
Bias: Neutral to mildly bullish short term, but watching for signs of exhaustion as SPY approaches long-term resistance.
#SPY #S&P500 #TechnicalAnalysis #TradingViewIdeas #PriceAction #SupplyDemand #ChannelPattern

It's nuke timeOut of BB and having 3 gaps and mcd conversing as well. Within a week it will be come back to 670 easy

SPY: Post-Breakout Bullishness Meets Fed Caution – What's Next?SPY: Post-Breakout Bullishness Meets Fed Caution – What's Next?
Hello everyone! Let's take a look at SPY (S&P 500 ETF) on the daily timeframe, which has had quite an eventful October!
After some significant volatility earlier in the month, we've seen a strong surge, particularly after the positive U.S.-China trade news. This momentum has helped SPY to decisively break above a key resistance area.
Current Situation:
We've just cleared the recent breakout zone between 670 to 675. This is a very positive sign, indicating strong buying interest. However, price has moved up quite rapidly, creating a "Fair Value Gap" (FVG) – an area where price moved fast without much trading, which often acts like a magnet for future price action.
Now, with the upcoming Fed interest rate decision on October 29th and other economic data releases, we need to consider two main scenarios:
Scenario 1: The Ideal Bullish Continuation (Dotted Blue Line)
Our ideal outlook suggests that the market will continue its upward trend. For this to happen in a healthy way, we'd like to see SPY:
Retest the Breakout Zone: A small pullback to retest the 670 to 675 zone would be constructive. This confirms that the old resistance has now become strong support.
Continuation to the Trend: If this zone holds firmly after the retest, it would provide a solid base for the bullish momentum to continue, pushing SPY to potentially new highs. This retest is a common and healthy pattern after a strong breakout.
Scenario 2: Volatility & Potential Pullback (Dotted Orange/Blue lines and FVG)
We must also be prepared for increased volatility and a possible pullback. This could be triggered by:
Fed Decision & Economic Data: The Fed's interest rate decision and comments on Wednesday, October 29th, along with other key economic data, can introduce significant uncertainty and market swings.
FVG Fill: The rapid move up has left a "Fair Value Gap" (FVG) below. Price often retraces to fill these inefficiencies. A pullback to fill this FVG is very possible, especially if the Fed's stance isn't as dovish as hoped, or if other economic data disappoints.
Key Support Levels: If a deeper pullback occurs, we'll be watching:
Intermediate Support near 660: The first key area to potentially halt a decline.
650 to 655 Clear Support Area: This is a stronger support zone that has held previously, reinforced by the longer-term green trendline.
In Summary:
The overall trend is bullish following the breakout, but current levels are extended. Traders should closely watch how SPY reacts around the 670-675 level, especially in light of the upcoming Fed announcement. A successful retest and bounce would reinforce the bullish case, while a failure to hold, especially on negative news, could lead to a deeper correction towards our highlighted support levels.
Trade wisely and stay tuned for the Fed!
Disclaimer:
The information provided in this chart is for educational and informational purposes only and should not be considered as investment advice. Trading and investing involve substantial risk and are not suitable for every investor. You should carefully consider your financial situation and consult with a financial advisor before making any investment decisions. The creator of this chart does not guarantee any specific outcome or profit and is not responsible for any losses incurred as a result of using this information. Past performance is not indicative of future results. Use this information at your own risk. This chart has been created for my own improvement in Trading and Investment Analysis. Please do your own analysis before any investments.

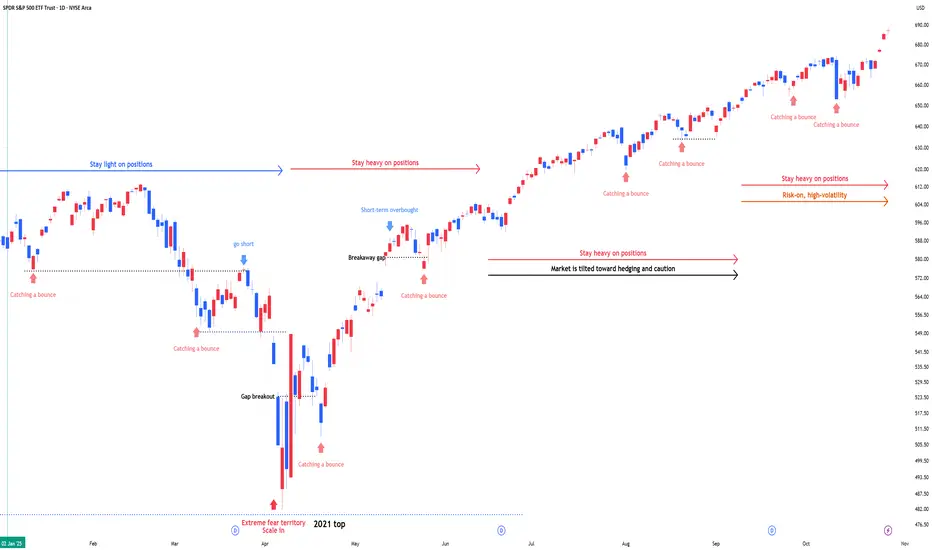
SPY : Stay heavy on positionsSPY : Stay heavy on positions (2x leverage)
Entering a risk-on, high-volatility zone.
In stay light on positions zones, I hold SPY(+QQQ) and reduce exposure.
In stay heavy on positions zones, I increase allocation using a mix of SSO(+QLD) and TQQQ.
** This analysis is based solely on the quantification of crowd psychology.
It does not incorporate price action, trading volume, or macroeconomic indicators.
Tuesday evening updateSPX rallied to another structural trendline and now has 4 daily bearish divergences on the rsi. Still the bias is up. VIX found support under 16 and at it's trendline. Gold looks like it will bounce with silver leading. BTC rejected from 116k and I think it is a short to 100k minimum.
