SPY: Post-Breakout Bullishness Meets Fed Caution – What's Next?SPY: Post-Breakout Bullishness Meets Fed Caution – What's Next?
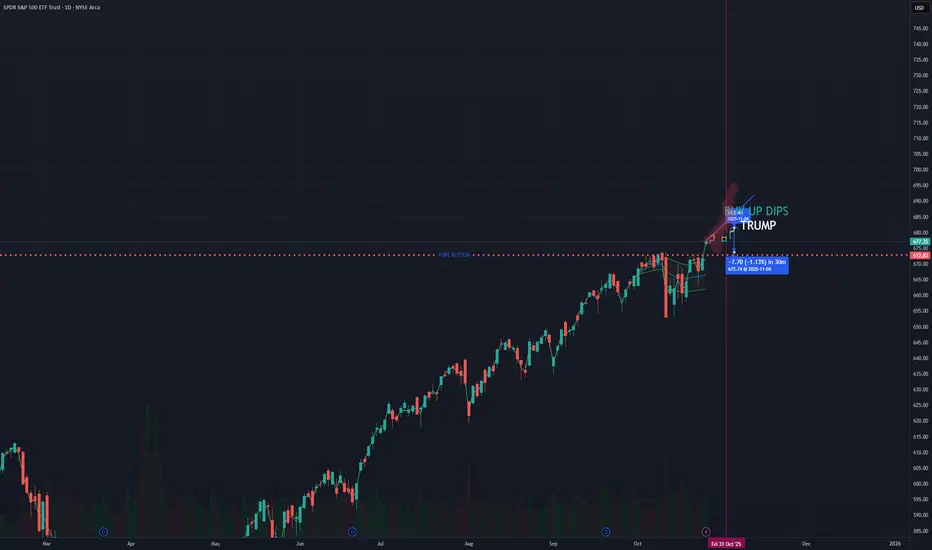
Hello everyone! Let's take a look at SPY (S&P 500 ETF) on the daily timeframe, which has had quite an eventful October!
After some significant volatility earlier in the month, we've seen a strong surge, particularly after the positive U.S.-China trade news. This momentum has helped SPY to decisively break above a key resistance area.
Current Situation:
We've just cleared the recent breakout zone between 670 to 675. This is a very positive sign, indicating strong buying interest. However, price has moved up quite rapidly, creating a "Fair Value Gap" (FVG) – an area where price moved fast without much trading, which often acts like a magnet for future price action.
Now, with the upcoming Fed interest rate decision on October 29th and other economic data releases, we need to consider two main scenarios:
Scenario 1: The Ideal Bullish Continuation (Dotted Blue Line)
Our ideal outlook suggests that the market will continue its upward trend. For this to happen in a healthy way, we'd like to see SPY:
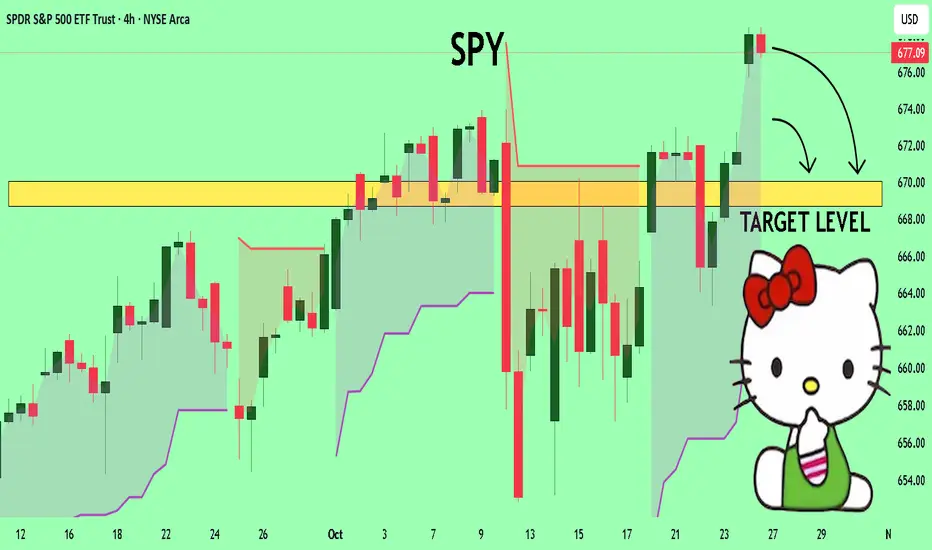
Retest the Breakout Zone: A small pullback to retest the 670 to 675 zone would be constructive. This confirms that the old resistance has now become strong support.
Continuation to the Trend: If this zone holds firmly after the retest, it would provide a solid base for the bullish momentum to continue, pushing SPY to potentially new highs. This retest is a common and healthy pattern after a strong breakout.
Scenario 2: Volatility & Potential Pullback (Dotted Orange/Blue lines and FVG)
We must also be prepared for increased volatility and a possible pullback. This could be triggered by:
Fed Decision & Economic Data: The Fed's interest rate decision and comments on Wednesday, October 29th, along with other key economic data, can introduce significant uncertainty and market swings.
FVG Fill: The rapid move up has left a "Fair Value Gap" (FVG) below. Price often retraces to fill these inefficiencies. A pullback to fill this FVG is very possible, especially if the Fed's stance isn't as dovish as hoped, or if other economic data disappoints.
Key Support Levels: If a deeper pullback occurs, we'll be watching:
Intermediate Support near 660: The first key area to potentially halt a decline.
650 to 655 Clear Support Area: This is a stronger support zone that has held previously, reinforced by the longer-term green trendline.
In Summary:
The overall trend is bullish following the breakout, but current levels are extended. Traders should closely watch how SPY reacts around the 670-675 level, especially in light of the upcoming Fed announcement. A successful retest and bounce would reinforce the bullish case, while a failure to hold, especially on negative news, could lead to a deeper correction towards our highlighted support levels.
Trade wisely and stay tuned for the Fed!
Disclaimer:
The information provided in this chart is for educational and informational purposes only and should not be considered as investment advice. Trading and investing involve substantial risk and are not suitable for every investor. You should carefully consider your financial situation and consult with a financial advisor before making any investment decisions. The creator of this chart does not guarantee any specific outcome or profit and is not responsible for any losses incurred as a result of using this information. Past performance is not indicative of future results. Use this information at your own risk. This chart has been created for my own improvement in Trading and Investment Analysis. Please do your own analysis before any investments.
Trade ideas

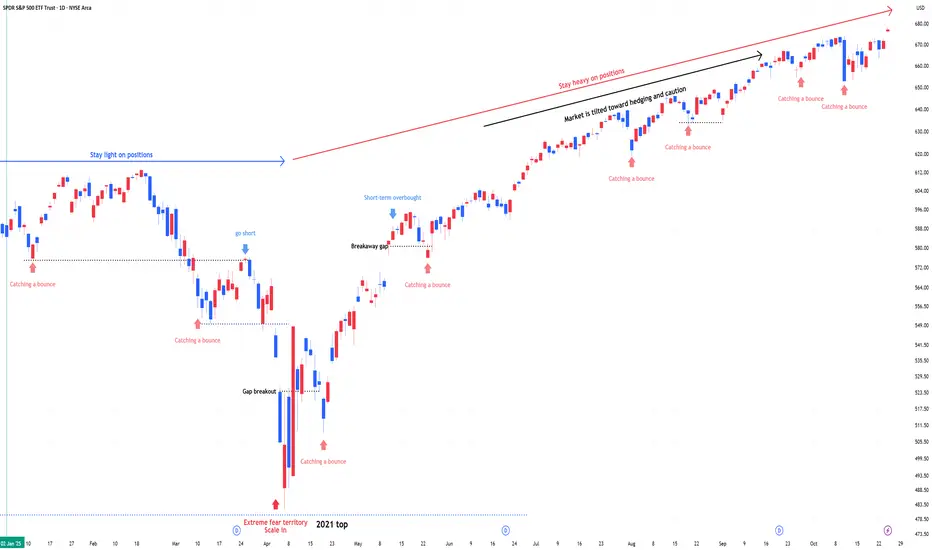
SPY : Stay heavy on positionsSPY : Stay heavy on positions (2x leverage)
Entering a risk-on, high-volatility zone.
In stay light on positions zones, I hold SPY(+QQQ) and reduce exposure.
In stay heavy on positions zones, I increase allocation using a mix of SSO(+QLD) and TQQQ.
** This analysis is based solely on the quantification of crowd psychology.
It does not incorporate price action, trading volume, or macroeconomic indicators.
Tuesday evening updateSPX rallied to another structural trendline and now has 4 daily bearish divergences on the rsi. Still the bias is up. VIX found support under 16 and at it's trendline. Gold looks like it will bounce with silver leading. BTC rejected from 116k and I think it is a short to 100k minimum.

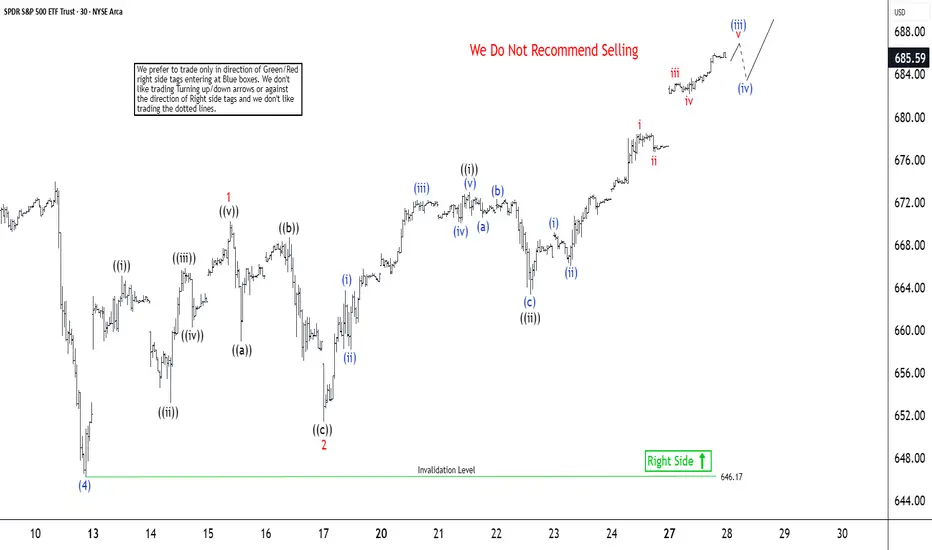
S&P 500 ETF (SPY) Advances with Nested Structure in Wave (5)The short-term Elliott Wave analysis for the S&P 500 ETF (SPY) indicates an ongoing bullish cycle that began at the April 2025 low, unfolding as a five-wave impulse structure. As shown in the 30-minute chart, wave (4) of this impulse concluded at 646.17. The final leg, wave (5), is currently underway, characterized by an internal five-wave structure with nested subdivisions. From wave (4), wave ((i)) peaked at 665.13, followed by a pullback in wave ((ii)) to 653.17. Wave ((iii)) then advanced to 665.83, with a subsequent dip in wave ((iv)) to 660.28. The final wave ((v)) reached 670.23, completing wave 1 on a higher degree.
Subsequently, the ETF corrected in wave 2, forming a zigzag Elliott Wave pattern that bottomed at 651.41. From wave 1’s peak, wave ((a)) declined to 658.93, followed by a rally in wave ((b)) to 668.71. Wave ((c)) then dropped to 651.41, finalizing wave 2. The ETF has since resumed its upward trajectory in wave 3. From wave 2’s low, wave ((i)) climbed to 672.99, and wave ((ii)) dipped to 663.30. In the near term, anticipate a pullback finding support in a 3, 7, or 11 swing against 646.17, setting the stage for further upside. This analysis suggests continued bullish momentum with well-defined support levels guiding the next moves.
Close to bulls Once it reach to 695 then its time to be cautious You can draw thr fib then the 1.68 lies at 695 and everytime once it touch the fib 1.68 it drop hard so may be same thing will happen this time as well.

October 27th 2025 - S&P short lived consolidation.. Breakout nowOctober 27th 2025 - Last weeks consolidation lasted until Friday's break out, S&P500 SPY closed at 677.25 which was all time high that lasted only until today. New all time high close at 685.18 today...
Watching support now 673.95 and we will see if we get a higher open in the morning... so watching res around the new all time high of 685.18.

Monday morning updateSPX likely pushes higher to 6900 area. Gold may reverse violently to the upside if it can recover 4025. Oil looks fine, BTC probably a little higher but it's just in a Wyckoff topping structure.

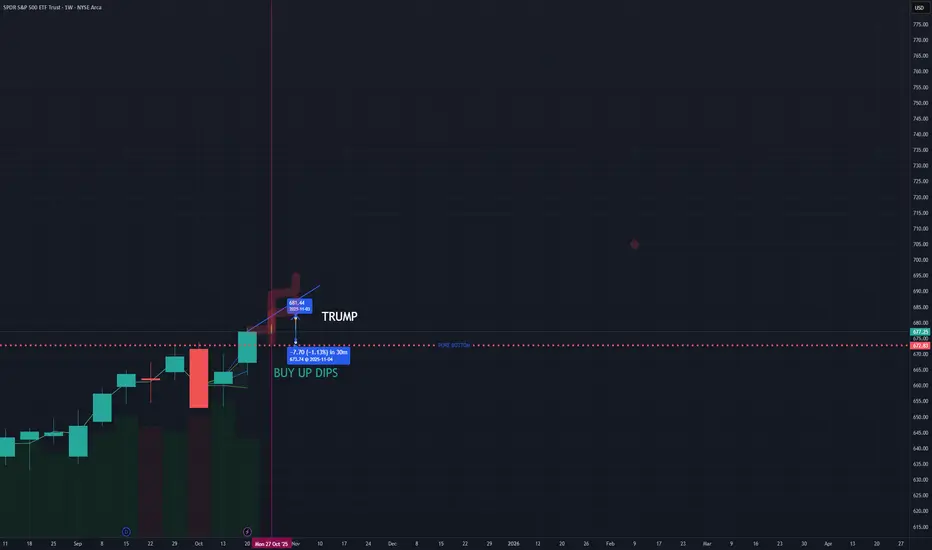
SPY is going to hit ATH around 700 but cautious for ABC wave droSpy is part of wave 5 on weekly time frame
Wave 5 target is 700 around Dec,2025
ABC target is 485 around Sep 2026
Best of luck.

$SPY. Sell 682/683 bear call spreads at open tomorrow.Y'all - I lost my dog 3 days ago. :( But I can still make some sweet calls.

Current SPY ConditionsI will use this chart to identify any important technical setups. This is th 60 Min Chart


SPY and QQQ Macro outlook for 27 to 31 Oct 2025Macro map for 27 to 31 Oct 2025
Concentration of policy and inflation prints means policy expectations and real yields will drive the United States dollar, global equities, bitcoin, and gold. The hinge events are Wednesday FOMC, Thursday US GDP advance and German data, Friday US Core PCE and Chicago PMI. Secondary drivers are BoJ policy guidance and ECB tone, plus BoC.
Watch list
Real ten year yield and the DXY dollar index after FOMC and PCE
EUR front end versus USD front end after ECB and FOMC
VIX around the FOMC window and into PCE
US liquidity windows around 14:00 Eastern on Wednesday and 08:30 Eastern on Thursday and Friday
SPY and QQQ outlook for next week
Set up
US equities enter a policy and growth triad. Wednesday brings the FOMC decision and press conference. Thursday brings the first look at Q3 growth. Friday brings the price index that the Fed emphasizes. The path for real yields and the earnings tone are the first order drivers. Valuation sensitivity is higher in QQQ due to the weight of long duration cash flows. SPY has more cyclicals and defensives and therefore reacts more to growth beats or misses.
Baseline view
A patient Fed message combined with growth that is solid but not hot and inflation that continues to ease supports a grind higher. The market prefers falling real yields with inflation in check. A hawkish shift in the balance of risks, or a hot inflation print that lifts terminal pricing, pressures multiples and skews returns lower. If messages conflict, expect a whipsaw week with heavy rotation.
Scenarios and probabilities
Relief grind higher with QQQ leadership. Probability thirty eight. Triggers are a patient tone on Wednesday, a growth print that shows resilience without overheating, and Core PCE that validates disinflation. Breadth improves and volatility stays contained.
Air pocket lower. Probability thirty two. Triggers are a firmer Core PCE or a hawkish shift in the statement language that pushes real yields up. Valuation compression hits QQQ first and deepest. SPY holds better if staples and energy carry.
Two way chop with wide intraday bars. Probability thirty. Triggers are mixed messages across events and sectors. Expect quick moves around 14:00 Eastern on Wednesday and 08:30 Eastern on Thursday and Friday with mean reversion later in the day.
Key confirms
Watch the ten year real yield and the curve. A drop in real yields with stable breakevens favors a risk appetite day. A jump in real yields with a firm dollar and tight financial conditions favors de‑risking. Also watch VIX and the put call ratio into Wednesday afternoon to gauge dealer positioning.
Risk notes
Large cap earnings that land between FOMC and PCE can add idiosyncratic gaps. Respect prior week high and low as regime markers. If the market opens outside that range and fails to re enter on a retest, trend day odds increase.

October 27 - October 31 2025Last week of the month and the market is back at ATH - but is this a true breakout or a final shakeout of buyers? I think the market is showing some important clues and will run through my charts again but plan on keeping this brief so I can move on to other things on this beautiful Sunday.
1. Macro
As I mentioned in last week’s post, the $GOLD/GVZ spread was showing signs of trend exhaustion (gold puts were being hedged heavily compared to the underlying) which provided to be an early signal of the Gold pullback. Here we are seeing the Dollar’s continued flat movement, which may result in a move below the average this week.
Yields continue to slide and are now diverging, with the 3M yield possibly showing signs of outpacing the 10Y yield to the downside, which may suggest that the market is expecting speedier intervention from the Fed.
On the bottom left, I have overlaid ECONOMICS:USCCPI on my forward inflation gauge chart to illustrate that the market has been pricing in lower inflation expectations, and we are now seeing the initial tariff-bump to inflation flatten out, which is in line with the market’s expectation. Bottom line - the market should now be more sensitive to news that could indicate higher inflation since it is currently pricing for lower rather than before when the market was pricing higher inflation that ended up being slightly higher than the real data.
On the commodities side, we’re seeing more of the same. I’ll touch more on gold on my Risk layout and it looks like Oil NYMEX:CL1! is still in a flat range and may be making a lower high after a lower low. This week I have expanded my commodity index (bottom right) to add Cotton ICEUS:CT1! and Aluminum COMEX:ALI1! to broaden the scope. My thinking is that corn CBOT_MINI:MZC1! is one of the most versatile crops in the world: a staple food, biofuel, and industrial crop, while Cotton is unique in that it is a non-food crop that is essential to the manufacturing of clothing and other consumer & industrial products. This pairing covers all the bases when it comes to demand for crops for various uses. Similarly, my thinking for metals is that Copper COMEX:HG1! is widely used in electrical infrastructure and consumer/industrial electronics while Aluminum COMEX:ALI1! is used in consumer products, construction, auto manufacturing, and so on.
The takeaway is that the gauge here has been in an uptrend in April while real inflation and forward inflation expectations have cooled, so the market is likely absorbing these higher prices/not passing them to consumers. Conclusion: the macro environment is looking more stable, however with China tariffs in focus it will be highly important to watch the commodity gauge and TVC:US03MY . Commodity gauge rising sharply could force the market to reprice inflation expectations, which would benefit Gold, hurt the dollar TVC:DXY and possibly lead to higher bond yields. I’m cautiously optimistic here.
2. FX
Using a date range of the last Fed rate decision to today, the dollar TVC:DXY has outperformed other currency baskets (while still being the worst performer for the year). When looking at global 3M and 10Y yields on indexed charts, outside of Japan there was 10Y buying during mid-October that is now showing signs of flattening out. On the 3M side, treasuries have slid while Eurozone (EU, France, Italy, Germany) are showing some divergence, likely due to a troubling combination of slow growth, high debt, and political instability. The takeaway here is that I expect the dollar’s flat range to continue, and may outperform other currency baskets as a result. This chart also indicates that the US bond market is currently providing a safe haven, especially when relatively attractive Real Yields are considered as well.
3. Risk
This chart shows indexes appeared to have recovered from the period of volatility and the line chart appears to show upward momentum, rather than a top forming. This is bolstered by the High Yield-Investment Grade bond Option Adjusted Spread (top left) showing signs of consolidation or moving back down. Investment Grade bonds currently have a very low premium vs treasuries, so downside resistance should be expected. Keeping it around this level would be ideal, as the OAS moving too low could make the market sensitive to a shock and moving higher could indicate an adverse sentiment towards risk.
Other signs are promising though. $ES1!/GOLD looks like it is going to move higher, further supporting the bias that the gold rally will continue to stall or pull back further. On the top right, $SPY/RSP (SPY vs the equal-weight ETF) shows the weighted index will continue in its uptrend, benefiting the companies with the most weight such as Tech.
One last comment on gold: on the $GOLD/GVZ chart we can see that Gold found support near a familiar level and will either see further reversion or a new upward trend form. This could suggest that the gold downside risk is fading, so it will be important to watch if Gold catches a bid and if so, whether or not it is accompanied by strong hedging. Since I’m mostly leaning towards Gold being flat, I think the more likely scenario is that the gold rally stalling will be temporary and will probably not be accompanied by strong hedging of puts.
4. Sector Analysis
Now that we have seen what is likely a volatility peak, it’s a good time to assess where the market is positioned. Good news is that even though the market pulled back and chopped around in October, Tech (XLK) is still outperforming the market and is on track to continue rising while defensive sectors underperform. Since I have already outlined other reasons why Tech and mega caps are likely to continue outperforming the broader market ( $NQ1!/YM1! and $SPY/RSP ), this is just further confirmation of what I’m already seeing.
5. Bias
As I mentioned last week, I’m currently taking a shorter-term trading approach and as a result, this Bias chart is now focused more on assessing and capturing volatility than determining market bias.
With that being said, the important notes I have are that VIX and VVIX look to have peaked and CVD saw some action last week with strong effort from sellers that did not really move the price down. Futures just opened higher so the session may have lower volatility on Monday (mean reversion) but overall the bullish case here is solid.
Conclusion:
Most signs I’m seeing here point to continued upside for stocks, as fear is being priced out and greed is being priced back in. As I mentioned above, I will watch the macro indicators and sectors for signs that the trend is changing but since we are likely seeing a true breakout, more upside should be expected unless something major changes.
SPY: Last week of OctoberRealized, I forgot to do a halloween themed post :O! oh god,
Will have to make it up with a Christmas theme post haha.
My thoughts for next week, last week of October.
Not advice.
Safe trades and enjoy the scant amount of weekend left!
🎃🎃🎃🎃🎃🎃

SpySo lets get this straight,
Market has rallied non stop since april lows.
the Fed is cutting rates, Tariff deals are about to be smoothen out, A.I bubble is booming and big tech smashing earnings. All this good news + the addition of Seasonality and market can rally for another 10% right?
Remember when you make money off of calls it's Because someone was bearish. what happens to the market when the last bear is squeezed? Lol...
Spy
Monthly
Back at 16yr trend resistance
Spy daily chart
I Zoomed in and you can see that on Oct 10th Price started to sell up here near 16yr resistance but was bought up
Daily chart again with just Bollinger bands..
We closed near the top of the Bollinger bands
Closing near the top of bbands Friday means any gap up Monday will most likely stall out and trap late bubefore.
From my personal experience, there is usually a rug pull going into big tech earnings to try and stop out any one who bought tech calls the weak berfore. With this gap up Monday I wouldn't wait for a dump either Tuesday or Wed to try long again if that's your plan.
If you want to short or fade, I'm in your corner, but there's is a chance of a prop and theta burn Monday-Tuesday. What I mean by that is, let's say Spy gaps up to 680-682 and then from there it just pulls back to 679 and trades between 679-682 all the into Wed... that would be a theta burn..
To the downside , Spy would have to break below 674 and then you'd short for 669.. 20sma is at 667 so that would be as low as I can call for a pullback
2 things would have to happen for me to believe a true correction is underway
1st. Would be a vix spike back above 20.00
2nd. Would be AMEX:SPY closing back below that weekly bearish engulfing at 671
Maximum upside move this week would be 686 which is trendline resistance and around 3% extended from the 20sma.. Spy doesn't like being extended from its 20ma
Personally I'd stay away from the indexes until mid week.. like I said, any gap up will be to overbought to chase but they may get it propped up on a theta burn..
Despite going into bullish Seasonality, I'll have to be the bearish contrairian here.
I'm looking for NASDAQ:QQQ to close that gap at 589 before it breaks over 625.

Weekly PreviewSPX on friday felt like a distribution day. Although it didn't sell down, it didn't gain much ground after the open. Vix is at support. Gold probably a bit higher still. BTC now above 111k and probably wants to take out stops around 116k. Oil still looks fine for more upside. Good luck!

Trading plan 10/27-10/31We will push for all time highs next week Monday and Tuesday not much is going on but Wednesday to Friday will be packed.

SPY: Bears Will Push
Looking at the chart of SPY right now we are seeing some interesting price action on the lower timeframes. Thus a local move down seems to be quite likely.
Disclosure: I am part of Trade Nation's Influencer program and receive a monthly fee for using their TradingView charts in my analysis.
❤️ Please, support our work with like & comment! ❤️

Trading week 10/27 - 10/31 ATH INCOMING!we are the quant and a big week is approaching us we used all the data with economic data, earnings & geopolitical events coming up.
Trading week 10/27 - 10/31 ATH INCOMING! we are the quant and a big week is approaching us we used all the data with economic data, earnings & geopolitical events coming up.
Stock Market Forecast | TSLA NVDA AAPL AMZN META MSFTStock Market Forecast | CME_MINI:NQ1! CME_MINI:ES1! SP:SPX NASDAQ:NDX
Mag 7 | TSLA NVDA AAPL AMZN META MSFT GOOGL

SPY The Target Is DOWN! SELL!
My dear friends,
SPY looks like it will make a good move, and here are the details:
The market is trading on 677.09 pivot level.
Bias - Bearish
Technical Indicators: Supper Trend generates a clear short signal while Pivot Point HL is currently determining the overall Bearish trend of the market.
Goal - 670.03
About Used Indicators:
Pivot points are a great way to identify areas of support and resistance, but they work best when combined with other kinds of technical analysis
Disclosure: I am part of Trade Nation's Influencer program and receive a monthly fee for using their TradingView charts in my analysis.
———————————
WISH YOU ALL LUCK
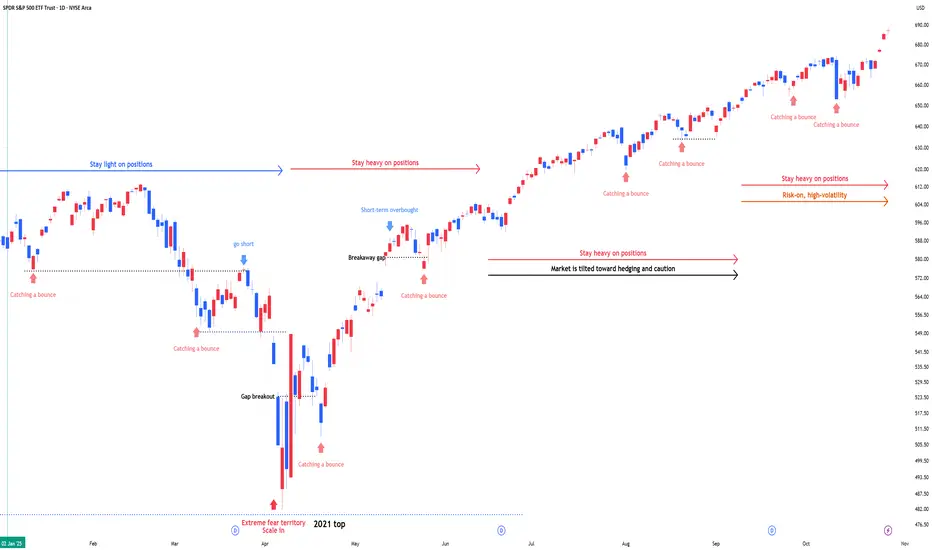
SPY : Stay heavy on positionsSPY : Stay heavy on positions (2x leverage)
Entering a risk-on, high-volatility zone.
In stay light on positions zones, I hold SPY(+QQQ) and reduce exposure.
In stay heavy on positions zones, I increase allocation using a mix of SSO(+QLD) and TQQQ.
** This analysis is based solely on the quantification of crowd psychology.
It does not incorporate price action, trading volume, or macroeconomic indicators.