272.30This channel is not providing individualized trading or investment advice, nor is it a banking service, brokerage service, trading service, investment service or money management service
Trade ideas

Super high Reward Risk Ratio in MSTRAt 267, MSTR is at its long term trend line support.
As per ELliot wave it shows the end of corrective waves. Highly profitable entry setup with just 5% risk as stop loss.

Why the Eurodollar Market Became a Financial HavenIntroduction
The Eurodollar market stands as one of the most significant and transformative developments in modern finance. Despite its name, the term “Eurodollar” has little to do with Europe as a continent or the euro as a currency. Instead, it refers to U.S. dollar-denominated deposits held in banks outside the United States, particularly in Europe during its early days. What began as a niche market in the post-World War II era gradually evolved into a global financial haven—an offshore ecosystem of liquidity, flexibility, and innovation that reshaped international finance.
Understanding why the Eurodollar market became a financial haven requires examining the historical context, regulatory framework, and the incentives driving global capital flows. It was not merely a byproduct of globalization; it was the very foundation that allowed global finance to operate efficiently across borders, free from the constraints of national monetary policies.
1. Origins of the Eurodollar Market
The roots of the Eurodollar market trace back to the late 1940s and 1950s, when geopolitical tensions and economic transformations began reshaping the financial landscape. After World War II, the United States emerged as the world’s dominant economic power, with the U.S. dollar becoming the global reserve currency under the Bretton Woods system.
During this time, many foreign banks and corporations began holding dollar deposits outside the United States, particularly in European banks. One of the first major holders of such deposits was the Soviet Union, which sought to protect its dollar holdings from potential U.S. sanctions during the Cold War. By placing dollars in European banks, the Soviets could still conduct trade and financial transactions in dollars—without the risk of U.S. authorities freezing their assets.
As European economies rebuilt under the Marshall Plan, dollar-based trade expanded rapidly. European banks found themselves flush with dollar deposits, which they began lending out to other international borrowers. This marked the birth of the Eurodollar market—a decentralized, unregulated offshore market for U.S. dollars.
2. Regulatory Arbitrage: The Core Catalyst
The Eurodollar market thrived largely because it existed outside U.S. regulatory jurisdiction. Domestic banks in the United States faced strict regulations under the Federal Reserve System, including reserve requirements and interest rate ceilings imposed by Regulation Q. These restrictions limited how much interest U.S. banks could pay on deposits and constrained their lending flexibility.
In contrast, offshore banks—mainly in London—were not subject to U.S. banking regulations. This regulatory arbitrage created a competitive advantage: Eurodollar deposits could offer higher interest rates, and Eurodollar loans could be made more flexibly and at lower costs.
Borrowers and depositors around the world quickly recognized the benefits. Multinational corporations preferred Eurodollar loans for their international operations, and investors sought Eurodollar deposits for better yields. The absence of reserve requirements meant that Eurobanks could leverage their funds more aggressively, enhancing liquidity in the market.
This unregulated freedom made the Eurodollar system an ideal haven—a place where capital could move freely, unencumbered by the constraints of national borders and domestic monetary policies.
3. The London Advantage: The World’s Financial Hub
London’s role as the birthplace and hub of the Eurodollar market was no coincidence. The city had centuries of experience as a global financial center, connecting Europe, America, and the Commonwealth. By the 1950s, the British government encouraged offshore banking activity to boost its post-war economy and maintain London’s global relevance.
The Bank of England adopted a hands-off approach toward Eurodollar transactions, seeing them as foreign currency operations that did not affect domestic monetary stability. This permissive environment, combined with London’s strategic time zone (bridging Asia and America), created a perfect breeding ground for 24-hour international finance.
As a result, London became the nerve center of global dollar liquidity, with Eurodollar deposits circulating seamlessly between Europe, Asia, and the Americas. By the 1970s, Eurodollar markets had become the cornerstone of global finance—fueling trade, investment, and speculation on an unprecedented scale.
4. The Rise of Global Liquidity and Flexibility
The Eurodollar market’s greatest strength was its ability to provide liquidity when and where it was needed most. Unlike domestic banking systems, which were often constrained by national policies and reserve rules, Eurobanks operated in a borderless environment.
Corporations used Eurodollar loans to fund trade, mergers, and acquisitions, while central banks and sovereign wealth funds used Eurodollar deposits as a store of value. The market also became a vital source of funding for governments, especially developing nations seeking to borrow in dollars without going through the tightly regulated U.S. market.
By the late 1960s, the Eurodollar market had grown into a massive pool of offshore liquidity. When the Bretton Woods system collapsed in 1971 and exchange rates began to float, the Eurodollar market became even more essential. It offered a global mechanism for hedging, borrowing, and investing across currencies—laying the foundation for today’s interconnected financial system.
5. Freedom from Monetary Control
Another key reason the Eurodollar market became a financial haven lies in its freedom from central bank control. In the U.S., the Federal Reserve could regulate domestic money supply, influence interest rates, and impose capital controls. However, it had little jurisdiction over offshore dollar transactions.
This meant that even when the Fed tightened domestic credit conditions, international borrowers could still access dollar liquidity through Eurobanks. In essence, the Eurodollar market allowed global finance to operate independently of U.S. monetary policy.
This autonomy had far-reaching implications. It weakened the effectiveness of national monetary controls and allowed financial institutions to bypass domestic credit restrictions. The result was a truly globalized money market—one that operated beyond the reach of any single government, creating a self-sustaining ecosystem of private credit creation.
6. Innovation and Market Instruments
The Eurodollar market also became a laboratory for financial innovation. As competition intensified, banks developed new instruments to manage risk and enhance returns. These included floating-rate loans, syndicated lending, and short-term Eurodollar certificates of deposit.
The introduction of the London Interbank Offered Rate (LIBOR) in the 1960s provided a standardized benchmark for pricing Eurodollar loans. LIBOR quickly became the most important reference rate in global finance, underpinning trillions of dollars in loans, derivatives, and securities.
These innovations transformed the Eurodollar market into a complex web of interbank relationships and credit channels. It was not just a deposit market—it was a full-fledged financial system operating parallel to, but distinct from, domestic banking systems.
7. Safe Haven for Capital and Sovereigns
For many investors and nations, the Eurodollar market became a safe haven for several reasons:
Currency Stability: The U.S. dollar was (and remains) the world’s most trusted currency. Holding dollar assets offshore allowed investors to preserve value even when local currencies faced inflation or devaluation.
Confidentiality: Offshore banking jurisdictions often offered privacy and discretion, making them attractive to corporations, governments, and wealthy individuals seeking to protect their assets from political risks.
Political Neutrality: During the Cold War and beyond, the Eurodollar market offered a politically neutral ground for transactions between entities that might not otherwise cooperate through U.S.-regulated channels.
Diversification: Holding Eurodollar assets provided global investors with diversification away from domestic financial risks.
These features reinforced the Eurodollar market’s reputation as a financial sanctuary, a place where money could flow freely and securely amid global uncertainty.
8. The Eurodollar Market and Global Financial Power
Over time, the Eurodollar system reshaped the balance of financial power. It gave rise to massive offshore banking networks, enabled shadow banking, and facilitated the globalization of credit.
By the 1980s and 1990s, Eurodollar deposits had become an integral part of international capital markets. They funded corporate expansions, sovereign debt issuance, and speculative investments across continents. Even today, a significant portion of the world’s dollar liquidity exists outside U.S. borders—testament to the enduring legacy of the Eurodollar market.
In essence, the Eurodollar market made the U.S. dollar truly global—not just a national currency, but the lifeblood of international finance. Ironically, while it strengthened the dollar’s dominance, it simultaneously limited America’s ability to control its own currency’s global circulation.
9. Challenges and Risks
While the Eurodollar market offered flexibility and freedom, it also introduced new risks. The absence of regulation meant there was no lender of last resort for Eurobanks. During periods of financial stress, such as the 2008 Global Financial Crisis, the shortage of dollar liquidity in offshore markets amplified global instability.
Moreover, the market’s opacity made it difficult for regulators to monitor systemic risk. Interbank exposures, derivative linkages, and maturity mismatches often went undetected until crises struck. Despite these challenges, the Eurodollar market’s scale and interconnectedness made it impossible to dismantle—it had become too central to the functioning of global finance.
10. The Modern Eurodollar Landscape
Today, the Eurodollar market continues to play a vital role, even as financial technology and regulations evolve. Although LIBOR is being phased out and replaced by alternative benchmarks like SOFR (Secured Overnight Financing Rate), the fundamental dynamics of offshore dollar liquidity remain intact.
From Asian financial hubs like Singapore and Hong Kong to Middle Eastern centers like Dubai, the Eurodollar spirit lives on through global dollar lending and deposit activities. The rise of digital finance and offshore capital markets further extends the reach of the Eurodollar ecosystem—making it an indispensable pillar of the global financial architecture.
Conclusion
The Eurodollar market became a financial haven because it embodied freedom, efficiency, and trust in a world increasingly shaped by regulation and geopolitics. Its unregulated origins offered participants higher yields and greater flexibility, while its global reach turned the U.S. dollar into a universal instrument of trade, investment, and security.
From Cold War strategies to modern financial globalization, the Eurodollar market represents more than just offshore banking—it represents the world’s pursuit of monetary independence beyond political borders.
Even in the 21st century, the Eurodollar system remains the invisible backbone of global liquidity, silently powering international finance. It is both a sanctuary for capital and a mirror of our interconnected economic reality—a financial haven born from innovation, trust, and the unstoppable flow of money across nations.

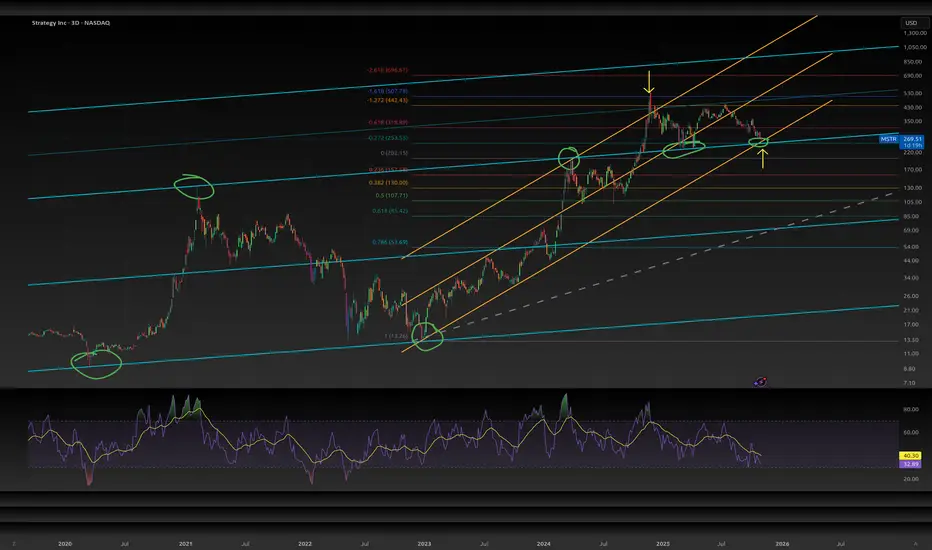
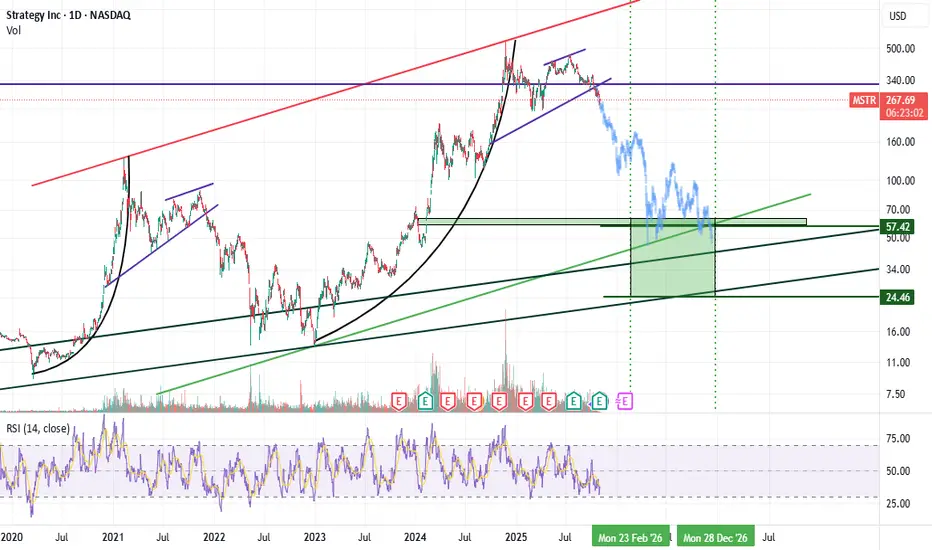
MSTR is on a point of significant confluenceMSTR is on a point of three major confluences. To lose this level would mean we are going much lower. However, I expect at least a significant bounce from here.
we have the blue channel that previously acted as resistance and recently turned into support.
we have the current orange channel
we have the -.272 fib level, after hitting the -1.618 Nov 2024
RSI also looks like a bottoming pattern, but that needs to play out some more to be confident.
I would not be surprised if we retest the underside of the -.618 around $315 in short order. If we lose this level, it could get really nasty to the downside.
S&P 500 Inclusion QuantSignals V3 Screener 2025-11-01S&P 500 Inclusion QuantSignals V3 Screener 2025-11-01
🎯 S&P 500 Inclusion QuantSignals V3 Screener - 2025-11-01
Elite AI-powered S&P 500 inclusion candidate scanner
---
📊 S&P 500 Inclusion Criteria
• Market Cap: $14B+ (current threshold)
• Profitability: 4+ consecutive profitable quarters
• Public Float: 50%+ of shares publicly traded
• Liquidity: Adequate trading volume
• Sector Balance: Committee considers sector weights
🔥 Top Inclusion Candidates
📈 NYSE:BRK.B - Inclusion Score: 53/100
Confidence: 60.0% | Risk: Medium
Market Cap: $47.8B | Profitable Qtrs: 4 | Float: 65%
Days to Rebalance: 60 | Price: $477.54
Key Factors:
• 💰 Well Above Threshold ($47.8B, +15.0 pts)
• ✅ Meets Profitability (4Q, +7.0 pts)
• 🌐 Good Public Float (65%, +6.0 pts)
• 💧 Good Liquidity (1.5M vol, +3.0 pts)
• 📊 Sector Balanced (+0.0%, +2.0 pts)
📈 NYSE:TSM - Inclusion Score: 47/100
Confidence: 60.0% | Risk: Medium
Market Cap: $30.0B | Profitable Qtrs: 4 | Float: 65%
Days to Rebalance: 60 | Price: $300.43
Key Factors:
• 💰 Well Above Threshold ($30.0B, +15.0 pts)
• ✅ Meets Profitability (4Q, +7.0 pts)
• 🌐 Good Public Float (65%, +6.0 pts)
• 💧 Good Liquidity (1.5M vol, +3.0 pts)
• 📊 Sector Balanced (+0.0%, +2.0 pts)
📈 NYSE:SPOT - Inclusion Score: 44/100
Confidence: 45.0% | Risk: Medium
Market Cap: $65.5B | Profitable Qtrs: 4 | Float: 65%
Days to Rebalance: 60 | Price: $655.32
Key Factors:
• 💰 Well Above Threshold ($65.5B, +15.0 pts)
• ✅ Meets Profitability (4Q, +7.0 pts)
• 🌐 Good Public Float (65%, +6.0 pts)
• 💧 Good Liquidity (1.5M vol, +3.0 pts)
• 📊 Sector Balanced (+0.0%, +2.0 pts)
📈 NYSE:BABA - Inclusion Score: 40/100
Confidence: 45.0% | Risk: Medium
Market Cap: $17.0B | Profitable Qtrs: 4 | Float: 65%
Days to Rebalance: 60 | Price: $170.43
Key Factors:
• 💵 Meets Threshold ($17.0B, +8.0 pts)
• ✅ Meets Profitability
Image
(4Q, +7.0 pts)
• 🌐 Good Public Float (65%, +6.0 pts)
• 💧 Good Liquidity (1.5M vol, +3.0 pts)
• 📊 Sector Balanced (+0.0%, +2.0 pts)
Conflicts:
• ⚠️ High volatility (53%)
📈 NASDAQ:MSTR - Inclusion Score: 30/100
Confidence: 45.0% | Risk: Medium
Market Cap: $27.0B | Profitable Qtrs: 4 | Float: 65%
Days to Rebalance: 60 | Price: $269.51
Key Factors:
• 💰 Strong Market Cap ($27.0B, +12.0 pts)
• ✅ Meets Profitability (4Q, +7.0 pts)
• 🌐 Good Public Float (65%, +6.0 pts)
• 💧 Good Liquidity (1.5M vol, +3.0 pts)
• 📊 Sector Balanced (+0.0%, +2.0 pts)
Conflicts:
• ⚠️ Weak price action (-30.8%)
• ⚠️ High volatility (56%)
• ⚠️ CONFLICT: Recent price collapse (-25.1%, -10 pts)
---
💡 S&P 500 Inclusion Impact
• Passive Inflows: $12-15T tracks S&P 500, forces systematic buying
• Average Pop: 5-8% on announcement day
• Sustained Premium: Inclusion often creates lasting demand
• Index Rebalancing: Quarterly reviews create windows of opportunity
⚠️ Risk Management
• Inclusion is not guaranteed - these are probabilistic candidates
• Committee decisions can be unpredictable
• Use proper position sizing (max 2-5% per position)
• Set stop losses 10-15% below entry
💡 Remember: Buy the rumor, sell the news. Consider taking profits post-announcement.

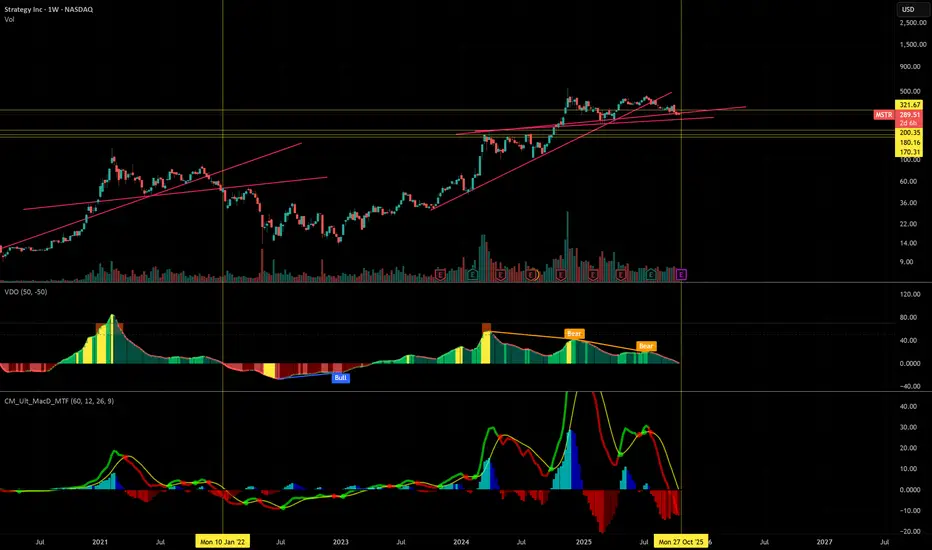
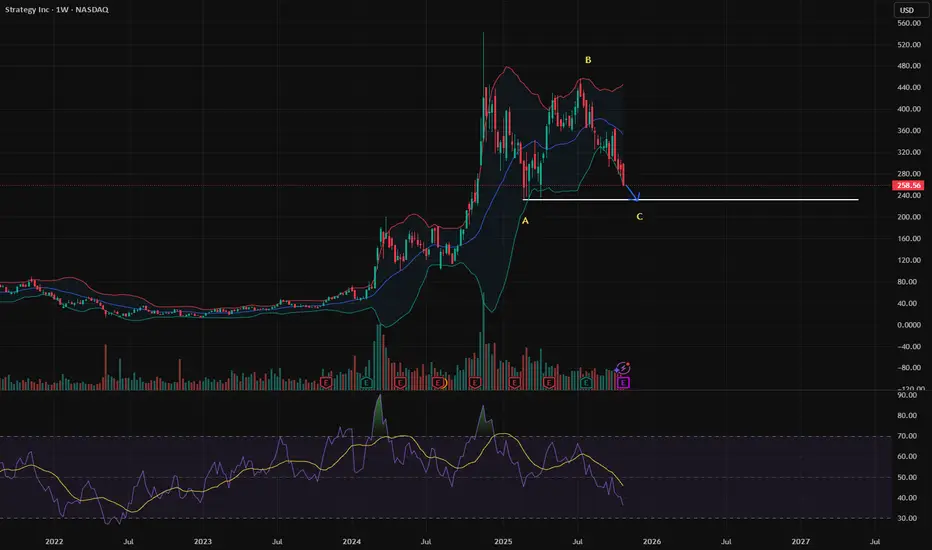
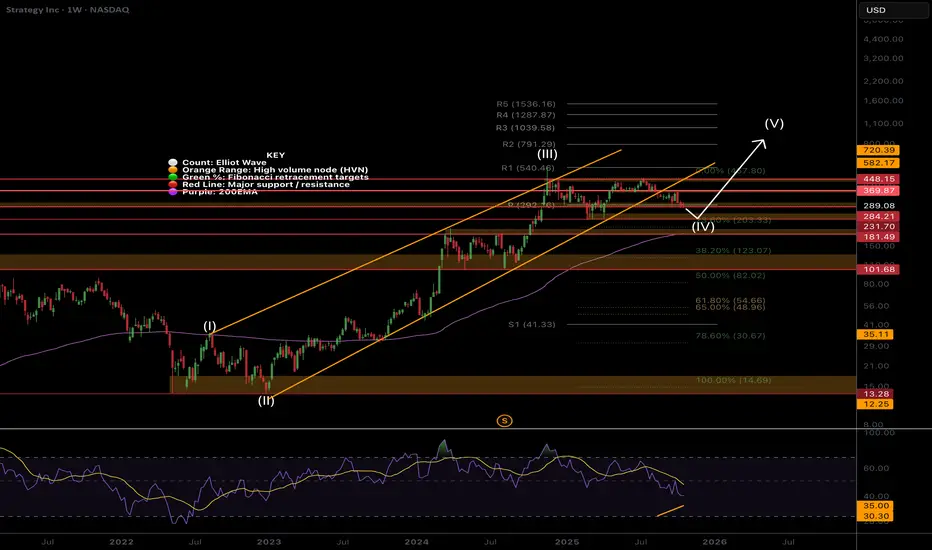
MSTR weekly bull divergence on low sentimentSentiment is low, the asset is hated and misunderstood by TradFi and retail. It’s a recipe for a bottom!
Price is still in a wave (IV) which are expected to be long and drawn out, driving investors into shallow capitulation through boredom into patient hands. I don’t expect wave (V) to kick in until Bitcoin moves. Wave (V) has an expected target of the R3 daily pivot at $1039 but will overextend if Bitcoin does.
Price has fallen out of the lower channel boundary and sitting below the weekly pivot, still above the weekly 200EMA so the outlook is bullish. Wave (4) may complete at the 0.236 Fibonacci retracement at $230. For now I am waiting to see what happens before entering. Good opportunities are setting up.
🎯 Terminal target for the business cycle could see prices as high as $1000 based on Fibonacci extensions
📈 Weekly RSI has bullish divergence
👉 Analysis is invalidated if we close back below $82
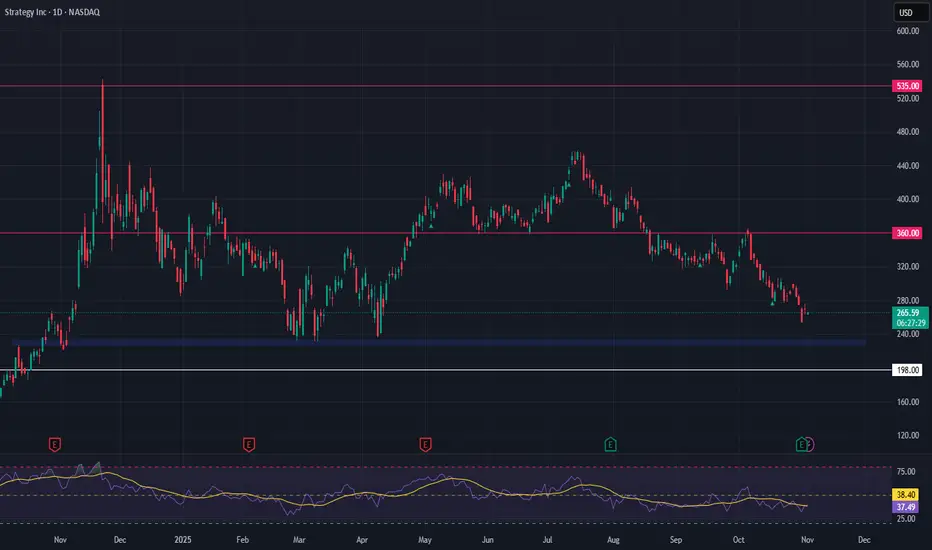
Strategy Inc (MSTR) – High-Beta Bitcoin Proxy at Key SupportStrategy Inc NASDAQ:MSTR has delivered another strong quarterly report, underscoring its continued commitment to aggressive Bitcoin accumulation. With over 158,000 BTC on the books, MSTR has firmly positioned itself as a leveraged proxy for Bitcoin, offering equity traders indirect crypto exposure. This bold balance sheet strategy has also pushed MSTR into alignment with S&P 500 inclusion criteria — a potential catalyst if index inclusion materializes.
Technically, the stock is now retesting a key support zone between $228 and $233. This level has historically held well and may offer a high-conviction entry for those anticipating a BTC rebound. Should Bitcoin aim for new highs, MSTR could respond with outsized upside, though traders must account for the volatility and downside risks that come with crypto-correlated equities.
🎯 Trade Setup:
Entry Zone: $228 – $233
Take Profit Targets: $360 and $535
Stop Loss: $198
This setup offers a high-risk, high-reward opportunity. As always, manage position size carefully and watch BTC price action for confirmation.
$MSTR: Monthly down trend...GM lads, looks like we have a fully confirmed monthly down trend in $MSTR...this likely is bad news for all of crypto.
Stay safe out there...
Cheers,
Ivan Labrie.

$MSTR still bullish at supportstrategy has lately been underperforming compared with simular assets. It's stuck in this arc and the diagonal line. When it finds support and breaks the arc you will teleport to the next arc. This gets invalidated when breaking to the downside!

MSTR - How to profit from a $140 short target🔱 The MS ponzi is taking its toll. 🔱
I’m not laughing, because it’s genuinely unfortunate for everyone who believed in this scam.
But today, I don’t want to rant about that.
I want to show how one could profit from a potential drop of more than $100.
As an Andrews Pitchfork trader, I know there’s roughly an 80% chance that price will reach the centerline. From there, price either reverses in the opposite direction or breaks through the centerline to continue its journey.
That’s exactly what happened with MSTR.
You can see how the price first reached the centerline, held there a few times, and then broke it. Since then, it’s been following the rulebook by moving further to the downside.
Now, there’s another rule worth remembering:
price often tests or retests the line it just broke.
In our case, that line is the centerline.
This means we could be lucky enough to get a pullback to the centerline, and that would be a good level to consider shorting.
The target is usually the opposite line of the centerline, which in our case is the L-MLH (Lower Median Line Parallel).
👉 If you want to learn the full framework and its rules, check the links for free material.
I hope this helps many of you, and I wish you all good profits.

Measured Move to $1,100+The price had broken the channel twice in almost three years. November 2024 say a break up and out and the price has currently broken down and out, but still within the bullish wedge.
If the price were to break down and out of the wedge after breaking below the channel, that would likely trigger a a further decline in price.
If the price climbs back into the channel and tracks a bitcoin breakout, the measured move is above $1,000 sometime in Q1/Q2 2026.

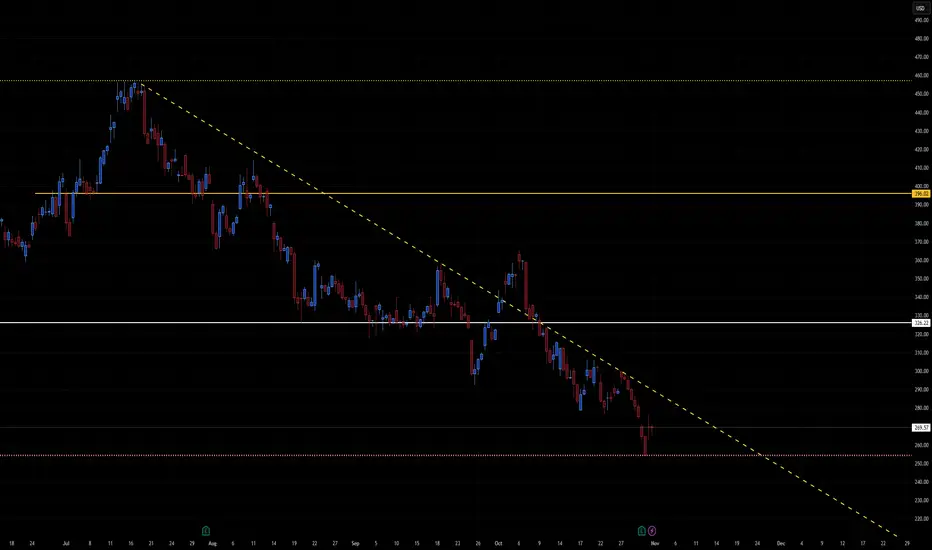
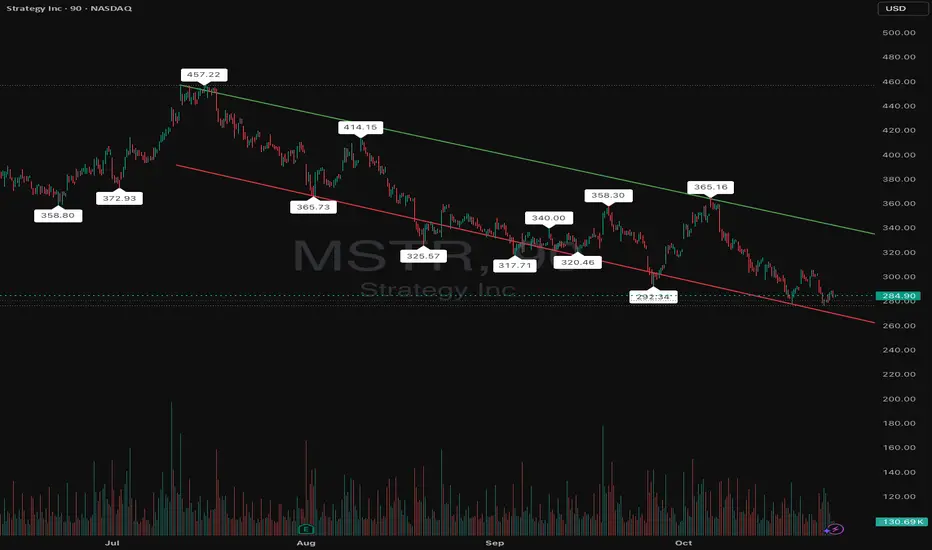
MSTR clear trendline well behaved chartA long-term descending trendline (yellow dashed line) acting as dynamic resistance since July highs.
Major horizontal support around 265 USD (recent low and yellow dotted line).
Resistance levels near 325 USD and 395–400 USD.
Overall pattern: extended downtrend with lower highs and lower lows, but price nearing a strong confluence zone (trendline + horizontal support).
This setup suggests MSTR is in a make-or-break area — either a short-term reversal bounce or continuation to new lows.
📈 Bullish Scenario
Setup:
Price has reached oversold levels near 265, aligning with historical support. A technical bounce is possible if Bitcoin stabilizes or rallies, given MSTR’s correlation.
Confirmation Triggers:
Close above 280–285 USD (short-term confirmation).
Break and close above descending trendline (~295–300).
Short-Term Targets:
325 USD — former support turned resistance.
395–400 USD — key horizontal level and top of prior range.
Bullish Catalysts:
Bitcoin recovery or strength toward $70K+.
Institutional or ETF-related flows benefiting BTC proxies.
Technical short-covering rally.
Invalidation:
Daily close below 260 USD with strong volume.
Probability: Moderate (~40%), as reversal setups often require confirmation after long downtrends.
📉 Bearish Scenario
Setup:
Price continues to respect descending resistance and fails to reclaim 285–295 zone, maintaining downward momentum.
Confirmation Triggers:
Breakdown below 265 USD support.
Expansion in sell volume below that level.
Short-Term Targets:
250–255 USD → minor horizontal level (recent pivot area).
230–235 USD → next structural support.
210–215 USD → measured move from current descending channel.
Bearish Catalysts:
Bitcoin correction below $65K.
Continued macro tightening or risk-off environment.
Market rejection of BTC-linked equities.
Invalidation:
Breakout above 300 USD with sustained buying pressure.
Probability: Slightly higher (~60%) as trend remains clearly bearish.
⚖️ Neutral / Accumulation View
If MSTR remains range-bound between 265 and 300, this indicates accumulation before next major move.
Expect choppy price action with short squeezes and weak rallies until a breakout direction emerges.
🧩 Summary Table
Bias Confirmation Target Zone Invalidation Notes
Bullish Close > 300 325 → 395 <260 Trendline breakout
Bearish Close < 265 250 → 230 >300 Trend continuation
Neutral Range 265–300 — — Sideways accumulation
🕒 2–3 Week Projection
Bullish path: Bounce from 265 → breakout above 300 → target 325–330 by mid-November.
Bearish path: Fail at 285–295 → breakdown below 265 → slide to 235 by mid/late November.
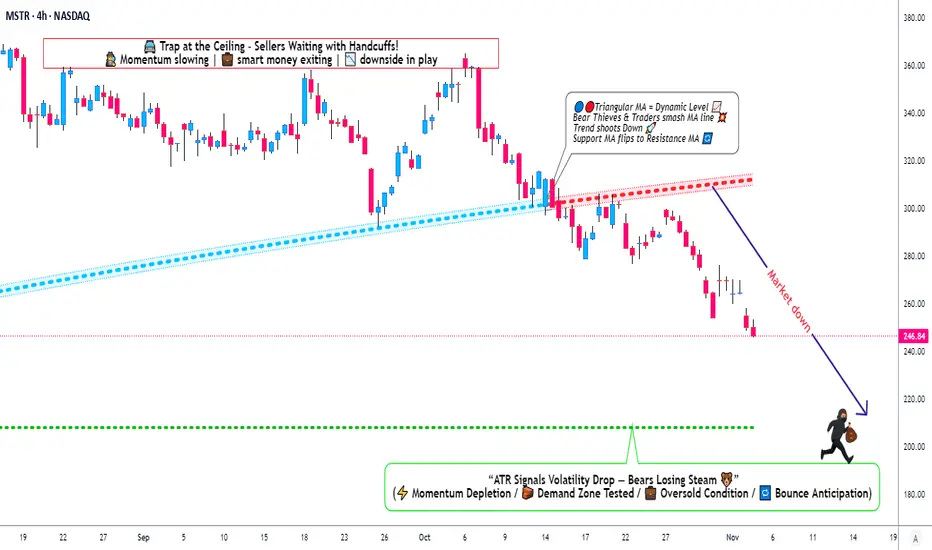
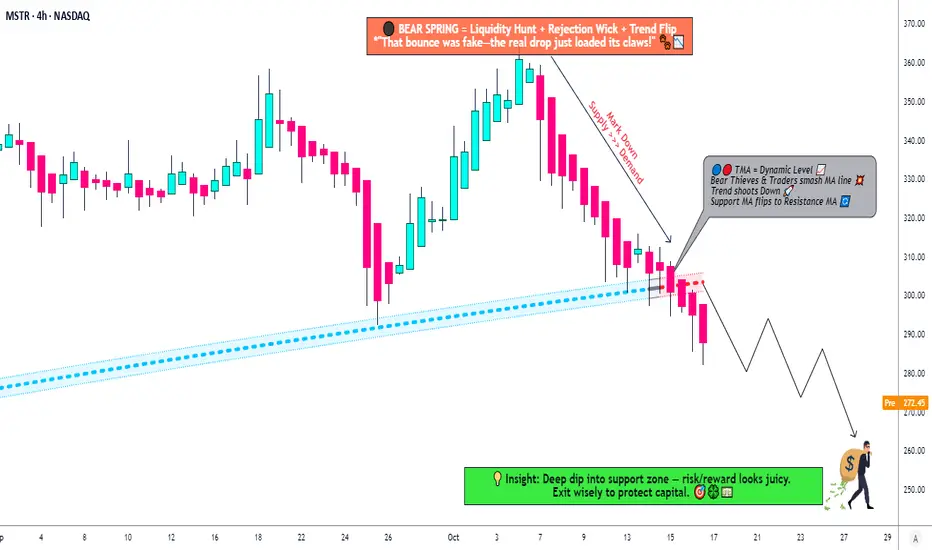
MicroStrategy Under Pressure: Bearish Playbook in Action🎯 MSTR: The "Thief's Playbook" - Strategic Bear Trap Setup! 💰🔥
📊 Asset Overview
MicroStrategy Inc. (MSTR) - Bitcoin's Proxy Play in the Stock Market
🎭 The Setup: When Bears Come to Party
Alright folks, gather 'round! We've got ourselves a textbook triangular moving average breakdown on MSTR that's screaming "short opportunity" louder than my portfolio after a bad trade week! 😅
Current Market Sentiment: 🐻 BEARISH CONFIRMED
The technicals are aligning like planets before a lunar eclipse - and trust me, this eclipse might cast some shadows on those long positions!
🎯 The "Thief Strategy" Game Plan
🚪 Entry Zones - The Layering Approach
Here's where it gets spicy! 🌶️ Instead of going all-in like a degen at a casino, we're using the "Thief Layering Method" - multiple limit sell orders to scale into this position:
Suggested Entry Layers:
🥇 Layer 1: $300
🥈 Layer 2: $290
🥉 Layer 3: $280
💎 Layer 4: $270
🔥 Layer 5: $260
Pro Tip: You can add MORE layers based on your risk appetite and account size. More layers = Better average entry = Smoother sleep at night! 😴
🛡️ Risk Management - The "Oh Sh*t" Line
Stop Loss: 🚨 $320
⚠️ IMPORTANT NOTICE: Dear Thief OGs, Ladies & Gentlemen! This SL is MY line in the sand. YOU need to decide YOUR own risk tolerance. Trade at your own risk, manage your own money, and don't blame me if things go sideways! This ain't financial advice - it's entertainment with charts! 🎪
🎁 Target Zone - Where We Cash Out
Take Profit Target: 🎯 $210
Why $210?
💪 Strong historical support level
📉 Oversold territory expected
Classic bull trap zone where longs get liquidated
⚠️ ANOTHER IMPORTANT NOTICE: Thief OGs! This is MY target. You do YOU! If you see profits earlier and want to secure the bag - DO IT! Don't be greedy. Take profits when YOU feel comfortable. Your account, your rules, your responsibility! 💼
🔗 Related Assets to Watch - The Correlation Game
Keep your eyes on these bad boys for confirmation:
📈 Direct Correlations:
NASDAQ:MARA (Marathon Digital) - Bitcoin miner, moves with crypto sentiment
NASDAQ:RIOT (Riot Platforms) - Another BTC miner, similar volatility pattern
NASDAQ:COIN (Coinbase) - Crypto exchange, sentiment indicator
CRYPTOCAP:BTC (Bitcoin spot) - The godfather! MSTR holds massive BTC, direct correlation
🧠 Key Points:
MSTR trades with ~1.5x-2x Bitcoin beta (more volatile than BTC itself)
When Bitcoin dumps, MSTR often dumps HARDER 📉
Watch BTC support at $60K - if it breaks, MSTR likely follows to our target zone
Tech sector weakness ( NASDAQ:QQQ , AMEX:SPY ) adds bearish pressure
⚡ Trading Psychology - The "Thief Mindset"
Look, this setup requires PATIENCE! 🧘♂️ Don't FOMO in at market price. Layer in like a professional thief planning a heist - calculated, methodical, strategic! This isn't gambling; it's probability management with a side of humor! 😎
🎪 Final Word from Your Friendly Neighborhood Chart Thief
Remember: Markets are wild, unpredictable, and don't care about your feelings OR your bills! This analysis is for educational and entertainment purposes ONLY. The "Thief Strategy" is MY trading style - it's risky, it's aggressive, and it's definitely NOT for everyone!
Do your own research. Manage your own risk. Trade what you can afford to lose. And for the love of all that's holy, don't mortgage your house based on some random internet chart analysis! 🏠❌
✨ If you find value in my analysis, a 👍 and 🚀 boost is much appreciated — it helps me share more setups with the community!
🏷️ #MSTR #MicroStrategy #ShortSetup #BearishBreakdown #SwingTrade #DayTrade #ThiefStrategy #BitcoinStocks #TechnicalAnalysis #MovingAverageCrossover #LayeringStrategy #RiskManagement #StockMarket #TradingIdeas #BTC #CryptoStocks #BearTrap #SupportAndResistance #ChartAnalysis #TradeSmart
🎯 Trade smart, layer in, manage risk, and may the profits be ever in your favor! 💰🚀
Strategy Inc. (MSTR)The stock is tied to the performance of Bitcoin, however, there seems to be a significant divergence in recent months. Handle with care.

Trade Alert: $MSTR NOV 28 2025 $270 CALLS – +118% Profit TargetEnter: NASDAQ:MSTR Calls
Strike Price: $270
Expiry Date: NOV 28 2025
Buy in Price: $17.53 - $18.95
Sell Price: $38.22
Profit : +118% (Turn every $1 into $2.18)
Want Profitable Real-Time Options Alerts?

MSTR bearish , going way downBTC cycle is over or almost over - may not get the blow off top everyone is expecting. If that is the case MSTR will go to min 50-60 area if not lower.
$MSTR: ABC correction targeting $230 range.NASDAQ:MSTR : this A-B-C correction is on its last leg. However, Elliot Wave theory suggests C wave usually finishes beyond A wave, which would take NASDAQ:MSTR to $230 range.
MSTR: Time to Short? Death Cross + Triangle Break Analysis🐻 MSTR "STRATEGY INC." - The Bear's Playground | Thief's Multi-Layer Setup 💰
📊 MARKET SNAPSHOT
Asset: NASDAQ:MSTR (Strategy Inc. - formerly MicroStrategy)
Current Price: ~$291.23 (Oct 17, 2025)
Setup Type: Swing/Day Trade - Bearish Confirmation
Strategy Style: "Thief Method" - Layered Limit Orders 🎯
🔍 THE SETUP - Why This Bearish Play Makes Sense
Ladies and Gentlemen, welcome to the Thief's playbook! 👋 MSTR just gave us a beautiful bearish signal with a triangular moving average breakdown. Here's what the charts are screaming:
🎯 The "Thief" Entry Strategy - Layered Limit Orders
This isn't your typical "buy now" play. We're sneaking in like a thief in the night with MULTIPLE SELL LIMIT LAYERS:
Entry Zones (Layer Your Shorts):
Layer 1: $310 (First resistance retest)
Layer 2: $300 (Psychological level)
Layer 3: $290 (Current consolidation zone)
💡 Pro Tip: Scale into your position! You can add MORE layers based on your risk tolerance (e.g., $305, $295, $285). The "Thief Method" is all about spreading your entries to catch the perfect price zones.
🛑 RISK MANAGEMENT - The Thief's Insurance Policy
Stop Loss: $320 🚨
(This is the Thief's emergency exit - if price breaks above this, the bears lost control)
⚠️ IMPORTANT NOTE:
Dear Thief OG's (Original Gangsters), this is MY stop loss level based on MY analysis. You should set YOUR OWN stop loss based on YOUR risk tolerance. Don't copy blindly - manage YOUR money, take YOUR profits (or losses) at YOUR own risk! This is YOUR trade, not mine. 💯
🎯 PROFIT TARGET - Where the Money's Hiding
Primary Target: $250 🎉
Why $250?
Strong historical support level
Oversold bounce zone (RSI typically rebounds here)
TRAP ALERT: Institutional buyers often accumulate at this level - be ready to ESCAPE with your profits before the bulls wake up! 🐂💤
⚠️ TAKE PROFIT NOTE:
Dear Thief OG's, $250 is MY target based on MY analysis. You can (and should) set YOUR own targets. If you're in profit at $270, $260, or even $280 - TAKE THE MONEY AND RUN! 💰 No shame in banking profits early. Remember: pigs get fat, hogs get slaughtered. This is YOUR trade, YOUR risk, YOUR decision!
🔗 RELATED ASSETS TO WATCH - The Correlation Game
MSTR doesn't trade in a vacuum! Keep your eyes on these correlated assets:
📈 Primary Correlation:
CRYPTOCAP:BTC (Bitcoin): ~$108,625 (Oct 17, 2025) - MSTR holds 640,000+ BTC (3%+ of total supply!)
Correlation Strength: 🔥🔥🔥🔥🔥 ULTRA HIGH
Why It Matters: MSTR is essentially a leveraged Bitcoin play. When BTC sneezes, MSTR catches a cold. Bitcoin's current bearish pressure directly impacts MSTR's valuation.
🔄 Secondary Watchlist:
NASDAQ:COIN (Coinbase): Crypto exchange - sentiment indicator
NASDAQ:RIOT (Riot Platforms): Bitcoin mining stock
NASDAQ:MARA (Marathon Digital): Another BTC-related equity
NASDAQ:CLSK (CleanSpark): Bitcoin mining operations
Key Point: If Bitcoin breaks below $105K support, expect MSTR to accelerate downward. Conversely, if BTC rallies back above $115K, this bearish setup could invalidate. Watch Bitcoin like a hawk! 🦅
📊 THE BIGGER PICTURE - Why MSTR Is Vulnerable Right Now
Bitcoin Pressure: BTC down -2.19% today, testing critical support levels
Institutional Caution: Recent S&P 500 rejection (not included in index) = credibility questions
Valuation Concerns: Trading at significant premium to NAV (Net Asset Value)
Technical Breakdown: Multiple MA crosses + trend reversal signals
Macro Headwinds: Risk-off sentiment in crypto markets (3-day consecutive decline)
🎓 THE THIEF'S WISDOM - Final Thoughts
This setup combines:
✅ Technical confirmation (MA breakout)
✅ Layered entry strategy (better average price)
✅ Clear risk management (defined stop loss)
✅ Realistic profit targets (strong support zone)
✅ Correlated asset monitoring (BTC relationship)
Remember: The market doesn't care about your opinion. Respect the charts, manage your risk, and don't get greedy. The "Thief Method" is about stealing profits intelligently, not gambling recklessly! 🎰❌
💬 TRADE SMART, NOT HARD!
This is a BEARISH SETUP with defined entries, exits, and risk parameters. Whether you're swing trading or day trading, the key is DISCIPLINE. Stick to your plan, don't chase, and protect your capital.
Questions? Thoughts? Drop them below! 👇
Let's build a community of smart traders who help each other win! 🤝
✨ If you find value in my analysis, a 👍 and 🚀 boost is much appreciated — it helps me share more setups with the community!
#MSTR #Bitcoin #BTC #TradingView #SwingTrading #DayTrading #BearishSetup #ShortSetup #CryptoStocks #TechnicalAnalysis #MovingAverages #LayeredEntry #RiskManagement #ProfitTarget #StrategyInc #MicroStrategy #ThiefMethod #TradingStrategy #StockMarket #NASDAQ
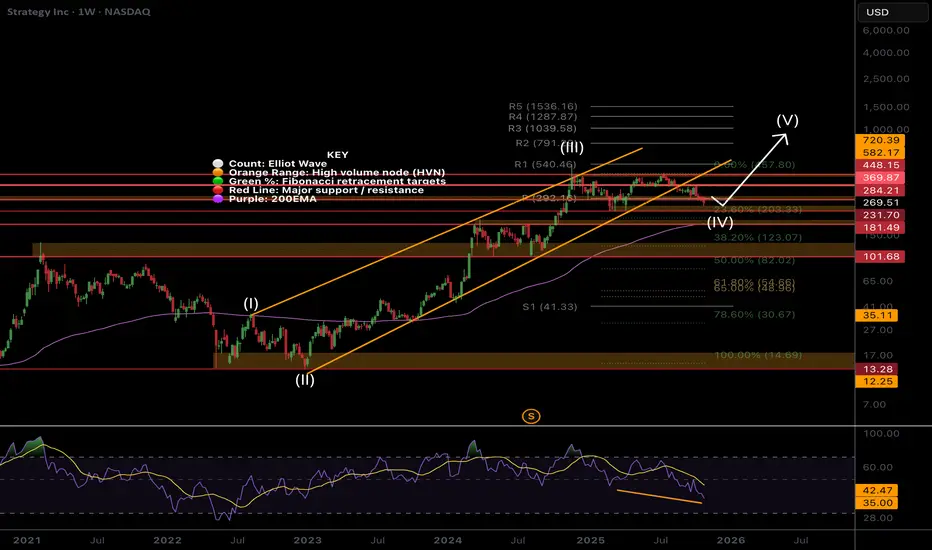
MSTR still in wave 4 rangeNASDAQ:MSTR Price is still in a wave (IV) which are expected to be long and drawn out, yet shallow which is what we have here. I don’t expect wave (V) to kick in until Bitcoin moves. Wave (V) has an expected of the R3 daily pivot at $1039 but will overextend if Bitcoin does.
Price has fallen out of the lower channel boundary and sitting at the weekly pivot, still above the weekly 200EMA so the outlook us bullish. wave (4) may complete at the 0.236 Fibonacci retracement at $203. For now I am waiting to see what happens before entering but believe good opportunities are setting up.
Safe trading
MicroStrategyBitcoin.
Still lots of downside left on the table for Saylor's MicroStrategy.
More time required before any type of lower risk entry point morphs into existence.

Will Microstrategy $MSTR follow the 2021 cycle?
Top was around the most greedy time in the market per Election '24. As bitcoin put in new all time highs MSTR continued lower highs, just like in '21. Last line of support around $230, it should continue putting in lower highs as the cycle comes to an end.
$MSTR - Consolidating at Lower Trendline — Decision Zone AheadMSTR (MicroStrategy Inc.) is trading within a well-defined descending channel that has persisted since July. The stock continues to make lower highs and lower lows, reflecting a strong bearish trend. It is currently testing the lower channel support around the $284–$285 area, a zone that has previously triggered short-term rebounds. If MSTR can hold this level and reclaim $300, a potential bounce toward the mid-channel region around $320–$340 could follow. However, a breakdown below $280 may signal further downside toward $265 or even $250. Overall, the stock is at a critical inflection point where traders are watching to see whether the support holds or the downtrend resumes.
Bullish Scenario (Countertrend play):
Entry near $285 with tight stop below $275 -Target $320–$340
Bearish Scenario (Trend continuation):
Wait for breakdown below $280.
Target $265 then $250 -Stop above $300
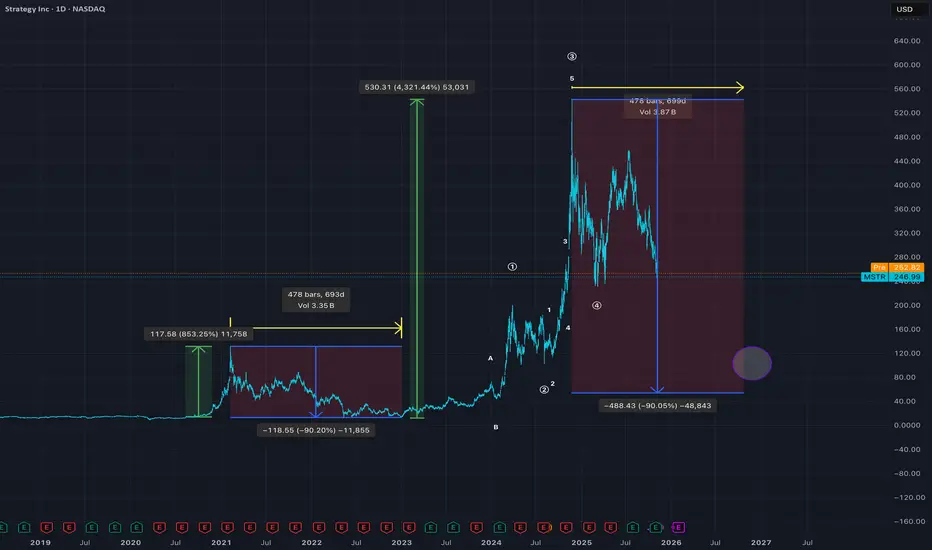
If this looks bullish.. you got another thing coming History doesn't repeat itself, but it often rhymes. So far 1:1.
I reckon the next 356 days will test out Saylors holders