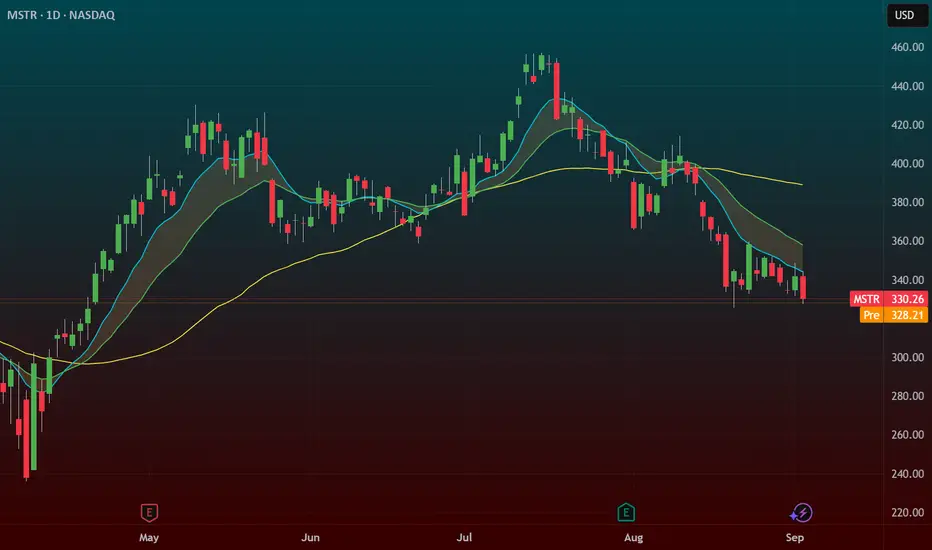
MSTR 1D Time frameMarket Snapshot
Current Price: ~$328.50
Daily Change: -0.4% (approx)
Technical Overview
Indicators & Momentum
RSI (14-day): ~40 → Neutral, slightly below the midpoint—no major squeeze yet.
MACD: Negative (~–1.6) → Weak bearish momentum.
Stochastic Oscillator: Around 31 → Neutral to slightly oversold.
Stochastic RSI: Overbought zone → Possible short-term exhaustion.
Williams %R: ~–39 → Suggests room for both upside and downside.
ADX: ~18–26 → Indicates a weak to moderate trend—market lacks strong direction.
Moving Averages
Short-term moving averages (like 5-day and 10-day) show buy signals, while broader averages—including the 20-day, 50-day, 100-day, and 200-day—are all negative, suggesting broader downward pressure.
Support & Resistance
Based on various pivot point analyses:
Immediate Support: ~$324–325
Near-term Support Zone: ~$320
Immediate Resistance: ~$332–334
Further Resistance: ~$340–345
Broader Technical & Market Context
Downtrend in Play: The stock has declined nearly 40% from its July highs and is approaching its lowest levels since April.
Death Cross Forming: The 50-day moving average is nearing a bearish crossover below the 200-day average.
Diving Technical Ratings: Most moving averages and oscillators point to a negative bias—short-term signals are weak, and longs are retreating.
Bullish Divergence? Some chart setups hint at a potential wedge or triangle pattern with possible bullish divergence, but these are speculative and not yet confirmed.
MicroStrategy remains under pressure, with indicators pointing overwhelmingly to neutral or bearish signals. While short-term moving averages show minor support, the broader technical picture remains weak—and a breakout above ~$334 would be needed to suggest a reversal.
STRK trade ideas

Do or Die - Q4 EditionNot stirring controversy with this take.
Higher in Q4 followed by a year-long bear market.
Using Fibonacci extensions from last cycle's top & bottom to hit a maximum of a 1.618 target by EOY.
Open to the possibility of price targets from most recent ATH ($550) and up to the 1.618 fib level.
This calls for aggressive appreciation within the next 3.5 months.
Price targets will be invalidated by immediate downward move or sideways chop, with the latter scenario resulting in a lower price target.
Stated differently, price needs significant upward volatility by the end of September/early October this forecast will not play out
Either scenario, this is nearly the end before the an imminent correction lasting a year or more.
I predict the next bear market for MSTR will be aggressive, with BTC price likely to fall beneath the Strategy's bitcoin dollar-cost-average of $73k as of 9/8/25.
MSTR — Triangle Setup Before Crypto SeasonMSTR is sitting on the third touch of its weekly triangle support, a spot that often sparks momentum shifts. On the daily, price is moving within a wedge-like structure while showing bullish divergence on both the daily and 4H charts, signaling buyers may be stepping in. With trendlines holding and crypto seasonality approaching — typically a strong period for Bitcoin-related assets — this setup looks primed for a potential move back toward the top of the triangle, with any break and retest opening room for expansion.
Not financial advice, just how I see it.
MSTR Options Flow Screams Bullish — Can $345C Print This Week?
# ⚡ MSTR Weekly Trade Setup (2025-09-07)
**Bias:** 🎯 Mixed → speculative bullish bounce
**Conviction:** ⭐⭐⭐ (60%)
---
### 📊 Key Takeaways
* ✅ **Options flow:** Strongly bullish (C/P = 2.21)
* ❌ **Trend:** Still bearish (-16.45% monthly, RSI weak)
* ⚠️ **Volume:** Flat (1.0x avg) → no institutional conviction
* 🌐 **Volatility:** Low (VIX \~15) → cheap calls
* 🧱 **OI Walls:** \$340C & \$345C = resistance / gamma levels
---
### 🎯 Trade Plan (Speculative Play)
* **Instrument:** \ NASDAQ:MSTR
* **Direction:** CALL (naked)
* **Strike:** \$345.00
* **Expiry:** 2025-09-12 (weekly)
* **Entry Price:** \$8.60 (ask)
* **Profit Target:** \$12.90 (≈1.5×)
* **Stop Loss:** \$5.59 (\~35% risk)
* **Size:** 1 contract (small, punt-sized)
* **Entry Timing:** Open (prefer limit near ask)
---
### 🧠 Rationale
* Flow is unambiguously bullish, but **price trend & RSI weak** → treat as a bounce, not reversal.
* \$345C offers liquidity (OI 14,439) + better risk balance than \$340C.
* 5 DTE = **theta risk**, so trade is **binary/speculative**.
---
### ⚠️ Key Risks
* 📉 Trend is down → bounce may fail quickly.
* ⏳ Time decay fast with only 5 DTE.
* 🧱 Gamma/OI walls may cap upside near \$345.
* 📰 Macro/news can swamp bullish flow.
---
## 📌 TRADE DETAILS (JSON)
```json
{
"instrument": "MSTR",
"direction": "call",
"strike": 345.0,
"expiry": "2025-09-12",
"confidence": 0.60,
"profit_target": 12.90,
"stop_loss": 5.59,
"size": 1,
"entry_price": 8.60,
"entry_timing": "open",
"signal_publish_time": "2025-09-07 07:45:34 EDT"
}
```
---
🔥 **Summary:**
This is a **flow-driven speculative call punt** — risk small, size small, exit fast.
If flow + price action confirm, \ NASDAQ:MSTR \$345C has upside.
If not → cut quick.
$MSTR Swing Trade Setup: Layered Short Entries on Breakout📉 MSTR "STRATEGY INC" STOCK – Bearish Thief Plan (Swing/Scalp Setup)
⚡ Trade Setup (Bearish Pending Order Plan)
Asset: NASDAQ:MSTR (MicroStrategy Inc.)
Plan: Bearish (waiting for support breakout confirmation).
Entry Zone:
Pending breakout entry @ 320.00 ⚡
Layered “Thief” Strategy (scaling entries):
Sell Limit Layers: 340.00 / 330.00 / 320.00
You may add or adjust layers based on your own risk tolerance.
🔔 Set TradingView alerts at breakout levels to track price action.
Stop Loss (Thief Style):
Protective SL @ 360.00 (after breakout confirmation).
Adjust per your strategy & risk management.
Target Zone (Exit):
Police barricade support @ 290.00
Note: Take profit is discretionary — escape with profits at your own chosen level 🚪💰.
🔑 Why This Plan? (Thief Strategy Context)
The Thief Plan = using multiple layered limit entries after a breakout for better risk/reward.
Scaling entries gives flexibility while reducing FOMO and chasing.
Exit early at support barricades or oversold traps.
📊 MicroStrategy (MSTR) Market Data Report
As of September 7, 2025
1. Retail & Institutional Sentiment 🤝
Retail: Mixed / cautious (crypto exposure volatility).
Institutional: Neutral → slightly bearish (Bitcoin correlation + regulatory risk).
Estimated Sentiment: 55% Neutral / 30% Bearish / 15% Bullish.
2. Fear & Greed Index 😨😋
Current level: Neutral ~50/100
Suggests balanced emotions → no extreme greed or fear.
3. Fundamental & Macro Scores 📈📉
Fundamental ~60/100: MSTR tied to Bitcoin trends, highly volatile.
Macro ~55/100: Pressures include crypto regulation, tech volatility, interest rates.
Bitcoin remains the key driver.
4. Market Outlook 🐂🐻
Bull Case: BTC rally → MSTR boost, institutional adoption helps.
Bear Case: Regulatory clampdowns, BTC volatility → downside pressure.
Overall: Neutral → Slightly Bearish (short-term caution).
🚀 Key Takeaways
NASDAQ:MSTR moves in sync with Bitcoin → monitor BTC charts closely.
Sentiment is not strongly bullish → short setups have edge here.
Thief layering strategy aligns with volatility.
Always respect SL & manage risk 🔐.
🔗 Related Pairs to Watch
BITSTAMP:BTCUSD
NASDAQ:COIN (Coinbase)
NASDAQ:RIOT (Riot Platforms)
NASDAQ:MARA (Marathon Digital)
SP:SPX / NASDAQ:NDX (macro impact on tech/crypto plays)
✨ “If you find value in my analysis, a 👍 and 🚀 boost is much appreciated — it helps me share more setups with the community!”
#MSTR #MicroStrategy #Stocks #SwingTrade #Scalping #BearishSetup #CryptoStocks #LayeredStrategy #ThiefPlan #BitcoinCorrelation #TradingViewIdea

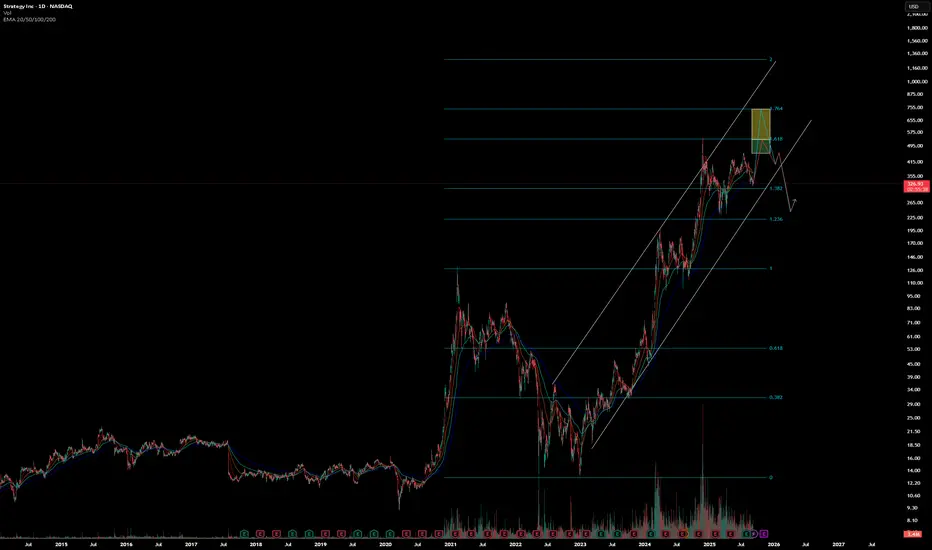
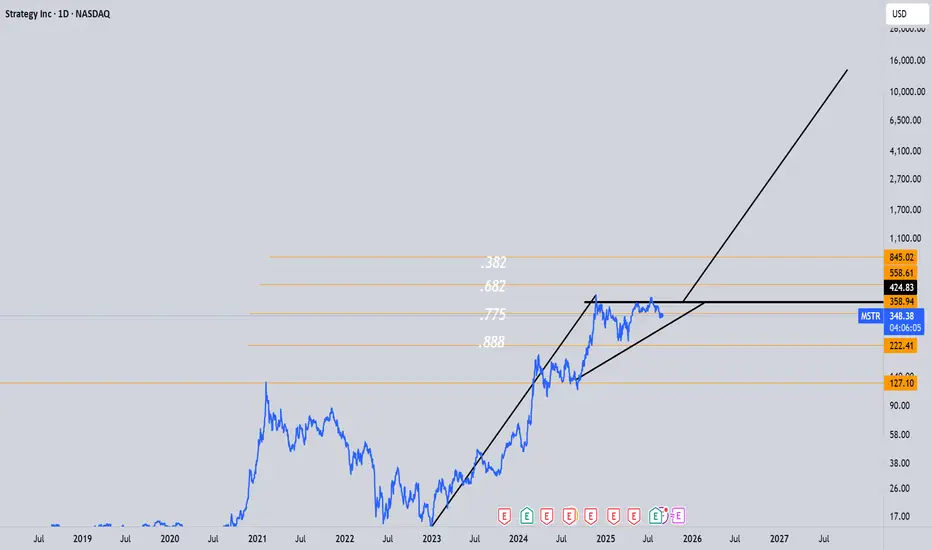
MSTR - $300 > $850Howdy ho! I hope everyone is well. I'm going to put my best foot forward for my expectations for MSTR. Everyone was probably let down by the lack of inclusion in the S&P, on Friday. But that's OK! Hopefully this chart will help you with overall direction for MSTR.
So what do we have?
A validated fib (it's validated because it is anchored on the trendline and the previous extension gave us an absolutely perfect target at the high in 2024 at the 2.618. I will post this, below.
A clear support trendline that perfectly aligns with the 50% retrace.
A clear line of support on the 61.8, tested in March/April of 2025 at the $235 level.
RSI is also starting to look supportive of a move up.
Also of interest is the peak out of the channel, telling me we could explode higher out of this channel in the future. just something to watch for.
Thanks and have a great one!

Cocaine Saylor is coming for you! The man the myth the legendary cocaine snake oil saylor is BACK once again to take you out to the CLEANERS!! The infamous dot com bandit is going to snatch your 401k like an old grannys pocket book! BEWARE!!!

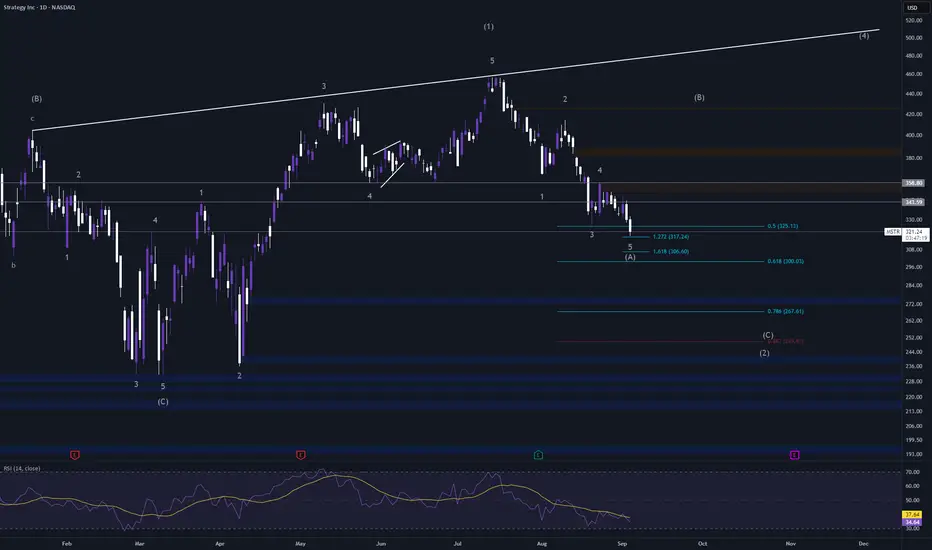
Microstrategy: Further DeclineAfter a brief consolidation, MSTR continued its decline since our last update, further developing turquoise wave 2, where we still see price positioned. We continue to anticipate the low of this wave above the support at $153.49. In the meantime, we have revised the magenta substructure of wave 2 to a - - formation, with the final (wave- ) leg currently unfolding. Once turquoise wave 2 completes, we expect a strong rally above resistance at $674.18, which should significantly advance the broader upward impulse. However, under our new alternative scenario, a different wave count could prevail: price may currently be forming magenta wave alt. to the upside, developing a blue three-part substructure in the process. In this 25% likely scenario, the next move would be for blue wave alt. (b) to finish within the nearby blue alternative Target Zone between $306.60 and $252.67, before wave alt. (c) pushes up toward the top of magenta wave alt. near $674.18. Within this alternative, the blue zone could offer long entry opportunities, though heightened caution is warranted: since this remains only an alternative scenario, risk is elevated, and we consider strict risk management—such as setting a stop 1% below the lower edge of the zone—absolutely essential.

MSTR Ready for bounce after 5 waves and bullish divergenceMSTR is looking ready to bounce for at least a wave (B), currently just past the 50% of the impulse up and 127% extension of wave 4 showing bullish divergence. Could go a little lower still but looking to potentially go long on the bounce.
MSTR Finished Flat and Ready for BounceJust hit 61.8% retracement of the recent pop up. It looks like 3 off the bottom but the recent bounce was off A=C from the July 16th drop after 5 waves up. Will know today or tomorrow if this plays out or it keeps dropping.

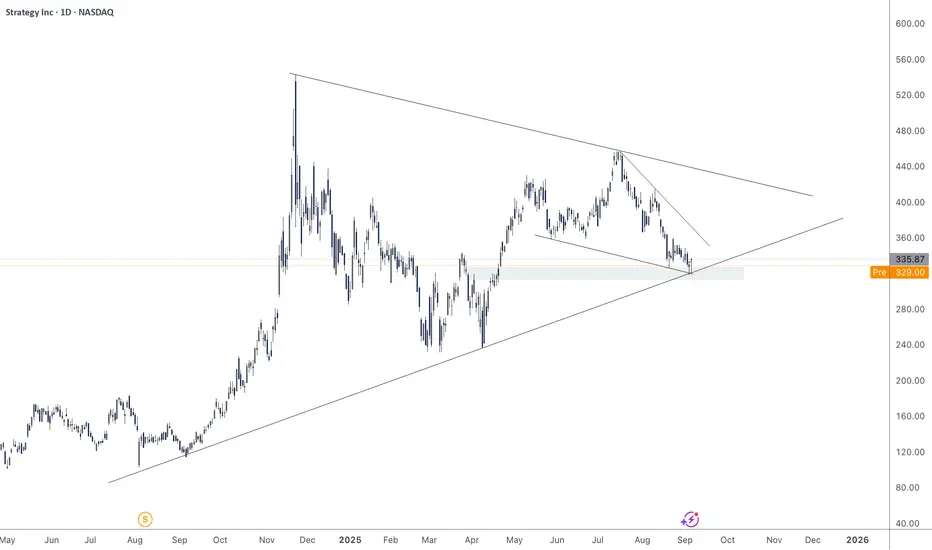
$MSTR – Bear Flag Breakdown SetupNASDAQ:MSTR – Bear Flag Triggering Despite Crypto Strength
MicroStrategy ( NASDAQ:MSTR ) has been drifting lower even as crypto has ripped the last few months — a clear sign of relative weakness. Every rally attempt has been faded, and now the chart is setting up a clean bear flag breakdown.
🔹 The Setup:
Price is pressing the $326 trigger level on a bear flag structure.
A breakdown here opens the door to $300 for the first cover zone.
Weak price action despite a strong sector = bearish divergence.
🔹 Market Context:
The NASDAQ:QQQ is flashing distribution signals — failed breakouts in momentum names and heavy selling under the surface.
If indexes continue to weaken, NASDAQ:MSTR could accelerate to the downside as speculative money comes out.
🔹 My Trade Plan:
1️⃣ Entry: Short on breakdown through $326.
2️⃣ Target: First covers into $300.
3️⃣ Stop: Above the flag highs — no need to fight if it reverses.
Why I Like This Setup:
Relative weakness vs. crypto = red flag for bulls.
Bear flag structure + clear trigger + defined target.
Broader market weakness adds conviction.
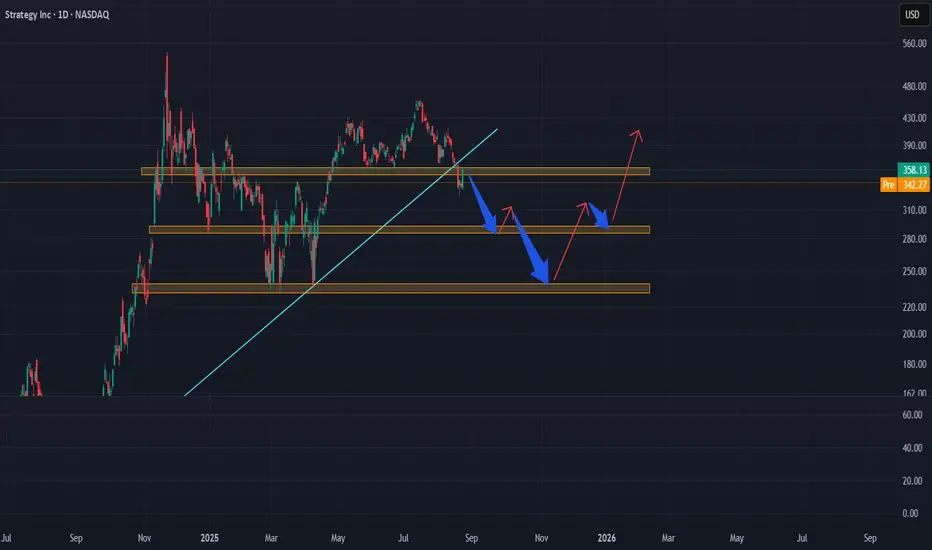
$MSTR better not cross $315 or less....While many don't agree with the direction that MSTR is heading, the technicals seem to tell a very clear story. Looking at support and resistance levels, we can see a strong resistance levels - which is miles away from where it is today! - and seems to be encroaching to support levels of around $315. If NASDAQ:MSTR breaks $315, CBOE:MSTZ could be a VERY NICE play.....
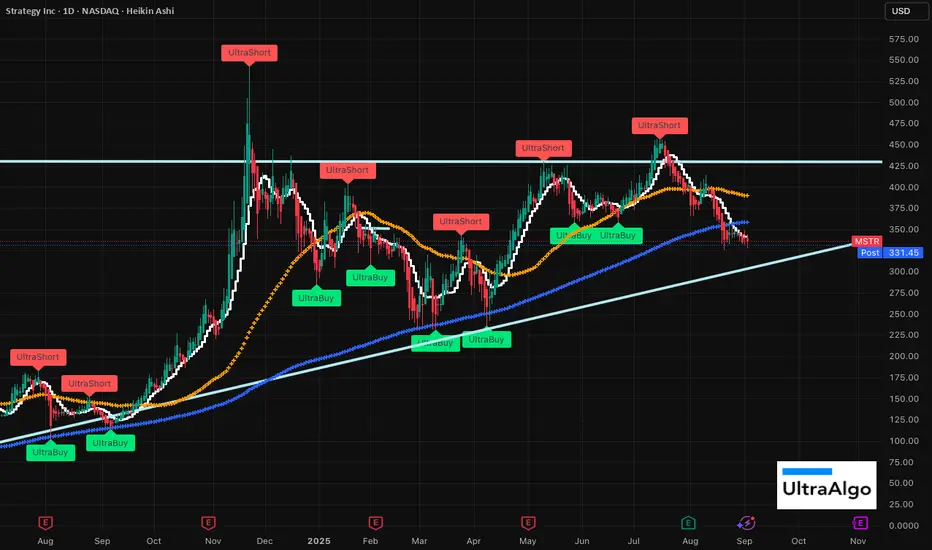
Have a hunch that we'll see an UltraShort signal soon, and then show will begin!
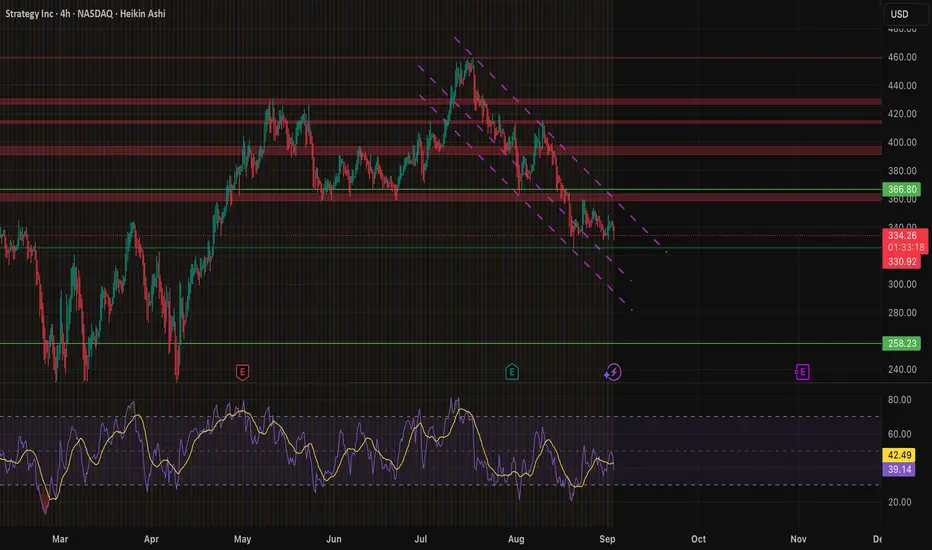
MSTR bound for reversal from support.Here you can find the candles in 4hr chart are at support and at trendline support making it a strong candidate for reversal.
MSTR Near BreakoutThe markets are red, but not MSTR. Bullish wedge could breakout within a week pointing to $450+. MACD and Bressert crossing up. Little bit of RSI bullish divergence showing up on the daily.

MSTR Short Alert | Lean Short Bias at $335
# ⚡ MSTR Short Alert | Lean Short Bias (Sep 2, 2025) 🪙📉
📊 **Market Summary:**
* Daily/Intraday: Bearish (Price < daily EMAs, RSI \~35, MACD negative) 🔻
* Weekly: Weakening but not decisively broken (near/above 50-week EMA) 📈
* Volume: Light — low participation on recent declines ⚖️
* Headlines: Neutral; watch BTC correlation & macro events 📰
**Net Bias:** Lean short on daily timeframe; small position recommended 🐻
---
## ✅ Trade Plan
* 🎯 **Instrument:** MSTR
* 🔀 **Direction:** SHORT
* 💵 **Entry Price:** \~335.0 (acceptable 333–336)
* 🛑 **Stop Loss:** 341.13 (daily resistance / pivot)
* 🎯 **Take Profit:** 320.00 (scale 60%), trail remaining 40% to 310.00
* 📊 **Position Size:** 1.5% of portfolio
* 📈 **Confidence:** 60%
* ⏰ **Entry Timing:** Market Open
---
## ⚠️ Key Risks
* Low volume → false break / short-squeeze risk ⚡
* MSTR-BTC correlation or S\&P rumors could gap price higher 🪙
* Weekly support \~322–325 may limit downside 🛑
---
## 💡 Trade Rationale
* Daily + 30m confluence: short-term bounce attempts stalling under intraday resistances (336–339)
* Weekly momentum weakening → controlled small-size short
* Stop above 341.13 → disciplined risk management
---
\#️⃣ **Tags / Hashtags:**
\#MSTR #ShortTrade #StockTrading #SwingTrade #CryptoCorrelation #DailyRSI #TradingSignal #RiskManagement 🐻🔥

MSTR Bottoming Soon?NASDAQ:MSTR continues to range while weekly RSI heads into oversold without a significant pullback, a good sign for a bullish long term outlook.
My downside target for this move remains the High Volume Node, weekly pivot and golden ratio Fibonacci retracement at $290.
The R3 weekly pivot is a solid terminal target at $1039 but could overextend in an irrational environment.
Analysis is invalidated below wave (IV)
Safe trading

338.65This channel is not providing individualized trading or investment advice, nor is it a banking service, brokerage service, trading service, investment service or money management service

MSTRMSTR MNAV for the moment is bearish and it could down until 1.1-0.7 MNAV if BTC begins a bearish market that could affect MSTR MNAV and MSTR price to a lower level between 160$-80$ as occur in 2022 bear market dropping more than 85% on price and 0.7 on MNAV level. MSTR is a volatile stock and it should be treated as high risk trade. No financial advice.


MicroStrategy Head And Shoulders Signals further downsideThe H&S pattern on the daily timeframe signals potential further downside relating to this current corrective period. Investors should beware of the diminishing volume on rallies and increasing volume in declines spurring a change in trend.
Targets for the Head And Shoulders pattern is the length of the head to the valley of the right shoulder.

micro strat impulsive move to the upsidfe !!highly spec, fractal playing out could see an upswing to the 14-16k range, only bouted on how BTC plays out....
Bearish MSTR is temporary; Rise to more than 412$ in the future.As it's obvious, MSTR has broken it's bullish trendline and a great pullback has happened. I believe after breaking a support at 293$, It will head toward 239$ then will rise and break the bearish trendline. After surpassing the 293$ resistance, It will catch 412$. Also it's evident that buying crypto by Michael Saylor can improve the stock price.
Time to fill up the MSTR bags!Bitcoin is ready to pump. Powell is really to lower the rates.
It might feel scary right now but this is the time where the money is being earned.
It's just my idea. No financial advice :)
