TESLA EARNINGS OCT 16 2025Price action for Tesla is here. I have clearly explained my plan on how to trade tesla considering every factor in market.
STAY AWAY FROM TRADING TESLA
NOTE: OPTION WILL BURN YOUR CAPITAL
Trade ideas

Tesla Earnings Tonight – Growth Era Under Pressure?TSLA reports Q3 2025 earnings after the bell.
Estimates: $0.55 EPS (+37.5% QoQ) and $26.46 B revenue (+18%).
Strong on paper — but the real story will come from forward guidance.
What’s beneath the surface:
Inventory is rising as production outpaces sales since Q4 2024.
Annual revenue growth turned negative in Q2 2025.
EBT has declined roughly 11% per quarter since Q3 2024.
China’s rare-earth export limits tighten Tesla’s margins and favour BYD & NIO.
Technical Outlook:
TSLA remains range-bound between $411.6 – $448.2 (heavy volume zone).
If price moves higher, watch $470.5 (previous high) and $488.5 (ATH).
If it dips, $367.9 (Value Area High) is the support to watch.
Volatility is tightening — tonight’s tone on guidance could decide whether Tesla stays range-bound or starts a new phase.

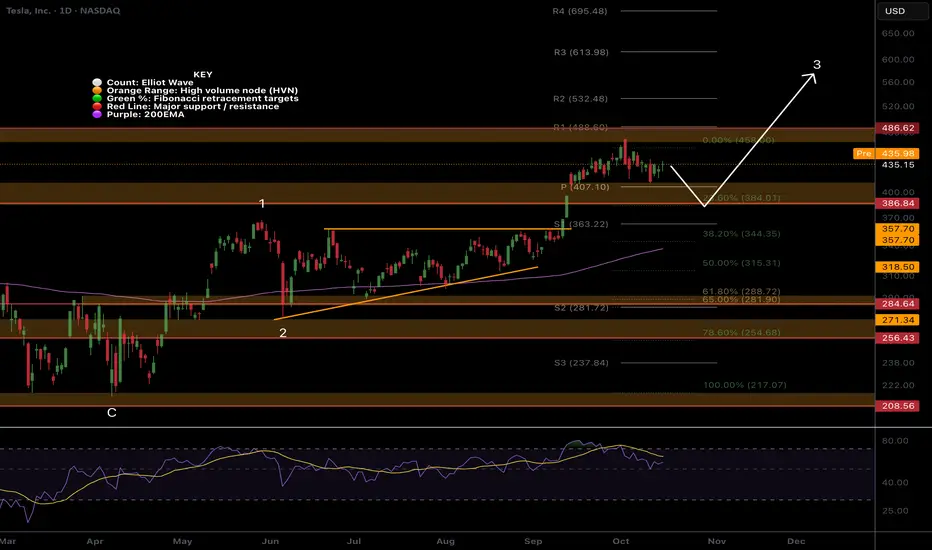
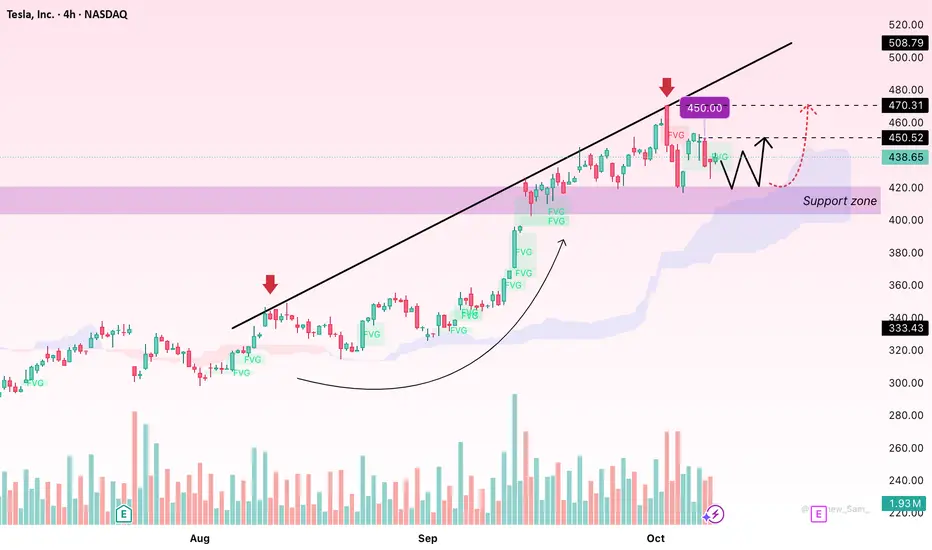
TSLA looks ready for higher in wave 3NASDAQ:TSLA found resistance at the all time High Volume Node and is trapped between that and the high volume support node.
The trend is up and strong. above the daily pivot and daily 200EMA with width.
I expect price to find support and continue into price discovery.
Safe trading
Tesla at major support. I'm long.Tesla is at major yearly support. Confluence between levels and fib. This is where we need to hold to maintain the trend on the monthly chart. I don't know if it will hang out at this level or possibly go below the level before we regain and higher. But this is a valid long trade at these levels. If we don't hold here it is much lower. Long term target is $670. Remember the fud around Tesla is meaningless. It's all the charts. If the markets were "rational" we wouldn't even be at these levels in the first place.

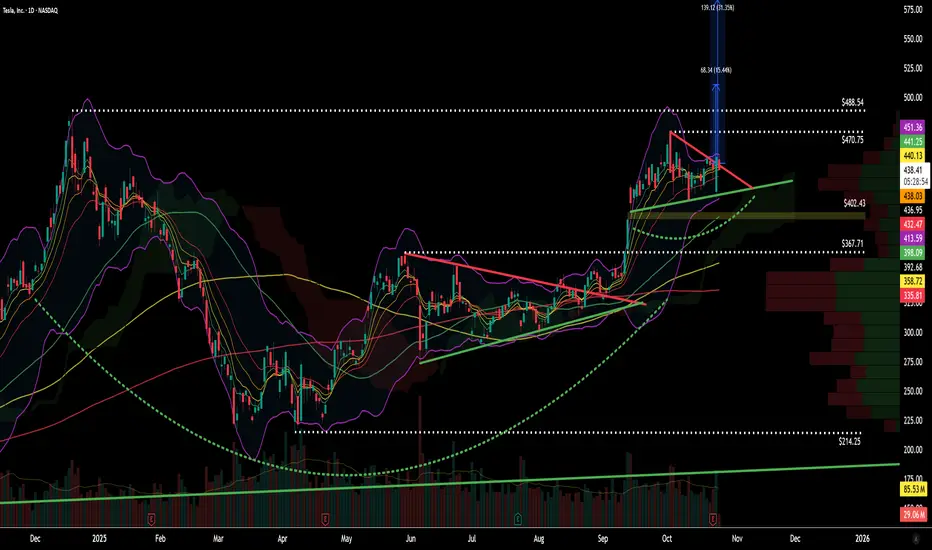
$TSLA – Bull Pennant Sequence & Cup-and-Handle ContinuationThis is a follow-up to my August–October technical outlook on Tesla ( NASDAQ:TSLA ).
After the first bull pennant breakout, price pushed to $470, falling just shy of my initial $480 target, before pausing and forming another bull pennant directly below December’s all-time high near $488.
Structure & Momentum
Momentum remains strong — the daily chart has now completed a cup and handle formation, adding a new layer of continuation confluence to the broader trend structure.
The key takeaway here is that NASDAQ:TSLA continues to respect rising MAs and trendline support, consolidating at high levels rather than breaking down — a bullish sign of controlled digestion after a strong run.
To confirm a full breakout continuation, the chart now needs a decisive move through $488 on high volume. Until that happens, the current pennant acts as both a compression zone and accumulation phase.
Breakout & Targets
If volume expands and NASDAQ:TSLA clears the $488 ATH, the next resistance targets are:
Target 1: $510 → symmetrical triangle 1:1 projection
Target 2: $580 → measured move from flagpole #2 (pennant #1 extension)
Both levels represent high-probability reaction zones where price could pause or retrace before resuming trend.
Support & Risk Management
Below, the chart shows clear structural support at:
$402 → prior breakout base and Ichimoku cloud zone
$367–$370 → trendline & confluence support
As long as price respects these zones, the setup remains valid and constructive.
A close below $370 on strong volume would invalidate the near-term bullish bias.
Technical Summary
✅ Trend: Bullish continuation
✅ Pattern: Cup & Handle + Bull Pennant #2
📊 Key Resistance: $488 (ATH)
🎯 Targets: $510 / $580
⚠️ Support Watch: $402 → $370
🔍 Trigger: Breakout confirmation on strong volume
Final Notes
Tesla continues to show a textbook multi-phase breakout structure — bull pennant, consolidation, and potential measured-move continuation. Until the breakout confirms, patience around $488 remains key. Once volume supports it, the next leg higher could complete the second flagpole move toward the $510–$580 range.
For educational and technical analysis purposes only.
TSLA Weekly Outlook (Oct 28–31)TSLA Weekly Outlook (Oct 28–31): “Charging Toward 470 or Cooling at the Top?” ⚡
1. Weekly (1W) Structure – Big Picture
Tesla is in a strong bullish continuation phase, showing a clear Break of Structure (BOS) above $367 and holding momentum above $450. The downtrend line from the 2023 high was broken, confirming a long-term structural reversal. Price is now consolidating near $452–$460, forming a possible higher-low setup before a push to $488–$500 zone.
* Bias: Bullish continuation unless price closes below $411.
* Support: $367 → $411 zone
* Resistance: $470 → $488 zone
* MACD: Expanding bullish histogram, showing momentum strength.
* Stochastic: Near overbought but still trending upward.
💡 Weekly Thought:
Tesla’s higher timeframe looks ready for another leg up, but a mild pullback to $430–$440 wouldn’t hurt the structure—it would actually create a healthy base for November.
2. Daily (1D) – Momentum Check
The daily chart confirms a strong BOS and ascending channel. After testing the channel’s lower boundary ($411–$420), Tesla rebounded cleanly toward $452. Price is attempting to reclaim the midline of the ascending channel, signaling renewed bullish control.
* Bias: Bullish bias, but short-term profit-taking likely near $460–$470.
* Support: $411 → $420 (demand zone)
* Resistance: $460 → $470 (channel top)
* Indicators:
* MACD turning positive after extended red bars.
* Stochastic curling up from mid-levels — bullish swing signal.
💭 Daily Suggestion:
Buyers should stay patient for pullbacks near $440–$445 to re-enter. Short-term traders can target $468–$470 if price holds above $452 with volume.
3. 1-Hour (1H) – Short-Term Game Plan
Tesla is holding above the intraday uptrend line, with clear Breaks of Structure (BOS) around $451–$455. The immediate zone to watch is the $449–$451 range, acting as dynamic support. As long as Tesla holds this area, intraday bulls maintain control.
* Scalp Bias: Bullish as long as price stays > $449
* Immediate Resistance: $455 → $465
* Support: $439 → $445
* Setup Idea:
* Call scalp: Above $455 for target $462–$468
* Put scalp: Only if breaks below $445 with volume
📈 1H Thought:
If Tesla consolidates sideways around $450–$455 early week, it sets up a launch toward $470 later in the week.
4. GEX & Options Sentiment – Institutional Flow Insight
The Gamma Exposure (GEX) map shows clear call dominance:
* Highest positive GEX wall / resistance: $455–$460
* 2nd & 3rd Call Walls: $465 → $470 → $480
* Put walls / downside support: $430 → $415 → $400
Key Metrics:
* GEX Bias: +57.2% Calls
* IVR: 15.5 (low volatility environment)
* IVx avg: 60.2% (vol compression likely → bullish)
Institutions are positioned bullishly with heavy call exposure at $460–$470, acting as a near-term magnet. The $430–$415 range remains protected by put walls—making it a tough zone to break down through unless macro turns negative.
5. Suggested Option Plays
* Bullish Setup (Preferred):
* Buy-to-open 460C (1DTE/2DTE) if price reclaims $455–$457 with volume.
* Target: $470
* Stop: Below $445
* Reason: Strong call gamma wall at $460 + breakout potential.
* Bearish Hedge (Cautious traders):
* Buy 440P (1DTE/2DTE) only if TSLA breaks $445 on volume.
* Target: $430
* Stop: Above $455
6. My Take for Oct 28–31
Tesla is showing clean bullish structure across all timeframes.
* Weekly confirms a higher low and BOS continuation.
* Daily is aligned within an ascending channel.
* 1H shows intraday bullish trendline support.
* GEX confirms call-dominant sentiment toward $470.
If macro markets remain stable, TSLA likely tests $468–$470 this week, possibly stalling there for profit-taking. A rejection near that level would bring $440–$445 back into play for reload.
🎯 Primary Bias: Bullish toward $470
⚠️ Watch For: Failing to hold $445 = possible short-term correction.
Disclaimer:
This analysis is for educational purposes only and not financial advice. Always manage your risk and perform your own due diligence before trading options or equities.
TSLA – Mild Pullback Before Resuming Its Upward TrajectoryHello everyone,
Tesla (TSLA) is showing a healthy technical pullback after an impressive rally, yet the broader bullish trend remains intact. The stock is currently hovering around $438.69, down 4.5% in the latest session — a move that reflects short-term profit-taking rather than a shift in market sentiment.
On the news side, Tesla has just unveiled lower-cost versions of the Model 3 and Model Y — a strategic decision aimed at expanding its mid-range customer base. However, the market’s reaction has been somewhat cautious, possibly due to concerns over shrinking profit margins as prices drop. Nevertheless, this move allows Tesla to strengthen its global footprint and improve competitiveness, particularly in key markets like China and Europe.
At the same time, the company continues to advance its Full Self-Driving (FSD) technology and the Robotaxi project — seen as Tesla’s long-term growth pillars. Once fully realised, autonomous mobility services could unlock significant recurring revenue, reinforcing investor confidence even amid short-term corrections.
From a technical perspective, the 4H chart indicates that price remains well above the Ichimoku cloud, confirming that the uptrend still dominates. Shallow Fair Value Gaps (FVGs) have been filled, hinting that price might retest support before rebounding. The $430–$420 area serves as a critical support zone, while resistance stands near $440 and $445. A clear breakout above $440 could open the path toward $450–$460.
Overall, Tesla appears to be consolidating within a natural pause rather than reversing. As long as the $420 level holds, the bullish structure remains valid.
What about you — do you see this pullback as a springboard for new highs, or the start of a longer consolidation phase for TSLA?
Tesla (TSLA) — Momentum Reload or Major Cooldown?The Next $400–$450 Decision Zone!
🧭 Weekly Chart — Big Picture Momentum
Tesla has printed one of the cleanest BOS (Break of Structure) patterns on the weekly timeframe since the post-2023 recovery, confirming that the macro downtrend has flipped into a sustained bullish expansion. The stock ripped from its $216 CHoCH base and is now consolidating above the prior macro breakout line near $425.
However, the latest weekly candle shows stalling momentum, forming a short-term distribution near the $430–$440 region. That zone lines up perfectly with the previous supply structure and fib confluence from 2022 highs.
The MACD histogram remains strongly positive but is beginning to flatten — early warning that buying pressure might be easing. Stoch RSI is also hovering near overbought at 85+, signaling the need for a short-term reset before the next leg.
* Bullish scenario: A weekly close above $436–$440 would confirm strength continuation toward $488–$500, the next liquidity zone.
* Bearish scenario: A close below $410 opens the door for a healthy pullback to $367–$376, a major equilibrium level with demand imbalance and previous BOS base.
Weekly takeaway: Trend remains bullish, but short-term overextension hints at a pause or mild retracement before another drive up.
⚙️ Daily Chart — Structure and Cooling Phase
The daily chart confirms Tesla’s minor pullback within the larger bullish wave. After breaking above $400 with strong momentum, price is now consolidating just above its breakout order block ($415–$420).
The BOS on daily shows continuation potential, but MACD has started printing red bars — suggesting that momentum is fading and a retest is underway. The Stoch RSI sitting high around 93 indicates the correction may continue until momentum rebalances.
* Bullish case: If TSLA can hold $416 and print a higher low, the next upside targets are $442 → $455, then $488 (supply zone).
* Bearish case: A daily close below $414 would invalidate near-term bullish control, triggering a slide toward $400–$397, a major demand block that aligns with GEX PUT support.
Daily summary: Still in bullish structure, but short-term retracement needed for healthy continuation. Watch for $415 hold as pivot.
⏱ 1-Hour Chart — Trading Plan
On the 1-hour chart, TSLA is forming a short-term consolidation wedge between $420 and $436 after multiple CHoCH and BOS flips. The stock is bouncing between mid-range liquidity pockets, showing clear indecision from both sides.
MACD is recovering from a previous bearish cycle, while Stoch RSI has crossed up from mid-levels — showing early signs of a micro-bounce in progress.
Volume confirms that buyers are active at $424–$425 zone, but strong resistance remains near $436–$440.
Trading Plan:
* Bullish setup: Enter above $436 breakout with target $445 → $455, stop at $425.
* Bearish setup: Short if $420 fails with downside target $405 → $400, stop at $430.
This structure allows swing-to-scalp flexibility — traders can lean bullish above $425 but must stay cautious until price reclaims $436 decisively.
💥 Options GEX & Institutional Positioning
Based on the Options GEX chart:
* Highest Call Wall: $450 — heavy resistance and likely magnet if bulls push higher.
* Next positive GEX zone: $445, where gamma flips positive and market makers chase delta hedges upward.
* Major PUT Wall: $400 — strong defense area, aligning perfectly with chart structure and demand.
* IVR 25.7 / IVx 67.7 → volatility premium moderate, favoring directional plays with limited spreads.
Gamma interpretation: As long as price holds between $425–$440, market makers maintain positive gamma, keeping price pinned and range-bound. A clean breakout above $440 could trigger a gamma squeeze toward $455–$460.
🎯 Option Strategy Ideas
1️⃣ Bullish Continuation Play:
* Buy $430C / Sell $450C (Oct 25 expiry) — risk ~$6 for a potential $14 reward if Tesla rallies to $450+.
* Aggressive intraday: Buy 0DTE/2DTE $430 Calls only if price reclaims $436 with volume.
2️⃣ Bearish Hedge:
* Buy $420P / Sell $400P (Oct 18 expiry) — ideal if $420 support fails and correction deepens.
3️⃣ Neutral Income Strategy:
* Expecting chop between $420–$440? Sell Iron Condor ($440C/$450C and $410P/$400P) to profit from time decay.
💬 Final Thoughts
Tesla remains one of the strongest setups in the market — the bullish macro trend is intact, but current levels are stretched. Expect sideways or minor correction before another breakout attempt. The $415–$425 area is the key battleground: lose it, and we test $400; reclaim $436+, and the rocket’s back on for $455–$480.
My TA continues to show high win-rate accuracy, and if you’ve followed previous analyses, you’ve seen how precise these levels play out.
If there’s any stock you want me to analyze next — even ones I don’t usually post — DM me and I’ll be happy to break it down for you.
This analysis is for educational purposes only and does not constitute financial advice. Always do your own research and manage your risk before trading.

Is Tesla Setting Up for a Rebound? Key Entry Levels Inside🎯 TSLA: The "Thief Strategy" Playbook | Swing/Day Trade Setup 📈
🔥 Quick Overview
Asset: Tesla, Inc. (TSLA)
Bias: 🐂 BULLISH
Strategy Type: Thief Layering Entry Method
Risk Level: Medium-High (Swing/Day Trade)
💰 The "Thief" Entry Strategy Explained
The "Thief Strategy" uses multiple limit orders (layering method) to accumulate position at different price levels. Think of it like setting traps at various floors of a building—you catch opportunities wherever price decides to visit! 🎣
📊 Entry Zones (Layer Your Orders):
Layer 1: $430.00
Layer 2: $435.00
Layer 3: $440.00
💡 You can add more layers based on your own risk appetite and account size. The beauty of layering? You average your entry and reduce timing risk!
🛡️ Stop Loss (SL):
Thief SL: $415.00
⚠️ Important Note: This is MY stop loss level based on the Thief Strategy framework. You're the captain of your own ship! 🚢 Adjust your SL based on YOUR risk tolerance and account management rules. Trade at your own risk—make money, take money, manage wisely!
🎯 Target (TP):
Primary Target: $490.00
🚨 Why $490? This zone represents a confluence of:
Strong resistance area
Potential overbought conditions
Historical trap zone where bulls get exhausted
📢 Thief OG's Reminder: I'm NOT saying you MUST take profit only at my TP level. If you see profits that make you smile, SECURE THEM! 💵 The market gives, and the market takes. Be greedy when you can, be smart always.
🔍 Technical Analysis Breakdown
Tesla is showing bullish momentum structure with potential for continuation toward the $490 resistance zone. The layering strategy allows us to build position as price potentially dips into demand zones before the next leg up.
Key Technical Levels:
Support Zone: $430-$440 (Our entry layers)
Invalidation: Below $415 (Stop loss)
Resistance Target: $490
📌 Related Pairs to Watch (Correlation Play)
Understanding correlated assets helps confirm your thesis:
AMEX:SPY (S&P 500 ETF)
TSLA often moves with broader market sentiment
Watch SPY for overall risk-on/risk-off environment
NASDAQ:QQQ (Nasdaq 100 ETF)
Tech-heavy index where TSLA is a major component
Strong correlation with TSLA price action
NASDAQ:NVDA (NVIDIA)
Both are high-beta tech growth stocks
Often move together during risk appetite shifts
TVC:DXY (US Dollar Index)
Inverse correlation: Strong dollar = pressure on growth stocks like TSLA
Weak dollar = tailwind for equities
💡 Key Point: If SPY/QQQ are bullish + DXY weakening = Strong confirmation for TSLA upside!
⚡ Trading Tips for Thief OG's
Don't FOMO — Let price come to your layers
Manage position size — Each layer should be equal weight
Trail your stop — Once profitable, protect gains
Watch volume — Confirm breakouts with volume spikes
Stay flexible — Market conditions change; so should you!
🎬 Final Words
This setup is all about patience, precision, and profit extraction! 🎯 The Thief Strategy isn't about stealing from the market—it's about being SMART and setting yourself up for success with calculated entries.
Remember: The best trades are the ones where you're prepared, not scared! 😎
✨ If you find value in my analysis, a 👍 and 🚀 boost is much appreciated — it helps me share more setups with the community!
#TSLA #TeslaStock #SwingTrading #DayTrading #ThiefStrategy #LayeringStrategy #StockMarket #TradingIdeas #TechnicalAnalysis #BullishSetup #TradingStrategy #RiskManagement #StockTrading #MarketAnalysis #TradingCommunity

TSLA is going UP! .. time to buy!Tsla aka Tesla was stuck in-between 2 powerful support and resistance zones (the red and green lines) .. It finally broke to the upside and broke above the resistance level. It is now very likely to head to the next resistance zone which was the previous high (the next resistance zone has been drawn as the white line shown on the chart) - this is where we will be taking profit at. BUY NOW!

TSLA at a Crossroad: Can Bulls Push Through $450 Wall on Oct 241. Market Structure (1H & 15M)
Tesla’s price structure is showing a clear short-term bullish shift after back-to-back CHoCH confirmations from the $415 zone, where buyers absorbed liquidity aggressively. The Break of Structure (BOS) on the 15-minute around $440–$445 confirms that smart money rotated back into long positions after a liquidity sweep of last week’s lows.
On the 1-hour chart, TSLA is reclaiming momentum above its recent CHoCH zone near $420, building a stair-step structure toward the previous supply zone at $450–$455. The trendline drawn from the previous lower highs (extending from the $470s) still acts as a major trend barrier, meaning a clean break and hold above $450–$452 is the confirmation bulls need to signal a higher timeframe reversal.
Smart money accumulation looks evident between $415–$425, where volume clusters align with the CHoCH reversal. Above that, liquidity resides at $455–$460, a potential magnet if momentum sustains through Friday.
2. Supply and Demand / Order Blocks
* Demand Zone (High Probability Reaccumulation): $415–$425. This zone was defended twice and coincides with prior sell-side liquidity.
* Immediate Support / Fair Value Gap Fill Area: $435–$440, likely to act as intraday springboard if retested during premarket dip.
* Supply Zone / Sell-Side Liquidity: $450–$455. This aligns with the 1-hour bearish order block formed from the Oct. 17–18 breakdown.
Expect a reaction near $450 — either a rejection for intraday pullback or a breakout continuation if bulls trap shorts above it. If price clears that level with strength, next supply sits around $462–$465.
3. Indicator Confluence
* 9 EMA vs 21 EMA: Both EMAs have crossed to the upside on the 15-minute and are starting to fan out on the 1-hour, confirming a short-term bullish bias.
* MACD: The histogram shows strong positive momentum with expanding bars on the 1-hour, but slight divergence on 15-minute as momentum cooled late in the session — suggesting a possible small pullback before continuation.
* RSI: Hovering around 70 on the 1-hour, indicating overbought conditions but still within bullish control. On 15-minute, RSI has cooled off near 60, resetting for potential continuation.
* Volume: Expansion noted during the breakout, confirming participation. Momentum remains positive unless volume fades on retest.
4. GEX (Gamma Exposure) & Options Sentiment
According to the GEX chart, $450–$455 is the 2nd major call wall and highest positive gamma zone, while $420 remains the strongest PUT support for Friday (10/24). The HVL (High Volume Line) around $430 aligns perfectly with the mid-support of the structure.
Dealer positioning remains net positive gamma, meaning we can expect controlled movement unless price breaches outside the $420–$455 zone. A sustained move above $450 would likely force dealers to hedge upward, fueling a gamma squeeze toward $460+. Conversely, if TSLA rejects and falls back below $440, expect volatility expansion downward toward the $420 PUT wall.
Current IVR (6.1) and IVx (≈60) show low implied volatility, hinting that options are relatively cheap — favorable for directional plays. Call flow sits around 64%, reinforcing bullish sentiment for tomorrow’s session.
5. Trade Scenarios for Friday, Oct. 24
Bullish Setup 🟩
* Entry Zone: $443–$445 retest or reclaim above $450
* Target Levels: $455 → $462 → $470 (if squeeze triggers)
* Stop-Loss: Below $438 (invalidate short-term structure)
* Confirmation: Hold above 9EMA on 15-min with MACD histogram remaining green and RSI > 60
Bearish Setup 🟥
* Entry Zone: $450–$455 rejection zone
* Target Levels: $440 → $430 → $420
* Stop-Loss: Above $457 (invalidate bearish rejection)
* Confirmation: MACD red crossover + RSI divergence + 15-min CHoCH to downside
6. Closing Outlook for Oct. 24 (Friday)
Tomorrow’s session could be decisive. If bulls defend $440–$445 early and reclaim $450 with conviction, it opens the door to a Friday gamma squeeze into $460+. But if momentum fades and $440 gives way, expect a controlled retrace back into the $425–$430 demand.
Personally, I’m watching $450 as the battleground — it’s both a psychological level and a technical liquidity point tied to heavy options flow. Any strong break with volume could trigger dealer hedging upward. But failure to sustain above it might lead to a Friday fade, especially into the afternoon session when gamma neutralizes.
📈 Final Thought:
“TSLA is coiled between $440–$450 — and tomorrow, one side will get trapped. If bulls hold the floor, expect fireworks into $460+. If not, $425 retest is back on deck.”

Tesla Wave Analysis – 23 October 2025- Tesla reversed from support area
- Likely to rise to resistance level 467.30
Tesla recently reversed from the support area located between the key support level 415.60 (which has been reversing the price from the middle of September) and the lower daily Bollinger Band.
This support area was further strengthened by the 38.2% Fibonacci correction of the upward impulse from August.
Given the strong daily uptrend, Tesla can be expected to rise to the next strong resistance level 467.30 (top of the previous impulse wave i).

Tesla Approaching Key Resistance: Bullish Breakout Likely Current Price: $433.72
Direction: LONG
Targets:
- T1 = $465.00
- T2 = $485.00
Stop Levels:
- S1 = $420.00
- S2 = $410.00
**Wisdom of Professional Traders:**
This analysis is driven by insights from thousands of seasoned traders and financial analysts who are closely monitoring Tesla’s price movements and technical setups. The collective evaluation highlights that Tesla is at a pivotal point, with its current price showing strong indications of a potential breakout above existing key resistance levels. Professionals often emphasize the importance of aligning macroeconomic factors, company fundamentals, and technical trends when forecasting Tesla’s trajectory. By synthesizing these views, this post offers a high-probability trade opportunity.
**Key Insights:**
Tesla continues to benefit from its dominance in the EV space, with technological advancements such as improved battery efficiency and enhanced self-driving capabilities giving it a competitive edge. The company’s Q3 2025 performance demonstrated resilience, with deliveries recovering year-over-year amidst concerns about economic slowdowns. Tesla’s diversification into energy storage and grid solutions is increasingly recognized as a meaningful driver of growth beyond its automotive division, contributing to broader revenue streams.
Technically, Tesla’s stock has been coiling near its $430-$440 resistance band for the past few weeks, showing signs of bullish consolidation. Volume has been building, while Relative Strength Index (RSI) suggests upward movement is in play without entering overbought territory. Breakouts from such critical resistance zones typically result in strong follow-through price movements, with potential gains toward the $465 and $485 regions.
**Recent Performance:**
Tesla has seen a steady recovery in the past quarter, regaining momentum after a slight dip earlier in the year. The stock showed resilience despite industry-wide concerns surrounding EV demand and global economic pressures. Over the last two months, Tesla’s stock has appreciated by over 12%, recovering from $390 levels to its current price point. Strong institutional buy-side interest and reduced short interest have supported its upward trajectory, indicating confidence in future growth prospects.
**Expert Analysis:**
Technical analysis reveals a bullish setup, with Tesla’s short-term moving averages (10-day and 20-day) trading above its longer-term averages, including the 50-day and 200-day moving averages. This "golden cross" signals bullish sentiment may guide the stock higher as positive trading activity picks up momentum. Traders also observe tightening Bollinger Bands, which may act as a precursor to volatility expansion in the upward direction.
Additionally, macro outlooks for Tesla remain positive as the global push for electric vehicle adoption continues to gain traction. Experts believe Tesla’s ability to maintain high margins despite pricing pressure is a critical long-term advantage. The financial guidance for Q4 2025 indicates consistent revenue growth, further supporting the bullish sentiment for the stock.
**News Impact:**
Notably, Tesla’s recent announcement of a major partnership to deploy its battery technology for utility-scale energy storage systems has generated significant excitement in the market. Analysts view this as a game-changer that could carve out an additional revenue stream for Tesla, diversifying its earnings base. Additionally, regulatory incentives across Europe and Asia to accelerate EV adoption are expected to favor Tesla’s market penetration efforts, bolstering its stock performance in the near term.
**Trading Recommendation:**
The current technical setup, robust fundamental tailwinds, and optimistic growth outlook signal a strong buying opportunity for Tesla. A clear breach of the $440 resistance level could pave the way for a bullish breakout, targeting $465 in the near term with the potential for further gains toward $485. Risk management is crucial, so traders should consider setting their stop levels at $420 and $410, respectively, to protect against downside risk. Tesla’s diversified growth strategy and recent positive news position it as a solid long trade with upside potential in the coming months.
Do you want to save hours every week? Register for the free weekly update in your language!

Volatility Period: Around October 22nd (October 21st-23rd)
Hello, traders!
If you "Follow" us, you'll always get the latest information quickly.
Have a great day.
-------------------------------------
(TSLA 1M Chart)
The key is whether the price can rise above the target level of 488.54 by following the rising channel.
If the price fails to rise, we should check for support near 381.59.
-
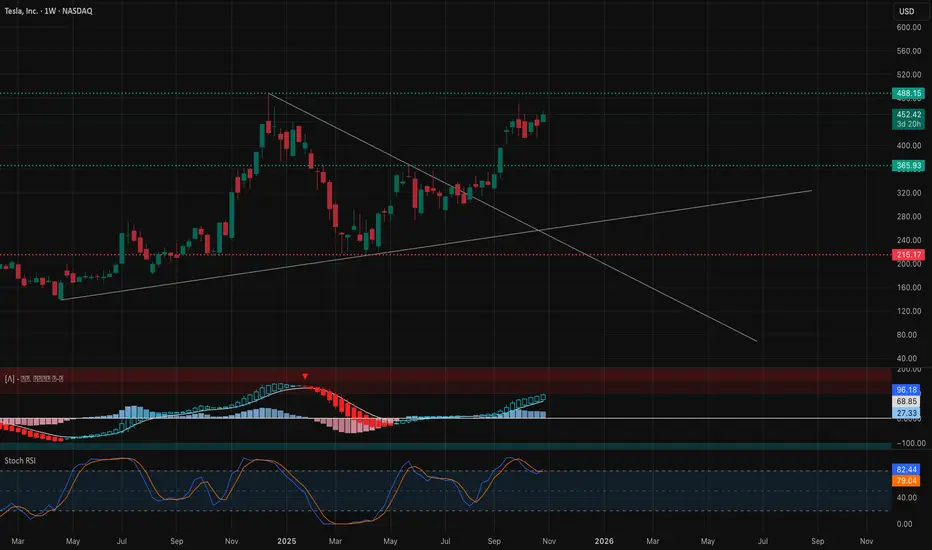
(1W Chart)
The rising trend line (1) has formed, forming an ascending channel.
Therefore, the key is whether the price can maintain above the rising trend line (2) and rise along the rising channel.
The HA-High ~ DOM(60) range on the 1W chart is formed in the 382.40-421.06 range. If the price remains above this range, a stepwise uptrend is expected to continue.
-
(1D chart)
The key question is whether the price can continue its upward trend toward 488.54 after passing through this volatile period around October 22nd (October 21st-23rd).
To do so, we need to see if it can find support and rise around 439.60-442.79.
-
Thank you for reading to the end.
I wish you successful trading.
--------------------------------------------------

TSLA – Sideways Accumulation Phase Ahead of Major NewsTesla’s stock is currently showing a stable sideways movement around the 430–445 USD range as the market awaits the company’s Q3 earnings report (on October 22).
Recent news reflects cautious investor sentiment , especially after ISS recommended rejecting Elon Musk’s massive compensation package and amid forecasts suggesting a slight decline in Q3 profits.
On the 4-hour chart, TSLA continues to maintain a medium-term uptrend, with prices oscillating around the EMA34 and EMA89, which act as equilibrium zones.
The 432 USD area remains the main support, while 493 USD stands as a key resistance level.
The chart indicates a high likelihood that the price will continue sideways within this range until the market reacts more clearly after the earnings release.
Summary
Currently, TSLA is in an accumulation phase , reflecting a tug-of-war between expectations of increased production and concerns over profit margin pressures.
In the short term, the trend is expected to remain sideways with a slight bullish bias, awaiting a potential breakout driven by the upcoming earnings announcement.

Check Out Tesla's Chart Heading Into This Week's Earnings ReportTesla NASDAQ:TSLA will report earnings this week at a time when the stock is trailing the S&P 500 year to date, although it's beating the key index in the six-month, one-year and five-year periods. What does the electric-vehicle giant's technical and fundamental analysis say?
Let's check things out:
Tesla's Fundamental Analysis
It wasn't that long ago (2023) that CEO Elon Musk forecast that TSLA could end up producing roughly 250,000 Cybertrucks per year.
But so far, that projection has been a "no-go." Cox Automotive reported the other day that the electric-vehicle giant sold just some 5,400 of the trucks in Q3. That's a 63% year-over-year contraction -- and for comparison's sake, Ford NYSE:F sold more than 207,000 F-Series pickups during the same period, including 10,000 F-150 Lightning electric trucks.
Meanwhile, Car and Driver recently reported that the lower-cost Cybertruck Long Range model doesn't match the range of the (admittedly more expensive) dual-motor R1T electric pickup from Rivian NASDAQ:RIVN .
But all is not lost, sort of, for Tesla.
The EV giant recently released Q3 delivery figures and reported that it shipped some 497,100 vehicles overall -- a record for the firm, and better than the 448,000 consensus that Tesla watchers had expected.
Apparently, there was an end-of-quarter rush as U.S. consumers tried to take advantage of a $7,500 federal electric-vehicle tax credit before the benefit expired on Sept. 30.
Tesla also built 447,000 vehicles during Q3 (a different metric from the number of cars delivered).
As for earnings, analysts' consensus view calls for Tesla to report $0.55 in adjusted earnings per share on about $26.6 billion of revenue when the firm releases results Wednesday after the bell. That would represent a 23.6% drop from the $0.72 in adjusted EPS that Tesla reported in the same period a year earlier, while reflecting 5.6% year-over-year growth from Q3 2024's $25.2 billion in revenue.
Still, 16 of the 25 sell-side analysts that I know of who cover TSLA have boosted their Q3 earnings estimates since the quarter started, while only five have revised things downward. (Four have left their estimates unchanged.)
Tesla's Technical Analysis
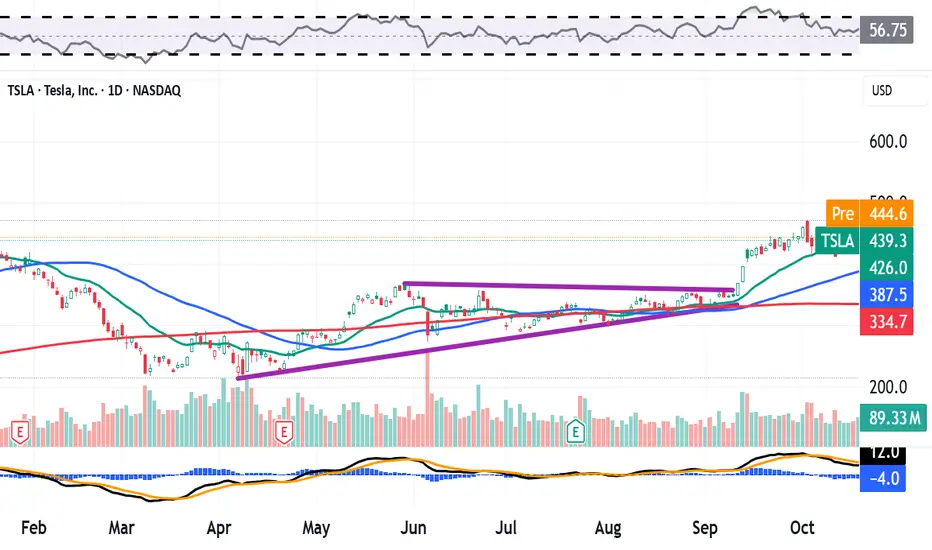
Now let's look at TSLA's year-to-date chart as of Tuesday afternoon:
Readers will see that a "closing-pennant" pattern (marked with purple lines) produced a mid-September breakout for the stock.
Closing pennants historically foretell a sharp spike in volatility for a stock, but don't tell you which direction the move will be: up or down.
In this case, Tesla went higher and built upon the breakout that the stock saw in May from a double-bottom pattern of bullish reversal (the jagged lines at the chart's left).
The stock apexed on Oct. 2 at $470, which is about what some investors might have expected from such a set-up. (Tesla closed Friday at $439.31.)
Now, TSLA looks as if it might have topped going into earnings, and the stock has recently relied upon its 21-day Exponential Moving Average (or "EMA," marked with a green line at $423.60 in the chart above) for support.
This suggests that the swing crowd is likely playing this earnings release, which could lead to some increased volatility after Tesla's Q3 numbers come out.
Looking at Tesla's secondary technical indicators, the stock's Relative Strength Index (the gray line at the chart's top) has drawn back towards neutral after exploding into technically overbought territory in September.
That said, assessing Tesla's daily Moving Average Convergence Divergence indication (or "MACD," denoted by black and gold lines and blue bars at the chart's bottom) is tricky.
The histogram of the 9-day EMA (the blue bars) dropped into sub-zero territory in early October, which is typically a short-term bearish technical signal.
However, both the 12-day EMA (the black line) and the 26-day EMA (the gold line) are still above that zero-bound, which implies a short- to medium-term bullish condition. Still, the 12-day line has crossed below the 26-day line. That's usually a bearish signal.
(Moomoo Technologies Inc. Markets Commentator Stephen "Sarge" Guilfoyle was long TSLA and F at the time of writing this column.)
This article discusses technical analysis, other approaches, including fundamental analysis, may offer very different views. The examples provided are for illustrative purposes only and are not intended to be reflective of the results you can expect to achieve. Specific security charts used are for illustrative purposes only and are not a recommendation, offer to sell, or a solicitation of an offer to buy any security. Past investment performance does not indicate or guarantee future success. Returns will vary, and all investments carry risks, including loss of principal. This content is also not a research report and is not intended to serve as the basis for any investment decision. The information contained in this article does not purport to be a complete description of the securities, markets, or developments referred to in this material. Moomoo and its affiliates make no representation or warranty as to the article's adequacy, completeness, accuracy or timeliness for any particular purpose of the above content. Furthermore, there is no guarantee that any statements, estimates, price targets, opinions or forecasts provided herein will prove to be correct.
Options trading is risky and not appropriate for everyone. Read the Options Disclosure Document ( j.moomoo.com ) before trading. Options are complex and you may quickly lose the entire investment. Supporting docs for any claims will be furnished upon request.
Options trading subject to eligibility requirements. Strategies available will depend on options level approved.
Maximum potential loss and profit for options are calculated based on the single leg or an entire multi-leg trade remaining intact until expiration with no option contracts being exercised or assigned. These figures do not account for a portion of a multi-leg strategy being changed or removed or the trader assuming a short or long position in the underlying stock at or before expiration. Therefore, it is possible to lose more than the theoretical max loss of a strategy.
Moomoo is a financial information and trading app offered by Moomoo Technologies Inc. In the U.S., investment products and services on Moomoo are offered by Moomoo Financial Inc., Member FINRA/SIPC.
TradingView is an independent third party not affiliated with Moomoo Financial Inc., Moomoo Technologies Inc., or its affiliates. Moomoo Financial Inc. and its affiliates do not endorse, represent or warrant the completeness and accuracy of the data and information available on the TradingView platform and are not responsible for any services provided by the third-party platform.
Tesla Momentum Builds Post-EV Sales Surge: Why $500 is in Sight
Current Price: $439.31
Direction: LONG
Targets:
- T1 = $465.00
- T2 = $500.00
Stop Levels:
- S1 = $425.00
- S2 = $410.00
**Wisdom of Professional Traders:**
This analysis synthesizes insights from thousands of professional traders and market experts, leveraging collective intelligence to identify high-probability trade setups. Tesla’s stock continues to draw significant interest as traders align around the increasing demand for its electric vehicles and growing revenues from complementary businesses such as energy storage solutions, vehicle software offerings, and charging networks. Professional sentiment suggests that Tesla’s leadership in autonomous driving and robust infrastructure investments may drive further upside.
**Key Insights:**
Tesla’s strong positioning in the EV market has seen ongoing demand even in 2025 despite the tightening macroeconomic environment. Analyzing recent trading patterns, Tesla’s robust revenue growth across Q3 showcases resilience, supported by increased adoption of advanced batteries like the new-generation 4680 cells. The CEO’s remarks about scaling manufacturing facilities globally—especially the Gigafactory expansion in Mexico—carry forward the vision of doubling production capacity, stimulating long-term growth prospects. Tesla’s diversified revenue streams, including solar and energy storage products, provide an additional financial buffer as they tap into global sustainability trends.
The recent rally in the stock price further underscores positive investor sentiment, with large institutional inflows reflecting faith in Tesla’s brand and technological advantage. Additionally, the sustained consumer demand for higher-margin vehicles such as the Model X and S continues to buoy the stock’s fundamentals.
**Recent Performance:**
Tesla’s stock surged by approximately 6% over the past two weeks, recovering from previous volatility tied to concerns over EV pricing pressure. As of October 2025, Tesla’s improved gross margins—highlighted in the Q3 earnings call—provide relief and optimism, with the stock stabilizing above $430. High trading volume has reaffirmed consolidation zones, indicating strong levels of support near $420 while opening room for upside potential heading into the next fiscal quarter.
**Expert Analysis:**
Market analysts are bullish on Tesla following its strong Q3 beat on earnings-per-share estimates, confirming its profitability is intact despite pricing challenges and increased competition. Tesla’s use of AI in its Full Self-Driving (FSD) beta saw meaningful adoption rates recently, further increasing its moat against rival automakers. Additionally, Tesla’s financial prudence ensures that it remains one of the few tech-centric automakers able to consistently operate without dilutive equity raises.
Technicals reveal Tesla has formed a solid base above its 200-day moving average with an RSI currently neutral but trending bullish—signaling momentum for a further breakout. Resistance zones at $450 have been tested and surpassed, with the next confluence zone near $465 aligning estimates for an extended move higher.
**News Impact:**
Tesla’s announcement of upcoming fleet expansion and partnerships with global logistics firms significantly reinforce its scaling potential while easing investor worries about profitability. Furthermore, Tesla's transparency in discussing supply chain improvements during the Q3 earnings call lends credibility to its operational growth outlook. These factors, paired with advancements in autonomous driving technology, could bolster Tesla’s revenue potential in 2025 and further validate its premium valuation.
**Trading Recommendation:**
Based on technical analysis, recent financial performance, and strong fundamentals, Tesla presents a compelling LONG opportunity with targets set at $465 and $500, supported by growing market dominance and consistent operational excellence. Investors should watch for confirmation of support levels at $425 to manage risk effectively. With institutional confidence high, traders are well-positioned to benefit from Tesla’s growth trajectory as the company continues its strong performance in the EV market and sustainable energy sectors.
Do you want to save hours every week? Register for the free weekly update in your language!

$TSLA | Wave Count Outlook: 2025–2026 Projection👇
🔮 NASDAQ:TSLA | Wave Count Outlook: 2025–2026 Projection
The larger structure is forming a clean Elliott Wave sequence, suggesting a potential top near the completion of Wave (5) before a corrective phase unfolds.
🧩 Structure Overview:
Primary impulse appears complete between $527–$540
Corrective phase (ABC) projected toward $384 → $332 → $319
If confirmed, this would align with the macro liquidity contraction and potential market re-pricing post-Fed actions
🔍 Technical Confluence:
Wave (5) targets align with 1.236–1.618 Fibonacci extensions
RSI divergence already forming — early weakness
Volume momentum decelerating across higher timeframes
🧭 Outlook:
Short-term bias: Neutral to bearish
Medium-term (1–3 months): Potential correction toward $380s
Long-term (Q2–Q3 2026): Bullish resumption possible if liquidity stabilizes
“Wave completion precedes transformation — patience pays.”
#TSLA #ElliottWave #TechnicalAnalysis #Macro #VolanXDSS #WaverVanir

TSLA: Trade Plan 10/17/2025NASDAQ:TSLA – The Calm Before the Storm ⚡
Tomorrow could define the next leg. The structure is tight, momentum is fading, and macro pressure aligns with technical exhaustion.
Multi-Timeframe Outlook:
1D / 1W: Bearish continuation setup confirmed; equilibrium breached, liquidity void below remains unfilled (targets: $403 → $374).
4H / 15M: Series of lower highs with visible imbalance; RSI divergence confirms momentum exhaustion.
Fib Levels: 0.618 and 0.786 rejection zones hold — signaling institutional distribution rather than retail bounce.
VolanX DSS Probability Model
Bearish Probability: 82% (downward continuation)
Bullish Reversal Probability: 18%
Volatility Projection: +/- 4.6% intraday range expected
Macro & Catalysts
Rates & Yields: Rising real yields put pressure on high-beta tech.
Earnings Proximity: Market may be front-running a guidance downgrade.
Liquidity Flows: Options flow skewed toward puts since Oct 14 — institutional hedging confirmed.
Bias:
I’m fully committed to the short side here — structure, volume, and macro all align. “Go big or go home.”
If $428 fails to reclaim, the path to $403 → $374 opens.
🧠 This is my personal technical outlook, not investment advice.
#TSLA #TradingView #VolanX #AITrading #MacroStrategy #WaverVanir

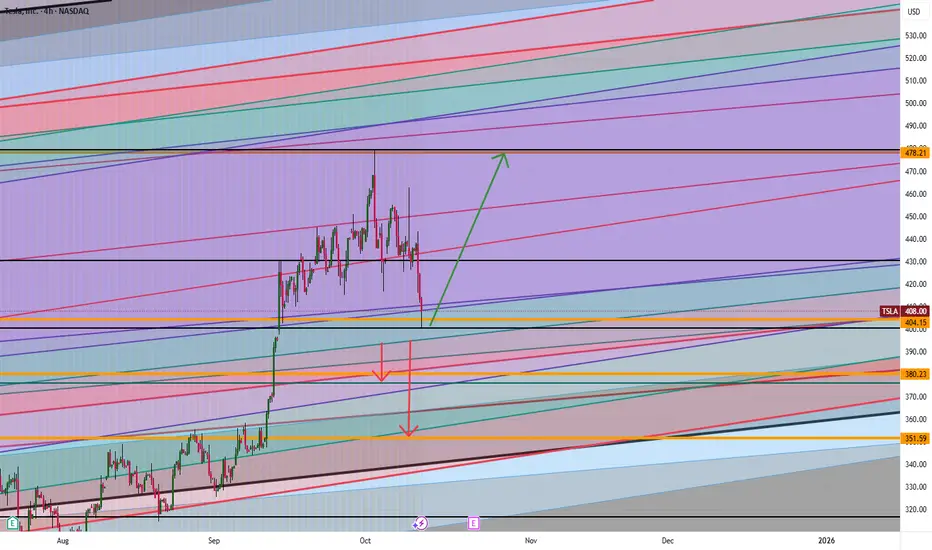
Tesla: Will It Blast Off or Fall Fast? The $404 Level Is the KeyTesla is at a big “make or break” point. If the price stays higher than $404, it could blast up to $437 or maybe even $478. But if Tesla drops below $404, watch out! It could fall down to $380 or even as low as $351.
Think about it:
What would you do if Tesla started moving toward those numbers? Do you think it will go up or will it go down?
If you’re not sure or have a question, send me a message! Sometimes asking one good question can help you make a smarter trade. What do you want to know about Tesla right now?
Mindbloome Exchange
TSLA 4hr Chart- Bullish Setup in Motion Ahead of Earnings Tesla (TSLA) is showing real strength heading into earnings week, closing Friday around $439.31 (+2.46%) with solid momentum. On the 4-hour chart, we’ve been trading inside a descending channel, and that’s important because while it may look bearish at first, this type of channel often leads to bullish breakouts once volume and structure align.
Right now, price is testing the upper side of that channel with a clean bounce from the recent demand zone and reclaiming both the 10 and 20 EMAs. That’s a strong technical sign heading into Monday.
Technical Breakdown
Pattern: Descending Channel (Bullish Continuation Potential)
Trend: Uptrend Confirmed
Momentum: Strong Buy (MAs showing 93.33%)
Oscillators: Leaning Bullish (27.27% Buy Bias)
Entry Zone: Around $435 – $438 (breakout retest area)
Stop Loss: Near $428 (below 61.8% Fib retracement)
Targets:
TP1 → $444.76
TP2 → $454.15
Extended Target → $469.95 (premium supply zone)
Resistance to Watch:
$443.52 – prior swing high
$454.15 – Fib confluence
$469.95 – premium zone and potential top block
Support Levels:
$428 – key breakout retest
$414 – lower boundary of the channel
$401 – major structure support
Heading Into Monday
Bulls are clearly back in control. The chart shows a steady reclaim of momentum with higher lows forming and volume starting to pick up. If price holds above $435, we could see continuation toward $444 – $454 early in the week. A breakout above $443.52 with strong volume would confirm that shift in momentum toward the next leg up.
If we see a short-term dip, I’ll be watching $428 – $414 as the key demand zone where buyers might reload before earnings.
Final Thoughts
Don’t sleep on descending channels — they often set up the biggest bullish reversals once the breakout happens. TSLA is sitting in that pocket right now, with multiple indicators flashing Strong Buy across timeframes. As long as $435 holds, this setup continues to favor the bulls into earnings.
Bias: Bullish
Timeframe: 4H leading into Monday
Expect some volatility, but the trend remains intact and momentum looks healthy.
📘 This is for educational purposes only and not financial advice. Always do your own research before making any trade decisions.

$TSLA: bullishNASDAQ:TSLA we were/are in a Wave-4 correction. If NASDAQ:TSLA drops after ER, it'd be a buying opportunity.
Wave 5 will take NASDAQ:TSLA to/near all time high.
I already have NASDAQ:TSLA shares. I plan to harness the high time premium by buy covered stocks at $440 strike, equivalent to $422.50, with upside limited to $17.50 per share.

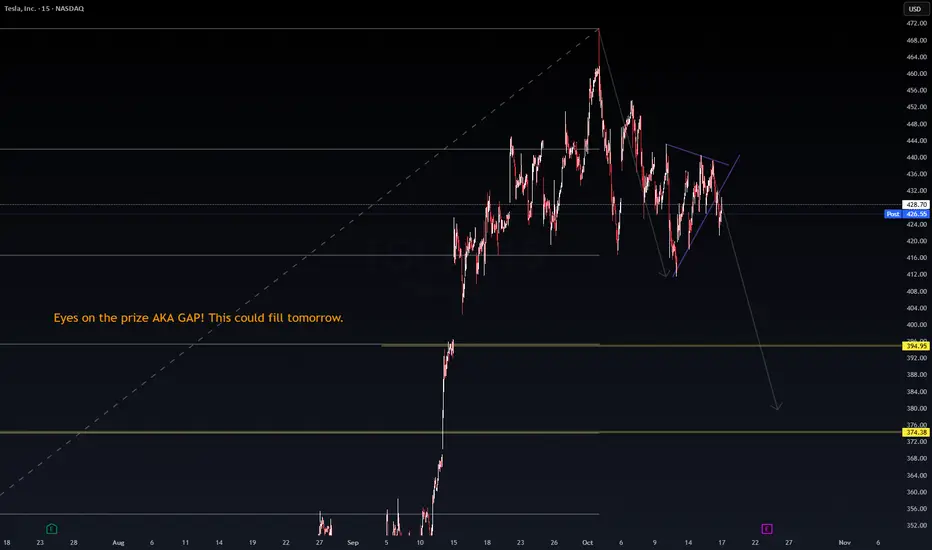
$TSLA Eyes on the prize — AKA the GAP NASDAQ:TSLA
Eyes on the prize — AKA the GAP 🧠
This imbalance could fill tomorrow if momentum continues downward.
RSI cooling off, structure leaning bearish, and that liquidity pocket below looks too tempting to ignore.
Just watching price react to the zone — not financial advice.
#TSLA #VolanX #GapFill #LiquidityZones #AITrading