$TSLA | Premium Rejection → Gap Fill WatchNASDAQ:TSLA ⚡ | Premium Rejection → Gap Fill Watch
We’re sitting right at the previous premium sell zone (~$454) — liquidity likely being tested.
Volume rising into resistance, RSI >70, and volatility increasing — signs of distribution.
If bears hold under 454, I expect a retracement toward $420 → $405 to fill the gap zone this week.
Only a confirmed close above 456 invalidates the bearish setup.
Gap fills usually move fast once liquidity flips — and this one has the volatility fuel to do it.
#TSLA #WaverVanir #VolanX #SMC #LiquidityMap #AITrading #SmartMoneyConcepts #Tesla
Trade ideas

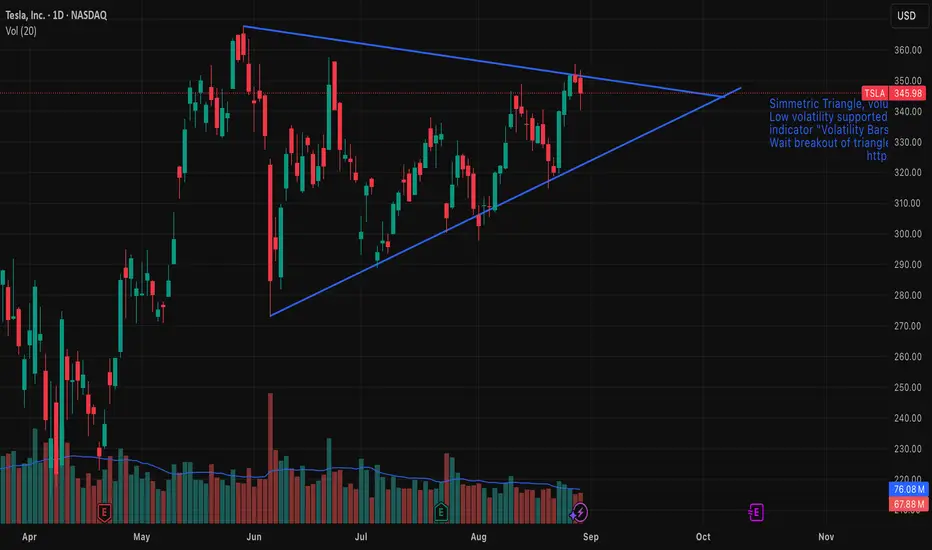
Tesla (TSLA) — Symmetrical Triangle Breakout IdeaSummary
Pattern: Symmetrical triangle on daily chart.
Expected timeframe for breakout: Within 1–2 weeks.
Targets: $367 on an upside breakout; $273 on a downside breakout.
Risk management: Use a stop-loss just outside the triangle after breakout confirmation; position size per your risk rules.
Setup & Rationale
A well-defined symmetrical triangle has formed on TSLA’s price action, characterized by converging trendlines connecting lower highs and higher lows. Volume has contracted inside the pattern, consistent with consolidation. Symmetrical triangles are neutral continuation/reversal patterns; the breakout direction provides the trading signal.
Key technical points:
Price is approaching the apex, increasing the likelihood of a decisive breakout in the next 1–2 weeks.
Volume decline during the consolidation and a volume spike on breakout would confirm conviction.
The breakout should be taken after a daily close beyond the upper or lower trendline (or after a retest), not merely intraday probes.
Entry Criteria
Upside trade: Enter long on a daily close above the upper trendline (or on a confirmed retest).
Downside trade: Enter short on a daily close below the lower trendline (or on a confirmed retest).
Targets & Measurement
Measure the pattern height (vertical distance between the initial high and low of the triangle) and project it from the breakout point.
Upside target (projected): $367.
Downside target (projected): $273.
Adjust targets proportionally if you use a measured move from the actual breakout point rather than the pattern’s maximum height.
Stops & Risk Management
Place stop-loss slightly outside the opposite trendline or beyond a recent swing point to avoid false breakouts.
Preferred approach: fixed-risk percent per trade (e.g., 1–2% of portfolio) and scale position size accordingly.
Consider tightening stops to breakeven after price clears ~50% of the distance to the target.
Confirmation: daily close beyond trendline plus above-average volume (up or down depending on direction).
Symmetrical triangles are neutral; false breakouts occur. Wait for confirmation.
News, earnings, or market-wide events can invalidate technical setups quickly—monitor catalysts.
Adjust targets/stops if volatility expands or if the breakout lacks volume confirmation.
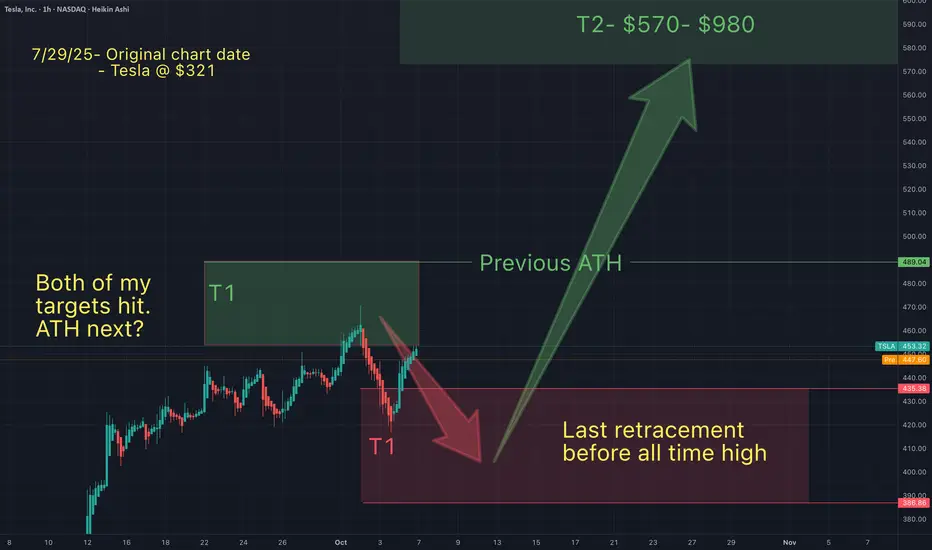
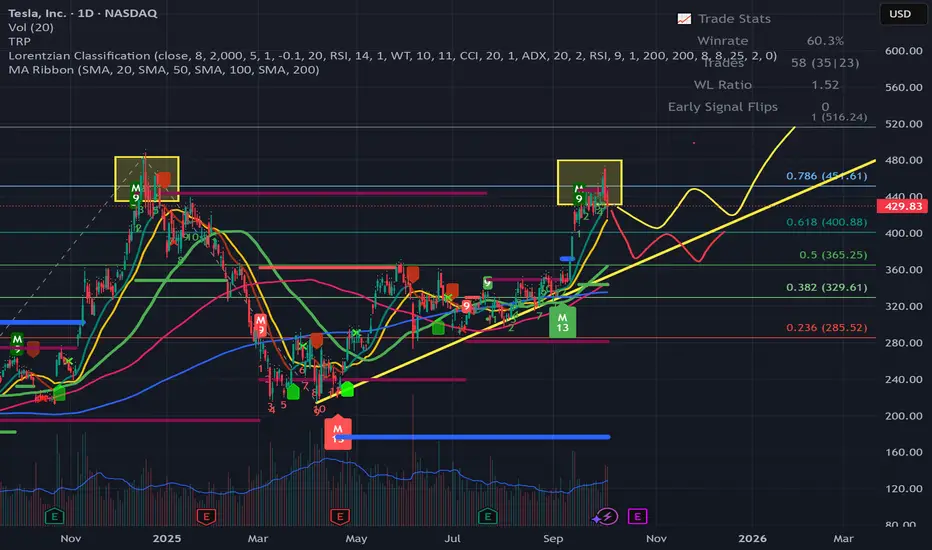
You will ask yourself "how did he know Tesla would do that"?On July 29th I suggested Telsa would follow a predicatble path. Price action has unfolded as anicipated every step of the way.
After a long run up, on Oct 1st I suggested that Tesla had topped at my green T1 and would retrace into my red support zone and bonce.
Now that this has played out, the only question that remains is Tesla going lower into my red T1...or simply all time highs from here?
Either way, Tesla may be about to melt faces (few & small retracements). For the next 2-10 weeks Tesla may form a blow off top (*"IF" Telsa continues this pattern). This blow off, will be the end of this bull pattern that I have been following since the April lows. Once Tesla hits my next range ($570-980) I expect a huge dump. I will monitor price action closely, once Tesla is in this next range.
May the trends be with you.
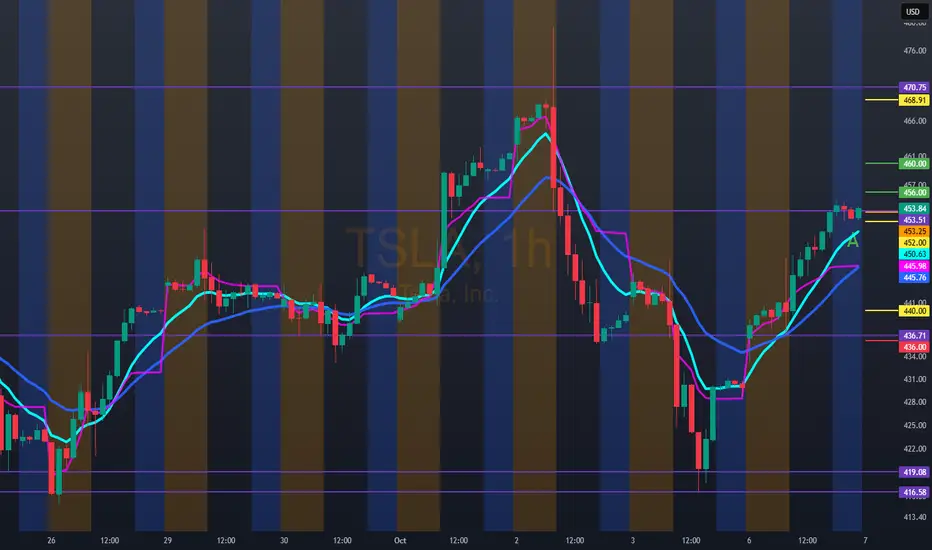
TSLA Oct 7 – At the Edge of a Breakout! Bulls Eyeing $460+ Zone15-Min Chart Analysis (Intraday Trading Setup):
TSLA is riding a sharp ascending wedge structure after a strong rally from the $420s. Price is consolidating near $453.84, right beneath the upper channel line around $455–$456, hinting at a potential breakout or short-term exhaustion.
The MACD remains elevated but is losing histogram momentum — suggesting that while buyers are still in control, short-term strength is cooling. Stoch RSI near 25 shows a possible reset before the next leg higher, a classic pattern after a big push.
If TSLA maintains support above $446.60–$448.00, bulls should watch for continuation toward $454.91 → $460. However, a break below $436.70 would invalidate the bullish micro-structure, potentially sending price toward $430–$428 to retest liquidity.
The 15-min chart shows buyers defending dips aggressively — indicating that institutions are still supporting price action within this rising wedge.
1-Hour GEX Confirmation (Options Sentiment Insight):
The 1-hour GEX data strongly supports the bullish thesis:
* Highest positive NETGEX / CALL resistance sits near $450, which TSLA has already reclaimed — a bullish confirmation that gamma is now supportive, not suppressive.
* CALL walls cluster between $455–$465, forming the next target zone if momentum persists.
* PUT walls remain heavy around $410–$420, providing a sturdy gamma floor.
This configuration reflects a bullish gamma landscape, where dealer positioning favors upward drift as long as TSLA holds above $445. The $450 reclaim may act as a launchpad toward the $460 gamma pocket.
My Thoughts:
TSLA’s recovery from sub-$430 levels shows aggressive reaccumulation and gamma reinforcement from institutions. The near-term wedge consolidation is a healthy pause — not weakness. If buyers can break above $455 with conviction, the next run toward $460–$465 could unfold quickly.
However, caution remains if TSLA slips below $446, as that would reintroduce downside gamma pressure, likely driving a retest of $436–$430 before finding demand again.
Options Outlook (Oct 7–11):
* Bullish setup: Consider 455C or 460C (Oct 11 expiry) if price breaks and holds above $455 with rising volume.
* Bearish scalp: Buy 440P only if price fails at $454.91 and loses $446.60 structure support.
* IV note: IVR 30.5 with IVx 70.1 — volatility remains high, so option premiums are rich; ideal for momentum plays, not range trades.
Conclusion:
TSLA is coiled for a decisive move. The 15-min wedge suggests momentum compression, while the 1-hour GEX map shows strong support below $440 and bullish gamma flow above $450. A confirmed breakout above $455 opens room toward $460–$465, with potential to squeeze higher this week.
Disclaimer: This analysis is for educational purposes only and does not constitute financial advice. Always do your own research and manage your risk before trading.

Hello trader, for tomorrow, TSLA: 453.25 10/07/2025 amBullish entry above 456.00/460.00 if the open is in this area. If the open is below 452.00, we can expect this to be the 440.00 area with a possible rebound, providing an upside opportunity. If the 440.00 level is lost, we can only enter bearishly below 436.00/432.00 (a possible downside target of 419.00) (a possible upside target of 488.54)
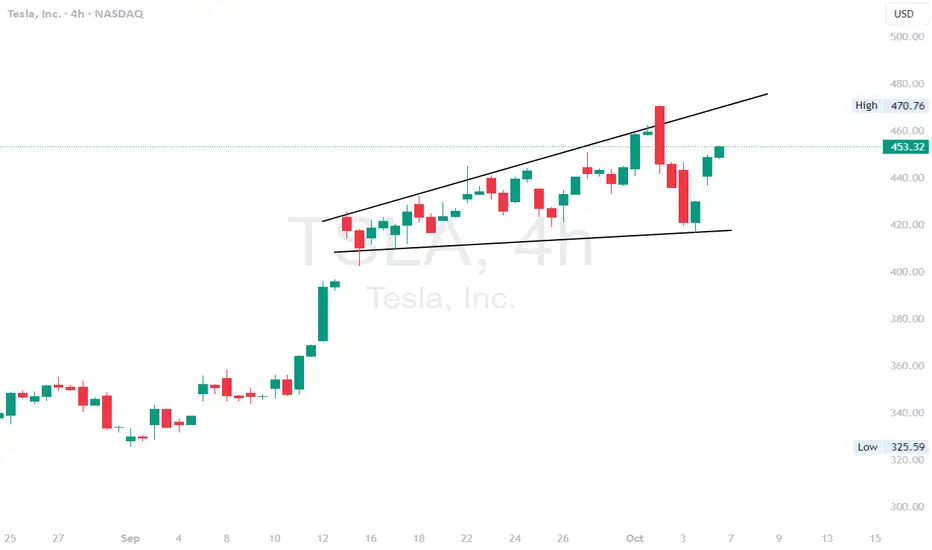
$TSLA - possible move pre product launchTSLA - Stock moving higher pre product launch tomorrow. Seeing multiple call buyer coming in as well. Stock is in a triangle pattern on the 4 hour time frame bouncing off bottom of the channel. Stock has top of the channel is at $470. bigger move about that level. Stock is decent at the indicator level.
TSLA: As planned...If it isn't obvious to us all by now why we're receiving "surprises", and major company updates after EV credit's are removed, and while sitting at the precipice of all time highs ... These announcements have been prepared long in advance and in anticipation of the EV tax credit's being removed. These "more affordable" vehicles are already in production... The prices are set... FSD v.14 will go mainstream.
This is all just another step towards supplying the roads with as many Tesla's as possible (whilst maintaining profitability on vehicle sales) to continue the ramp towards autonomy at scale.
Perhaps 10/7 is a sell the news event, but this news cycle is worth its shot to push past resistances and sell side pressure.
All I can say is that I am buying as much as I can in this range and definitely anything below the range.
These are my long term perspectives.

Tesla correction and buying opportunityAs Tesla looks as it has completed a five wave impulse, I expect it to correct tell the end of the year when it will be a buying opportunity once it reaches the red box

Tesla Approaching Key Resistance: Time to Position for a BreakouCurrent Price: $429.83
Direction: LONG
Targets:
- T1 = $445.50
- T2 = $460.00
Stop Levels:
- S1 = $420.00
- S2 = $410.00
**Wisdom of Professional Traders:**
This analysis synthesizes insights from thousands of professional traders and market experts, leveraging collective intelligence to identify high-probability trade setups. The wisdom of crowds principle suggests that aggregated market perspectives from experienced professionals often outperform individual forecasts, reducing cognitive biases and highlighting consensus opportunities in Tesla.
**Key Insights:**
Tesla continues to dominate the EV (electric vehicle) market with innovations in autonomous driving and battery technology. Analysts are focusing on the recent announcements about significant manufacturing cost reductions and Tesla's newly introduced Cybertruck deliveries, which are expected in Q4 2025. These developments solidify its position as a leader and provide a catalyst for improving margins. Furthermore, the continued expansion into the energy storage market will diversify revenue streams, offering resilience to economic variations.
From a technical perspective, Tesla is approaching a critical resistance level near $435. If broken, this level could trigger a significant upward momentum as bullish sentiment builds. The recent holding of support above $420 suggests strong institutional confidence in Tesla’s upward potential.
**Recent Performance:**
Tesla’s stock has risen approximately 15% over the last three months, recovering from a dip earlier this year when macroeconomic uncertainty temporarily pressured high-growth tech firms. The stock has shown consistent strength as it rebounded from the $380 level after weaker-than-expected Q2 earnings but has since been buoyed by a positive outlook for Q4. Tesla has seen increased volume in recent weeks, signaling growing trader attention.
**Expert Analysis:**
Many equity analysts remain bullish on Tesla's mid-term trajectory. The company’s recent Q3 earnings report (released last month) revealed impressive year-over-year growth in energy division revenues, while automotive gross margins remained steady despite pricing pressures in China. Technical strategists view the current consolidation just below $435 as preparation for the next leg upwards. Tesla's RSI (Relative Strength Index) remains below overbought levels, leaving room for additional bullish momentum.
**News Impact:**
The announcement of Tesla's advancements in Full Self-Driving (FSD) technology has renewed market interest. Achieving regulatory approval for autonomous driving in key markets like Europe and the U.S. could dramatically expand Tesla's total addressable market. Meanwhile, Elon Musk’s comments on Tesla’s potential new factory locations have reignited speculation about the company’s growth strategy, fueling optimism among investors.
**Trading Recommendation:**
Given Tesla’s strong fundamentals, positive technical setup, and upside potential, initiating a long position at current levels may lead to substantial gains. Traders should watch for a break above $435, which could pave the way for a move to $445.50 (T1) and possibly $460 (T2). Use stops at $420 (S1) and $410 (S2) to manage downside risk effectively. Tesla's position as a market leader, combined with its technical momentum, makes this an attractive opportunity for the current trading window.
Do you want to save hours every week? Register for the free weekly update in your language!
TSLA Testing Critical Support — Will Bulls Reclaim? Oct. 6⚡️
Market Context & Overview (15-Min Chart)
TSLA has been under steady selling pressure, sliding from the $446–450 resistance zone toward the $416–420 support. The 15-minute chart reveals a clear short-term downtrend, marked by a descending trendline and a series of lower highs. However, buyers finally showed signs of life late Friday, creating a rebound attempt above $425 — a minor but notable shift in momentum.
The MACD histogram has turned positive, and the blue line has crossed over the red, suggesting early bullish momentum building up after a short-term exhaustion. The Stoch RSI has curled upward from oversold territory, hinting that the stock may be setting up for a relief bounce if the intraday trendline breaks cleanly above $432–$435.
GEX Confirmation (1H Chart Insight)
The 1-hour GEX (Gamma Exposure) chart adds an important institutional perspective. The highest positive NET GEX sits between $446–$452, aligning with the 2nd and 3rd CALL walls — a significant resistance area where dealer hedging can dampen upside movement unless a strong breakout occurs.
On the downside, heavy PUT walls and support zones rest around $416–$405, reinforcing this as the critical defense zone for bulls. If price holds above $416 early this week, a short-term reversal toward $440+ becomes highly probable as option dealers shift their delta hedging upward.
IVR remains moderate (26.7), with CALL positioning at 62.9%, suggesting sentiment still leans bullish, though not extreme.
Trade Scenarios (for This Week)
Bullish Case:
If TSLA breaks and sustains above $435, expect momentum to accelerate toward $446, and possibly $452, where the next CALL wall sits.
* Entry: Above 435 confirmation
* Target 1: 446
* Target 2: 452
* Stop-Loss: Below 425
Bearish Case:
If price fails to reclaim 435 and breaks back below $420, sellers could retest $416 and possibly sweep toward $405, which is the major PUT support level on GEX.
* Entry: Below 420
* Target 1: 416
* Target 2: 405
* Stop-Loss: Above 430
Options Insight
Given the GEX structure, short-term calls near 430–440 could benefit from a quick bounce play if momentum continues early in the week. Conversely, puts near 420 become favorable only if TSLA fails to break the descending trendline. A balanced gamma landscape this week may create a “whipsaw” environment, so avoid chasing extremes — trade confirmation, not prediction.
My Thoughts: This setup feels like a “pressure build” zone — bears losing momentum but bulls not yet commanding control. A breakout from the descending trendline will likely dictate the week’s tone. The key is whether TSLA can convert $430–$435 into support. A sustained hold above that could quickly trigger gamma-driven buying back toward the mid-$440s.
If it rejects again and volume fades, the PUT side could reload, making $416 the final line before a larger flush. Watch that MACD and Stoch RSI cross — they’re early tells of rotation strength.
Disclaimer:
This analysis is for educational purposes only and does not constitute financial advice. Always perform your own due diligence and manage risk responsibly before trading.
TESLA PRICE ACTION 5th OCTOBER 2025Price action for Tesla is here. I have clearly explained my plan on how to trade tesla considering every factor in market.
NOTE: OPTION WILL BURN YOUR CAPITAL

Tesla (TSLA) – Final Wave 5 to Complete Cypher HarmonicTesla is progressing through its final impulsive Wave 5, with upside targets aligning at $563–$564, confluencing with the 1.272–1.618 Fib extensions and the completion of the Cypher harmonic (point D). Once this target is reached, a corrective decline is anticipated, forming the Cypher retracement and potentially filling untested gaps below.
Key levels to watch:
Upside target: $488.5, then $563–$564 zone (Cypher completion).
Downside retracement: possible move back toward the $350–$360 region (0.618–0.786 support).
Invalidation:
A breakout above $565 would invalidate the Cypher completion zone and suggest extended bullish continuation.
A breakdown below $400 before reaching $488 invalidates the Wave 5 structure.
This scenario blends Elliott Wave 5 projections with harmonic Cypher confluence for a potential high-probability setup.

TSLA - Tesla - Possible Pull-Back to 400 or 365Hello Everyone , Followers
Tesla is the second one that i would like to mention today.
It hit the Resistance level of 451 and then it did not achive to break this level.
Now i am expecting 2 possible scenario
Yellow pattern : pull back till 400 and get power from this level and try to break 451 again.
Or Red Pattern : pull back till 365 then get support from trend line and go up again and try to break 451.
If it breaks the 451 then next station is 515 - 516 .
All in all , i am expecting the Pull-back next week and you could follow the price levels that you can see in Chart. I am neutral in Tesla for the time being.
This is just my thinking and it is not invesment suggestion , please do not make any decision with my anaylsis.
Have a lovely Sunday to all.
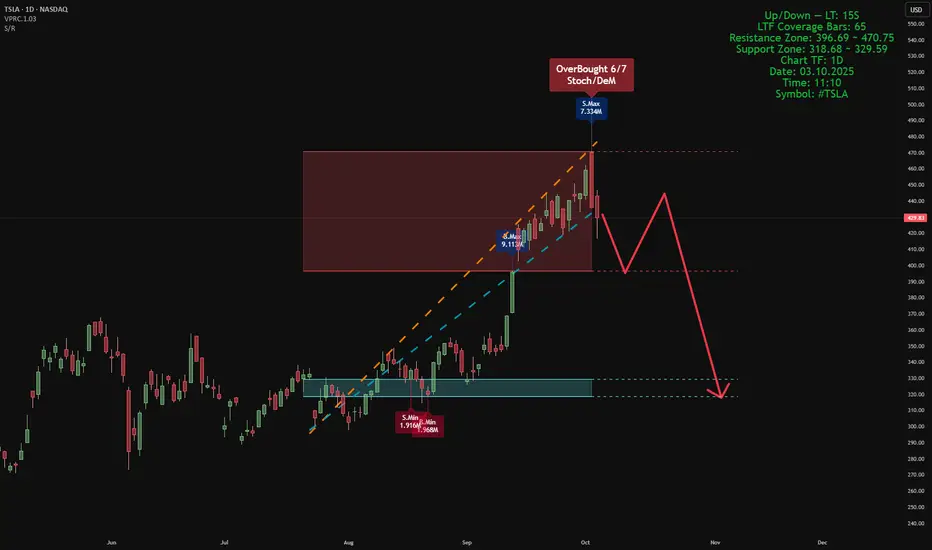
Smart Money Support/Resistance + ATAI Volume Analysis —PracticalApplication
When these two indicators work together — Smart Money Support/Resistance (Lite) and ATAI Volume Analysis with Price Action — the chart begins to speak a clearer language: one defines where the reaction zones form, and the other explains what happens inside them. The purpose is not prediction but understanding the balance between smart money pressure and retail momentum.
1. Parameter Alignment
On the right side of the chart, the green info panel confirms that both indicators share identical configurations. In this example, the lookback period is set to 52, chosen deliberately because it must be smaller than the total number of LTF coverage bars (65). For the Smart Money Support/Resistance indicator, the projection is set to 26 — extending the detected zones forward without adding excessive visual noise. This alignment is crucial; mismatched parameters can desynchronize volume readings and structural boundaries.
2. Reading the Chart
In this sample chart, the upper red area represents a Smart Money resistance zone — a region of concentrated selling pressure detected from lower timeframe volume. Simultaneously, ATAI Volume Analysis signals an Overbought (6/7) condition, meaning multiple oscillators confirm exhaustion while seller volume (S.Max) begins to outweigh buyer volume (B.Min). This overlap suggests that liquidity has shifted and the prior bullish impulse is weakening. From here, price may consolidate within the zone or initiate a structured retracement toward the blue support area, previously defined by accumulation volume. The red projected path simply visualizes one potential structural scenario; it is not a prediction or trade signal.
3. Broader Context
This example serves only as a demonstration of how these two tools interact when properly tuned. Different assets and timeframes naturally yield unique structures and behaviors, yet the principle remains consistent: define the territory first with Smart Money Support/Resistance, then interpret market behavior within it using ATAI Volume Analysis.
This content is for educational purposes only — not financial advice. User feedback and practical observations play a key role in refining future versions of both indicators.
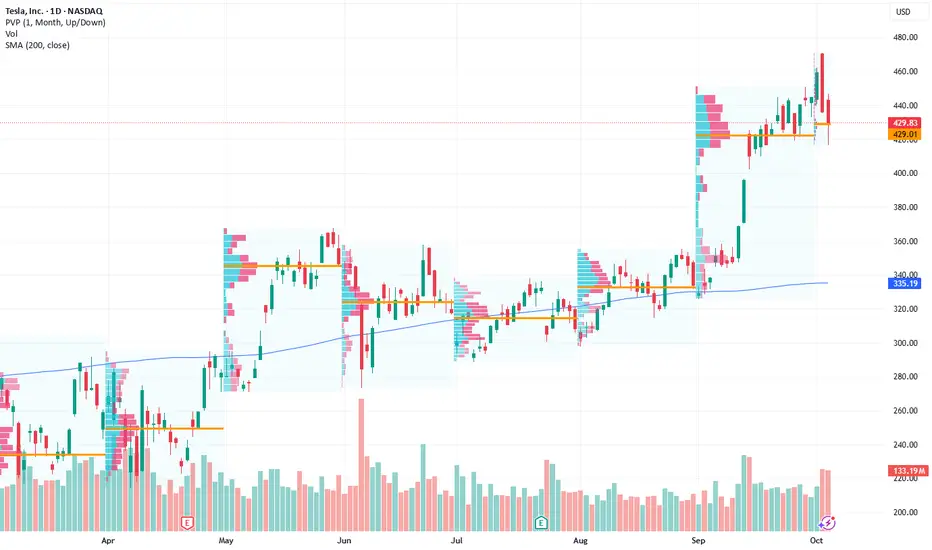
$TSLA — Structural Forecast + Macro & Catalysts ContextNASDAQ:TSLA – Macro, Technicals & Institutional Confluence ⚙️
📍 Current Price: $429.83
📊 Timeframe: 1D
🧠 Model Context: VolanX Institutional Forecast v2.3
Technical Setup
Tesla has been moving inside a well-defined ascending channel, currently testing the upper boundary near $460–$470, consistent with a premium liquidity sweep.
Price is slightly below its 10-day SMA ($437.99) but remains well above the 50-day ($363.66) and 200-day ($335.19) — confirming a strong medium-term trend.
RSI (~59–60) cooled off from overbought levels, suggesting a healthy pause rather than reversal.
The near-term risk is a retracement to the equilibrium zone ($414–$376), matching structural and moving-average support.
Macro & Catalysts
EV Demand Pulse: Q3 deliveries boosted by expiring U.S. EV tax credit — short-term tailwind but may front-load demand.
Robotaxi & FSD Expansion: Pilot rollout in Austin marks long-term disruption potential, but regulatory friction remains.
Next-Gen Platform: New low-cost “Cybercab / Model 2” architecture expected to reshape Tesla’s cost curve into 2026.
Competition & Margins: BYD, NIO, and European EV makers pressing pricing power; tariff impacts remain a headwind.
Macro Headwinds: Higher rates and policy uncertainty could compress valuations in growth sectors.
Institutional View (VolanX DSS)
Short-term bias: Controlled pullback to equilibrium (414–376).
Medium term: Reaccumulation phase as institutions rebalance.
Long term: Expansion target near $514+ once liquidity resets and RSI re-enters strength above 60.
“My models can project structure — not human emotion.
If fear overshoots $414, it may mark the next institutional entry before expansion.”
🧠 Structure always rebalances. Emotion never does.
#TSLA #VolanX #SmartMoney #AITrading #LiquidityZones #Macro #FSD #MarketStructure #TechnicalAnalysis

TSLA - False breakout?TSLA back in the april channel.
In this market everything is anchored from low of April I feel and I have drawn a vwap band from the April lows which spans from 316-333 which can be the next bounce zone in case price pulls back , this is where TSLA made base before the next leg up.
Most likely price may revisit $400 area to gap fill and also has a anchored vwap from last swing low around 405.
So far seems like a false breakout from the channel and volume has really picked up to the downside in recent days. New base can be formed around 400 mark if thing stabalize for next leg up in coming days, lets see as its tsla.
For more chart requests please ping me on X - vickg81.

TSLA: Last chance under $500, $400Nice run up. We're still in a overall bull market, which Tesla has only started becoming a part of.
We could see a gap fill (seen on the daily and weekly chart) at ~$395. Potentially even a retracement to ~$350.
However, we'll eventually see the stock above 600 in the next year or more. Don't know when.... Could ltake more time, but I think the "more affordable" Model Y will be the first catalyst before any Robotaxi revenue comes in.
Strategically it makes sense to release the more affordable EV after the tax credits go away. No other EV manufacturer OR legacy auto company can produce and sell vehicles as cheaply as Tesla without it.
Haters truly will hate it.

TSLA Roadmap: $563 ABCD Compl → Bat Harmonic → $631 Three-DriveTesla (TSLA) appears to be completing its final impulsive wave toward the $563 region, which also aligns with the D point completion of the ABCD harmonic pattern.
Once this move is finished, the expectation is for a corrective phase that forms a Bat harmonic. This retracement would also work to fill in the untested gaps left behind during the recent rally, with a potential bottom around the 78.6% Fibonacci level.
From there, the next bullish leg could initiate, targeting the 127.2% extension at $631. This move would not only confirm the harmonic reversal but also complete a larger Three-Drive pattern that originates from the initial ABCD structure.
Key Levels to Watch:
ABCD Harmonic D point: ~$563
Bat Harmonic completion zone: ~78.6% retracement
Next rally target: $631 (127.2% extension, Three-Drive pattern confirmation)
Invalidation Scenarios:
A clean breakout above $563 without corrective rejection would invalidate the Bat harmonic setup and suggest an extended bullish run.
A failure to hold above ~$367 (channel/structure support) would weaken the harmonic roadmap and risk a deeper bearish continuation instead of a Three-Drive completion.
This roadmap suggests a critical short-term top before a deeper correction sets the stage for a much larger rally.

IS TESLA ABOUT TO HAVE A SHORT SQUEEZE SOON? HERE'S WHEN!!!In this video we discussed the possibility of Tesla taking another leg higher beyond $500 and what technical signals to look out for in the charts

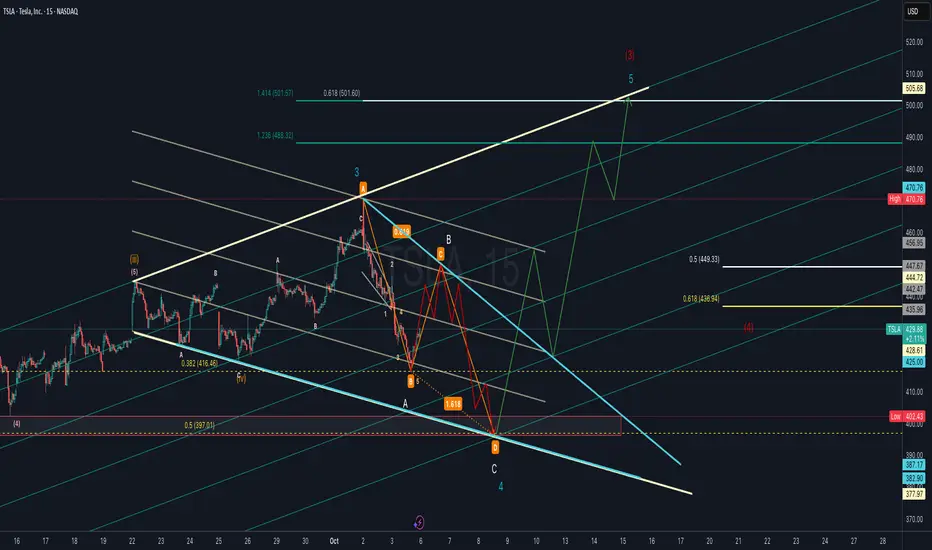
TSLA Elliott Wave Count with ABC Harmonic or Flat Corrective Tesla (TSLA) is forming a potential Wave 4 correction that aligns with an ABC harmonic structure. Price action suggests a possible deeper retracement into the 0.5–0.618 Fibonacci support zone (436–449 area) before resuming its larger uptrend.
If Wave 4 completes near the harmonic “D” zone (highlighted support box), the next leg higher could target the 1.236–1.414 Fibonacci extensions around 488–501, in line with Wave 5 projection.
Key levels to watch:
Support: 436.9 (0.618 retrace), 425 psychological, 397 strong support.
Resistance: 444.7, 470.8 (previous high), 501–505 (Wave 5 target).
Bullish scenario: Wave 4 completes soon, leading to a strong Wave 5 breakout towards 500+.
Bearish scenario: Breakdown below 425–397 support could invalidate the bullish count and extend correction lower.
The other possibility is that it is actually unfolding a flat correction in Wave 4 after completing Wave 3 near the recent high. The structure suggests price may continue to consolidate within the corrective channel before setting up the next impulse leg.
Bullish scenario: Flat correction completes, setting the stage for Wave 5 rally toward 490–505.
Bearish scenario: Breakdown below 397 invalidates the bullish count and signals deeper retracement.
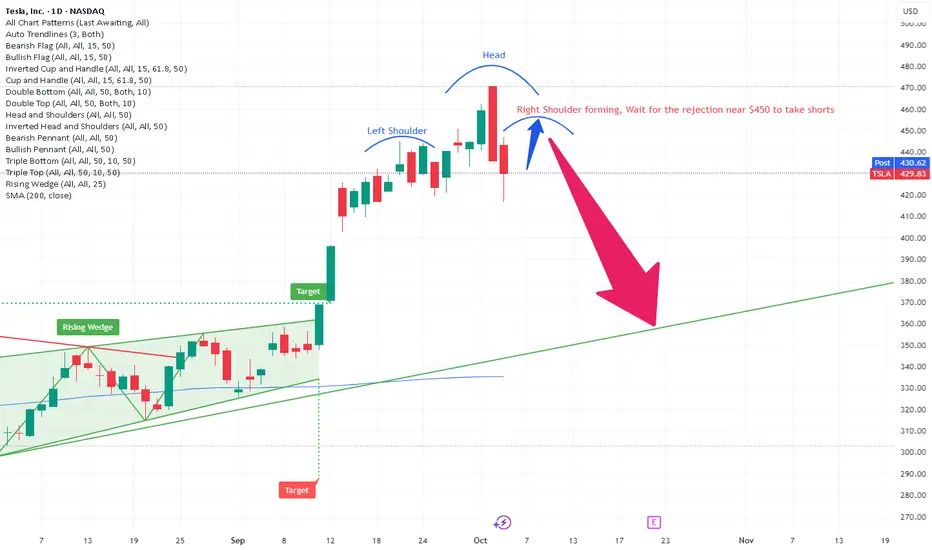
$TSLA H&S FORMING on DAILYHas NASDAQ:TSLA topped ? Maybe it has.
Looking for pullback to 380-376 area if 440 or 450 is rejected.
H&S pattern forming on daily.
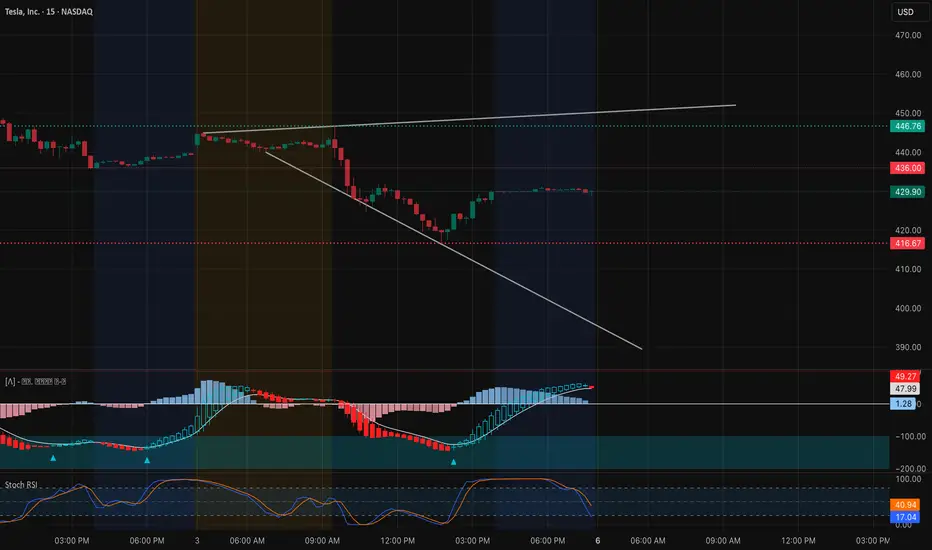
$TSLA – 15m Downtrend Channel📊 NASDAQ:TSLA – 15m Downtrend Channel
Price stuck in a descending channel, now consolidating around 429. Short-term candles showing a pause, but momentum still bearish.
🔽 Bearish Path (favored):
Rejection below 433–434 fib zone keeps pressure down.
Downside targets:
424.7 (fib 1.0)
419–416 zone
Major magnet: 411 (fib 1.618 extension).
🔼 Bullish Path:
Breakout above 434 trendline → relief bounce possible.
Next upside checkpoints: 436 / 439 / 443.
⚖️ Summary:
Trend still bearish until 434+ reclaimed.
411 remains key downside liquidity level.

$TSLA Fake out Cleared out my Calls this morning in the spike before the drop. Now downside is looking good. Waiting for a quick bounce before jumping in possibly. NASDAQ:TSLA
