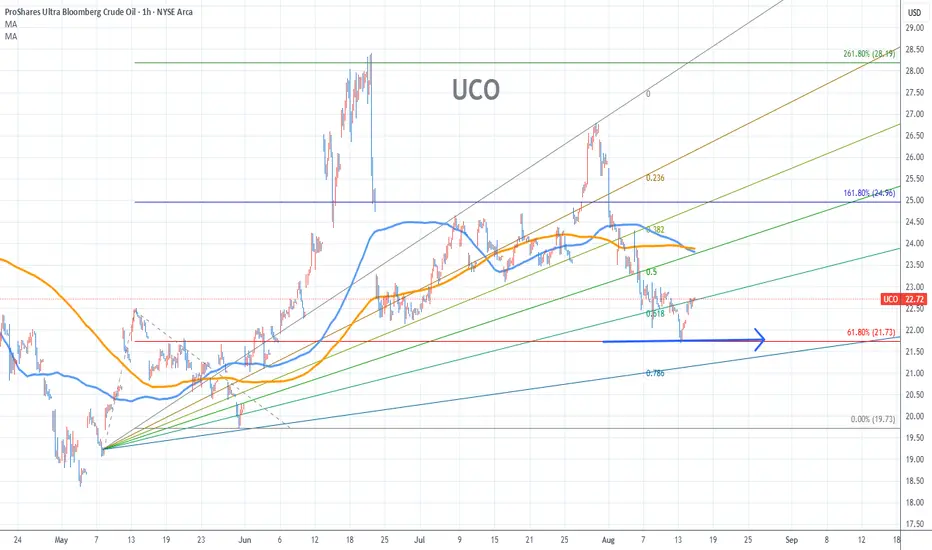
UCO Stock Chart Fibonacci Analysis 081425Trading Idea
1) Find a FIBO slingshot
2) Check FIBO 61.80% level
3) Entry Point > 21.7/61.80%
Chart time frame:B
A) 15 min(1W-3M)
B) 1 hr(3M-6M)
C) 4 hr(6M-1year)
D) 1 day(1-3years)
Stock progress:C
A) Keep rising over 61.80% resistance
B) 61.80% resistance
C) 61.80% support
D) Hit the bottom
E
Key stats
About ProShares Ultra Bloomberg Crude Oil
Home page
Inception date
Nov 25, 2008
Structure
Commodities Pool
Replication method
Synthetic
Dividend treatment
Distributes
Distribution tax treatment
No distributions
Income tax type
60/40
Max ST capital gains rate
27.84%
Max LT capital gains rate
27.84%
Primary advisor
ProShare Advisors LLC
Distributor
SEI Investments Distribution Co.
ISIN
US74347Y8883
UCO seeks double the return of its futures-based index on a daily basisreflecting both the returns due to price changes on WTI futures contracts as well as any return (positive or negative) from rolling those futures contracts. As a geared product, UCO is designed for a one-day holding period, it`s not appropriate for buy-and-hold investors. Daily compounding can lead to the fund`s returns varying significantly from those of the index over holding periods of greater than one day. UCO is a great choice for a leveraged energy play.
Related funds
Classification
What's in the fund
Exposure type
Cash
Bonds, Cash & Other100.00%
Cash100.00%
Top 10 holdings
UCO in Buy ZoneMy trading plan is very simple.
I buy or sell when at three of these events happen:
* Price tags the top or bottom of parallel channel zones
* Money flow spikes beyond it's Bollinger Bands
* Stochastic Momentum Index (SMI) at near oversold overbought level
* Price at Fibonacci levels
So...
Here's

UCO Stock Chart Fibonacci Analysis 021125Trading Idea
1) Find a FIBO slingshot
2) Check FIBO 61.80% level
3) Entry Point > 28/61.80%
Chart time frame: B
A) 15 min(1W-3M)
B) 1 hr(3M-6M)
C) 4 hr(6M-1year)
D) 1 day(1-3years)
Stock progress: A
A) Keep rising over 61.80% resistance
B) 61.80% resistance
C) 61.80% support
D) Hit the bottom
E

Slowly starting to scale in on OILThe fundamental outlook for oil is looking bullish. Despite seasonality favoring lower crude oil prices towards the end of the year, the conflicts in the Middle East are pushing prices higher.
Technically, the downward move that has been in place since the beginning of July could now experience a co

UCO to $30MODs have suggested that I provide more detail about the picks I make.
Sorry. I'm not as verbose as y'all, and I don't like things to be complicated.
My trading system is very simple.
I buy or sell at top & bottom of parallel channels.
I confirm when price hits Fibonacci levels.
Bonus if a TTM


Crude Oil trade setup for 2024 🛢️I expect the oil price can find a reversal from here. The demand for oil will improve as the global economy starts to improve on the backdrop of lower interest rate levels. This is my outlook for the next 12-month hold period.

UCO a crude oil ETF LONGUCO popped in April and then dropped into a consolidation in May and June where
it set up a base shown by the POC line on the volume profile. Once over the POC
on July 6th on the daily chart coinciding with a golden cross on the HMA 56/210
combination the bull trend began. The dual time frame R

updated UCO / Oil - going to break, soonthis an update to my prior post, and shows we are compressing quite hard. Look for a break, soon.

A triangle in a triangle. Ride the wavei think oil is going to break up and out. UCO is a great way to play it. Hopefully this is helpful.

See all ideas
Displays a symbol's price movements over previous years to identify recurring trends.
Frequently Asked Questions
An exchange-traded fund (ETF) is a collection of assets (stocks, bonds, commodities, etc.) that track an underlying index and can be bought on an exchange like individual stocks.
UCO assets under management is 393.46 M USD. AUM is an important metric as it reflects the fund's size and can serve as a gauge of how successful the fund is in attracting investors, which, in its turn, can influence decision-making.
Since ETFs work like an individual stock, they can be bought and sold on exchanges (e.g. NASDAQ, NYSE, EURONEXT). As it happens with stocks, you need to select a brokerage to access trading. Explore our list of available brokers to find the one to help execute your strategies. Don't forget to do your research before getting to trading. Explore ETFs metrics in our ETF screener to find a reliable opportunity.
UCO invests in cash. See more details in our Analysis section.
UCO expense ratio is 1.43%. It's an important metric for helping traders understand the fund's operating costs relative to assets and how expensive it would be to hold the fund.
Yes, UCO is a leveraged ETF, meaning it uses borrowings or financial derivatives to magnify the performance of the underlying assets or index it follows.
No, UCO doesn't pay dividends to its holders.
UCO shares are issued by ProShare Advisors LLC
UCO follows the Bloomberg Commodity Balanced WTI Crude Oil Index. ETFs usually track some benchmark seeking to replicate its performance and guide asset selection and objectives.
The fund started trading on Nov 25, 2008.
The fund's management style is passive, meaning it's aiming to replicate the performance of the underlying index by holding assets in the same proportions as the index. The goal is to match the index's returns.