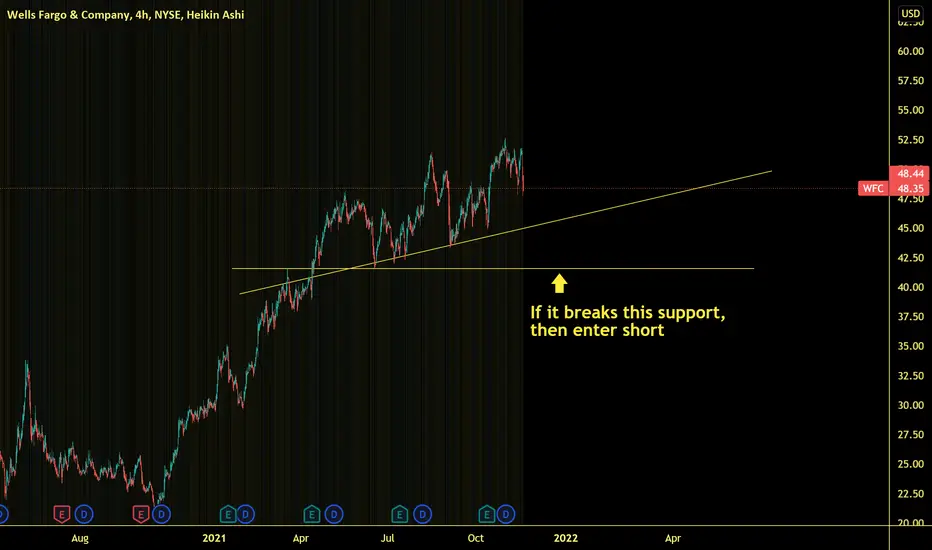
Set alert for WFCIf WFC breaks this support line then it's confirmed trend reversal to the downside.
I only enter trades once they meet my conditions.
Would prefer to enter a leap put options on this one and ride the fall out as WFC is a bit of a slow mover.
Slow-moving stocks require long expiry contracts to medicate theta decay.
So set an alert for that support line.
Wells Fargo & Company Depositary Shares, each representing a 1/1,000th interest in a share of Non-Cumulative Perpetual
No trades
Trade ideas

(US) WFC VCP SETUPWFC observed to have VCP setup with below contraction:
C1: -15%
C2: -7%
C3: <3% (pull back with low volume)
28 Oct observed tennis ball effect and breakout again. Let's see the subsequent movement.
Disclaimer:
Not a buy call recommendation, just sharing on chart pattern formation based on my personal experience. Trade at your own risk.

Wells Fargo at the resistance!Does WFC have enough energy to pass above the resistance?
I think it is less likely, volume does not support this idea!
The higher it goes the lower the volume, it seems to move toward lower prices in the coming days!
Best,
Moshkelgosha
DISCLAIMER
I’m not a certified financial planner/advisor nor a certified financial analyst nor an economist nor a CPA nor an accountant nor a lawyer. I’m not a finance professional through formal education. The contents on this site are for informational purposes only and do not constitute financial, accounting, or legal advice. I can’t promise that the information shared on my posts is appropriate for you or anyone else. By using this site, you agree to hold me harmless from any ramifications, financial or otherwise, that occur to you as a result of acting on information found on this site.

WFC is a bit hot on the RSI, MACD… see highlighted areasSimilar to TSLA, WFC has been on an oversold then overbought momentum swing. Albeit, TSLA had a long consolidation time as did WFC back in November 2020 to June 2021. It’s time for a rotation back into cyclicals for their best quarter of earnings, but WFC is super hot and likely needs to come back down to mid-39 or even mid-48 before the fed meeting. Which I think just prior or at it will pause around mid-49 and run to 52-54 if they begin to taper bond purchases… they could be more aggressive on these which would signal or give the perception that rate hikes could come earlier and the FED are trying to stop that from happening. Either way I’m hopeful for 52-54 by EOY/January 2021. Look to purchase calls for 50 strike out for march to 2023/2024… always love to play it safe with the long term game. Obviously shorter timeframe means more risk… “not financial advice” … don’t get wtf people say that other than morons assume a written monologue about their thoughts/diary on trading is gold. Manage you’re own risk.

WFC longEntry price: 48-50$
Target price: 54-55$
Chart pattern: Bullish symmetrical triangle. The price just broke the upper boundary of triangle and retested that level as a support. Moreover, the price breakout was confirmed by increased volume.
RSI: Neutral, approaching 60 level, thus, there is still a potential for the future growth.
Conclusions: Chart pattern and RSI suggest bullish momentum of the asset. Therefore, the long position is recommended after the price breakout.
No financial advice

Wells Fargo (WFC) bullish scenario:The technical figure Triangle can be found in US company Wells Fargo (WFC) at daily chart. Wells Fargo & Company is an American multinational financial services company. The company has operations in 35 countries with over 70 million customers globally. It is considered a systemically important financial institution by the Financial Stability Board. The Triangle has broken through the resistance line on 16/10/2021, if the price holds above this level you can have a possible bullish price movement with a forecast for the next 15 days towards 49.96 USD. Your stop loss order according to experts should be placed at 44.83 USD if you decide to enter this position.
Risk Disclosure: Trading Foreign Exchange (Forex) and Contracts of Difference (CFD's) carries a high level of risk. By registering and signing up, any client affirms their understanding of their own personal accountability for all transactions performed within their account and recognizes the risks associated with trading on such markets and on such sites. Furthermore, one understands that the company carries zero influence over transactions, markets, and trading signals, therefore, cannot be held liable nor guarantee any profits or losses.

Wells Fargo update H&S pattern invalid now with bounce. Next significant resistance is at 48.91.
Long over 49$ with 55.56 next target going forward.
If there is a rejection short back to trendline support or 43.50 fib support.
Fibonacci obtain from using Jan 2018 high and Nov 2020 low

Wells Fargo: Long Trend, ready to head to 54Long to 54…. EOY I hope. Maybe January since Feb is the worst month for markets. I’ve got over 500 calls between Jan 2022 and Mar 2022 at 50 strike. Just a trend… do with it as you please.


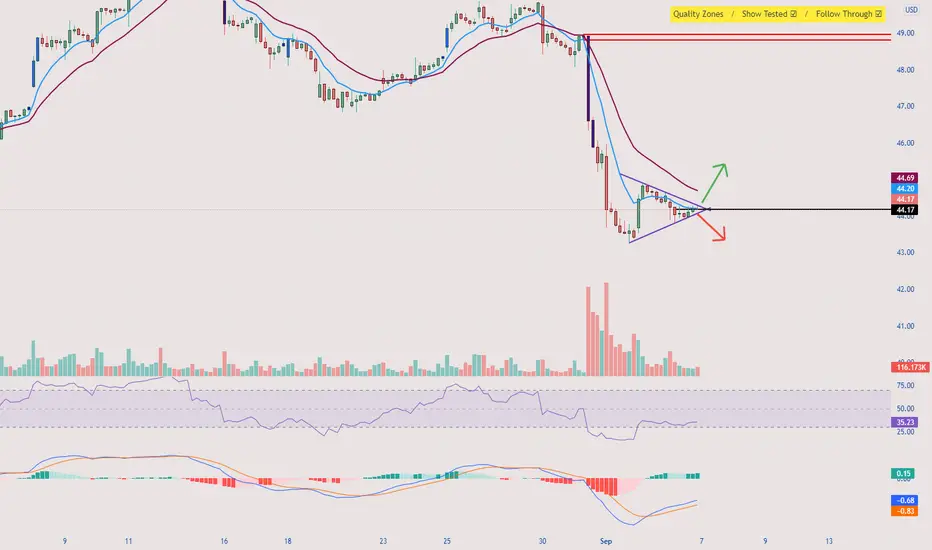
WFC 1HRBullish Crab
Price need to follow GREEN TREND LINE and hit Target 1 & 2 , else if Price BREAKS RED TREND LINE is EXIT
POTENTIAL BUY

WFC 45Min Bullish Crab
Price need to follow GREEN TREND LINE and hit Target 1 & 2 , else if Price BREAKS RED TREND LINE is EXIT
POTENTIAL BUY

WFC Symmetrical Triangle, Ready to MoveLooks like WFC and the financials have finished taking their sweet time consolidating for the last few (3-6 months). Looking to push higher if 10-year rates continue to move toward 1.7-1.8%. Would like to see 52-54 by end of October-EOY.

WFC 2HRBullish Shark
Price need to follow GREEN TREND LINE and hit Target 1 & 2 , else if Price BREAKS RED TREND LINE is EXIT
POTENTIAL BUY

WFC is looking 📉Bounced today off Fibonacci support at 44.85. Showing a H&S here. if that support goes
200ma is the next support.
48.50 was tough multi year resistance it couldn't get across

WFC head and shoulders on weekly?Possible head and shoulders forming on the weekly. Break blue trendline for confirmation.

WFC Showing a bearish megaphone Heading back to 50$ then a return back to 45-46 in time for earnings. If it does fall outside of the megaphone I'm guessing they'll save it for earnings

Wells Fargo 210+ day Cup with a Bull Flag for a HandleWFC has been building a Cup and Handle on the Daily since approximately Feb 20th of this year. This cup also happens to have a bullish flag within the handle. Price has already broken out of the flag around 47.50, and subsequently broke through significant resistance around 47.80. WFC ended the day Friday 9/24 retesting this level as new support, and it is setting us up for a long entry toward the previous ATH just above $66.00 if we get a bounce on Monday 9/27. The breakout of TNX last week also signals bullish context for financials if it confirms a new trend to the upside. WFC is not a fast mover so expect it to take several months to get there! Happy trading!

Wells Frago: Setup looks goodFew trendline clustered at support zone. Lets see if the price can climb.

Not in the stock. Im a really ametuer so dont put anything this, dont buy og sell on my recomendations my own portfolio is down. :)

$WFC Wells Fargo Reversal Levels.
Hopefully you find the chart helpful in terms of Supports & Resistance etc.
we refrain from adding commentary on the chart as that is reserved for our members and we are very conscious of not giving financial or trading advice.
Thank you for taking time to consult our chart and we would really appreciate a like, follow or comment.

$WFC - Daily inside candles & hourly pennant, watch for breakout$WFC - Daily inside candles & hourly pennant, watch for breakout for calls or puts
Price action trade example..!Price action describes the characteristics of a security’s price movements. This movement is quite often analyzed with respect to price changes in the recent past. In simple terms, price action is a trading technique that allows a trader to read the market and make subjective trading decisions based on the recent and actual price movements, rather than relying solely on technical indicators.
Since it ignores the fundamental analysis factors and focuses more on recent and past price movement, the price action trading strategy is dependent on technical analysis tools.
Tools Used for Price Action Trading
Since price action trading relates to recent historical data and past price movements, all technical analysis tools like charts, trend lines, price bands, high and low swings, technical levels (of support, resistance and consolidation), etc. are taken into account as per the trader’s choice and strategy fit.
The tools and patterns observed by the trader can be simple price bars, price bands, break-outs, trend-lines, or complex combinations involving candlesticks, volatility, channels, etc.
Who Uses Price Action Trading?
Since price action trading is an approach to price predictions and speculation, it is used by retail traders, speculators, arbitrageurs and even trading firms who employ traders. It can be used on a wide range of securities including equities, bonds, forex, commodities, derivatives, etc.
Price Action Trading Steps
Most experienced traders following price action trading keep multiple options for recognizing trading patterns, entry and exit levels, stop-losses and related observations. Having just one strategy on one (or multiple) stocks may not offer sufficient trading opportunities. Most scenarios involve a two-step process:
Identifying a scenario: Like a stock price getting into a bull/bear phase, channel range, breakout, etc.
Within the scenario, identifying trading opportunities: Like once a stock is in bull run, is it likely to (a) overshoot or (b) retreat. This is a completely subjective choice and can vary from one trader to the other, even given the same identical scenario.
Now lets review my yesterday published analysis:
Wells Fargo may rebound soon!
Buy call 43, September 3, at 85-90 cents, target: 2 - 2.5, stop loss 60 cents.
Outcome of the trade: +100- 120% gain closed today!
this is the power of technical analysis and using this tool correctly
reference article:
www.investopedia.com
