Bome vs Usd medium term buy & Sell SetupBome vs Usd medium term buy & Sell Setup
Zig zag Buy Sell Target 0.0148
Trade ideas

BOME/USDTHi everyone!
BOME is was moving in a falling wedge pattern.Liquidity of lower trend line is taken successfully and now after accumulation and manipulation BOME will distributes up to TP1, TP2 , TP3 and finally TP4.Move your SL to BE after TP1
Good Luck

Bome Vs Usd Buy Current Market 0.009400 As A Investor Bome Vs Usd Buy Current Market 0.009400 As A Investor
Bome Vs Usd Sell Target Point 0.24800 As A Investor

Bome Vs Usd Buy Current Market 0.009400 Target Sell Point 0.0142Bome Vs Usd
Buy Current Market 0.009400
Target Sell Point @ 0.012200 ,0.013200 , 0.14200

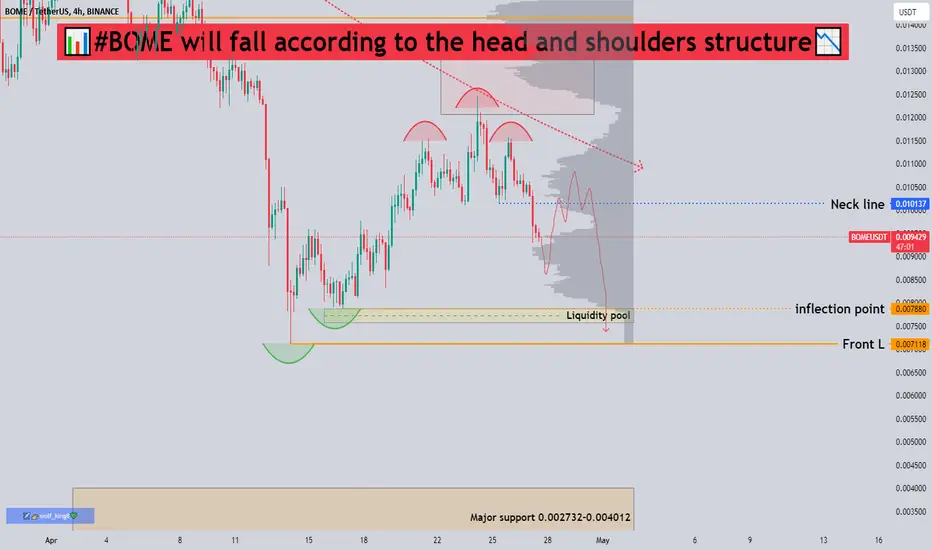
📊#BOME will fall according to the head-shoulders structure📉🧠From the perspective of the larger cycle, the high point gradually decreases, which is a downward trend.
➡️From a structural point of view, we started the pullback after completing the target of the double bottom structure, and constructed a bearish head and shoulders structure near the target area, so there is a high probability that we will sweep the liquidity pool below.
➡️If it falls below the previous low, focus on the major support areas marked on the chart. A reversal is very likely from here.
⚠️Don’t forget risk management💯
✔️Trade safe✔️
🤜If you like my analysis, please like 💖and share it💬
💕 Follow me so you don't miss out on any signals and analyze 💯
BomeNice wave structure that suggests a pump up to the target of wave 3
This is a very good price to buy!

$BOME Holding Lower Trendline as a support in 4 Hour Timeframe #BOME is maintaining support along the lower trendline in the 4-hour timeframe, suggesting potential bullish momentum. Keep an eye on price action for further confirmation. 👀📈 #BOMEUpdate #CryptoTrading

BOME LONG Versus a basket of memecoins I was monitoring during the April Fool's dump, this was the only one that was positive for a period while everything else was in the red. On the rebound this also outperformed many other memes other than perhaps WIF.
Other than that not much reasoning behind this, I like Darkfarm's vibe
Entry. I've been accumulating at 0.012-0.017 levels.
Watching for a break of the trend line for another possible entry.
Hodl or the money management system below
stop loss: none or % you are willing to lose
position size : Money you can afford to lose
Target 1 or 2, take out initial investment reducing risk to 0.
Target 2, take some profits if you need to.
Target 3 and fibs above. Use whatever exit strategy you like.

BOOK OF MEME (BOME) analysisI think the price will update the global peak of the BOME coin
The price will be much higher than $0.028 this year

BOMEUSD 12HBOME ~ 12H
#BOME We will start making purchases gradually after ECONOMICS:BOME successfully breaks through the Block Line. This resistance line with a minimum target of 10%+

BOMEUSDT 8H#BOME is in its support zone. Let's see how it will play with the dynamic resistance. Wait for a clean breakout and then enter to this coin. By the way, In case of a breakout, the targets are:
$0.012815
$0.014159
$0.016074
$0.018512

BOMEUSDT BULLISH BOME USDT BULLISH W PATTERN TARGET 1.12 ,
BOME/USDT has become a popular coin
time frame formed a bullish W PATTERN
As long as the price is in the channel then it's bullish.
entry at the support line of the channel and exit at 1.12
NOTE: financial advice only testing my skills, I am not professional.


#BOME/USDT breaks the Diagonal Trendline in 4-Hour TF!#BOME/USDT breaks the Diagonal Trendline in 4-Hour TF!
ECONOMICS:BOME is looking good for a long position. Wait for doe a retest too long. #BOMEUSDT is holding PWL $0.00711 support level.

BOME 1-2 SetupBOME Potential 1-2 Setup: Begin to gradually buy at support levels and sell at resistance levels.

BOME/USDTBYBIT:BOMEUSDT.P
This idea has a medium-term profit target.
All targets are indicated on the graph.
- Risk 1% on deposit
- R/R 1/2
P.S (This is not an investment recommendation, this is my personal opinion.)


bome/usdt targe at your own riskdaily support holding going to test the 15 min ob with fvg
NOTE- trade at your own risk no finincal advice

$BOME Possible Double Bottom FormationPoC is acting as support here
If this level holds, we can expect a bounce toward .014 to .0145 in confluence with high volume node
The levels I'm interested to go long in case we get a strong rejection is around .0113 (.618 fibonacci) or lower to .0096 to .0088 area for possible double bottom

BUY BOMEThe Market is at a psychological level, price is still seating within the FVG and also about to hit the weekly C.E after a pull back .
Wait for the market to hit C.E

BOOK OF MEME $BOME POSSIBLE BUY ENTRYHere are the zones where you can place a buy entry. But wait for reversal confirmations before you enter.

This is $BOME by Dark Farms who is involved?Bome not only has the Team aspect but also resembles PEPE in various characteristics. These memes are managed with patience and often have the same explosions. To hypothesize the explosive movement, we should initially consider the bottom before the official listing on exchanges at around 0.004936. Subsequently, we have the area to break, and a daily close above it would confirm the breakout.
From there, we should see the first pump in the area of 0.094 (first TP 3,618 FIB), followed by a bounce in the area of the EMA 5 daily, likely around 0.069-0.067. If the bullrun continues, the movement will resume after a few days towards the area of 0.2.
This is not fantasy; they are memecoins from Dark Farms with tremendous volumes.

BOME UPDATE (4H)This is an update to the analysis you see in the "Related Ideas" section.
Now we are in the green range of the previous analysis, but as it was said in the previous analysis, the BOME data was too small to review and the number of scenarios for this symbol was high.
Now that the chart has given us more data, it looks like we are in a bearish ABC, which is now in wave B of this ABC.
Wave B looks like a triangle, and now the price is completing wave E of this triangle. From the red range, we expect a drop towards the green range.
The target is marked on the chart.
Closing a daily candle below the invalidation level will violate the analysis
