BONKUSDT Short ideaBONK USDT is bearish according to daily Bias, H1 is already showing us bearish confirmation, just take m5 confirmation and you can sell . #NOTaFinancialAdvice
Trade ideas

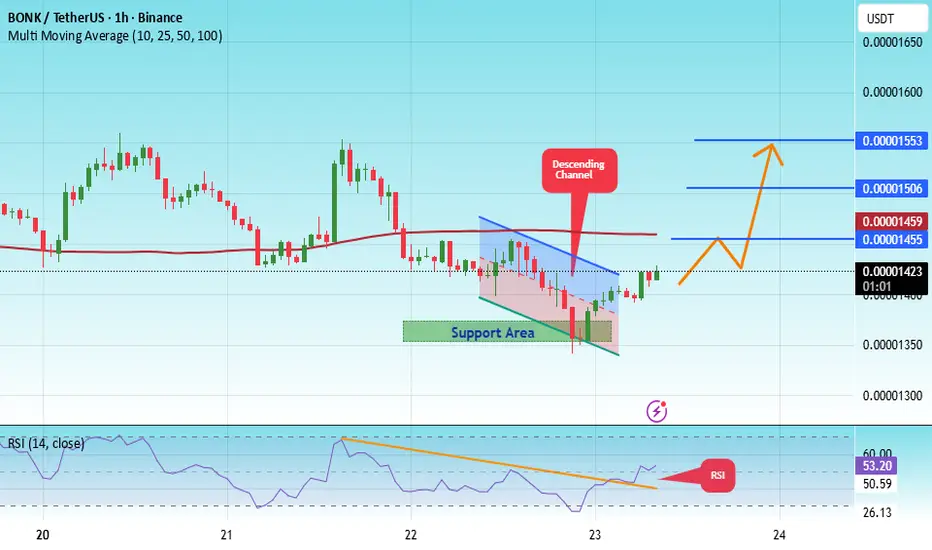
#BONK/USDT — Accumulation Zone Before a Potential Major Revers#BONK
The price is moving within a descending channel on the 1-hour frame, adhering well to it, and is heading for a strong breakout and retest.
We have a bearish trend on the RSI indicator that is about to be broken and retested, which supports the upward breakout.
There is a major support area in green at 0.00001356, which represents a strong support point.
We are heading for consolidation above the 100 moving average.
Entry price: 0.00001422
First target: 0.00001455
Second target: 0.00001506
Third target: 0.00001553
Don't forget a simple matter: capital management.
When you reach the first target, save some money and then change your stop-loss order to an entry order.
For inquiries, please leave a comment.
Thank you.
BONK Holds Weekly Support — Watch for Impulsive Breakout BONK price action is currently holding firm at a key weekly support region, an area that has seen multiple candle closes above in recent sessions. The latest engulfing candle suggests renewed buyer interest, though confirmation is still required for a clear directional move. As long as price remains between the weekly support and daily support, the market remains range-bound until proven otherwise.
A breakout from this range must occur with strong volume and impulsive momentum to confirm a shift toward higher resistances. Without such validation, the current structure may continue oscillating within its established boundaries.
Key Points:
- Weekly Support Holding: Price continues to defend this critical structural zone.
- Range-Bound Behavior: Trading confined between weekly and daily supports until breakout.
- Volume Confirmation Needed: A bullish influx of volume is essential for sustainable breakout
strength.
From a technical perspective, the current region remains pivotal — a loss of weekly support would increase the probability of a deeper corrective move, while sustained defense could lay the foundation for upside continuation.
What to Expect:
As long as BONK holds above its weekly SR, expect gradual bullish continuation toward higher resistances. A breakdown below this level, however, would confirm renewed bearish momentum and open the path to lower liquidity zones.

BONKUSDTEntry Point: Short at a pullback to the broken support (now resistance) around 0.00001394, or immediately at current levels (~0.00001327) if momentum continues downward.
Stop Loss (SL): Place above the recent high or the cyan trendline, around 0.00001500, to limit risk in case of a fakeout or rebound (risk ~10-15% from entry).
Take Profit (TP): Target the next support levels visible on the chart, such as 0.00001232 (red line) for a conservative TP, or lower at 0.00001100 based on predictions. This could yield a 10-20% gain on the short, depending on entry.

BONKUSDT 1D#BONK is consolidating inside a descending channel on the daily chart. It is currently facing the midline of the channel, and in case of a breakout above it, the short-term target is:
🎯 $0.00001666
In case of a breakout above the channel resistance and the daily EMA100, the potential targets are:
🎯 $0.00001911
🎯 $0.00002284
🎯 $0.00002585
🎯 $0.00002886
🎯 $0.00003315
🎯 $0.00003862
⚠️ Always remember to use a tight stop-loss and maintain proper risk management.

BONK high potential for explosion at least to 0.00001850$hello
the support and resistances on the chart are based on the previous data and weekly candlesticks if BINANCE:BONKUSDT holds this last support the potential of 35% gain is logical toward 0.00001850$

#BONK/USDT — Accumulation Zone Before a Potential Major Revers#BONK
The price is moving within a descending channel on the 1-hour frame, adhering well to it, and heading for a strong breakout and retest.
We have a bearish trend on the RSI indicator that is about to be broken and retested, which supports the upward breakout.
There is a major support area in green at 0.00001425, which represents a strong support point.
We are heading for consolidation above the 100 moving average.
Entry price: 0.00001439
First target: 0.00001476
Second target: 0.00001513
Third target: 0.00001571
Don't forget a simple matter: capital management.
When you reach the first target, save some money and then change your stop-loss order to an entry order.
For inquiries, please leave a comment.
Thank you.

$BONK: time to refill our bagsI believe we’re heading toward a new all-time high for Bitcoin (BTC).
Both CRYPTOCAP:OTHERS and CRYPTOCAP:TOTAL3 are showing strong bullish momentum, entering extremely oversold territory — a signal often preceding a major recovery.
November is also a historically bullish month for altcoins, which strengthens the case for an upcoming rally.
The probability of a +100% uptrend is very high.
The head and shoulders pattern was invalidated by the October 11th event, which completely shifted the market structure.
In my view, this is the perfect time to take positions and patiently wait for the market reset to play out.
🎯 Take-Profit Targets (based on Fibonacci levels):
TP1: $0.00001865
TP2: $0.00002145
TP3: $0.00002600
TP4: $0.00003220
Historically, when SEED_DONKEYDAN_MARKET_CAP:BONK starts pumping, it almost always reaches around $0.00003200 — and if that happens, we could see a parabolic move up to $0.00005000, marking the top of the altseason.
DYOR (Do Your Own Research).
#BTC #BONK #Altseason #CryptoMarket #Bullish #TradingSetup #Fibonacci #CryptoAnalysis #NovemberRally

Key Resistance Ahead, BONK Eyes 30% Move to 0.00002525Hello✌️
Let’s analyze BONK’s price action both technically and fundamentally 📈.
🔍Fundamental analysis:
BONK plans a 1T token burn once 1M holders are reached, plus daily buybacks from BonkFun fees. These moves may ease inflation, but their impact depends on user growth vs. holder sell pressure.🔥🐕
📊Technical analysis:
BINANCE:BONKUSDT is navigating a descending channel and approaching key monthly resistance and support levels. A successful breakout above resistance could trigger a potential 30% upside toward 0.00002525, setting the stage for a strong move. 📈🔥
📈Using My Analysis to Open Your Position:
You can use my fundamental and technical insights along with the chart. The red and green arrows on the left help you set entry, take-profit, and stop-loss levels, serving as clear signals for your trades.⚡️ Also, please review the TradingView disclaimer carefully.🛡
✨We put love into every post!
Your support inspires us 💛 Drop a comment we’d love to hear from you! Thanks, Mad Whale

BONK has formed a bullish inverted Head and Shoulders pattern📊 SEED_DONKEYDAN_MARKET_CAP:BONK Update
SEED_DONKEYDAN_MARKET_CAP:BONK has formed a bullish inverted Head and Shoulders pattern 🟢👤
It has broken out above the red resistance zone 🔴, and the first target is the green line level 🟢

BONK - KEY DEMAND ZONE IS INSEED_DONKEYDAN_MARKET_CAP:BONK - update:
Price is sitting on key demand zone here.
Neutral zone H4; but If #BTC hold above level mentionned, then I expect to see some bull reaction soon here 📈
Key levels:
0.00001950 - 0.00002010 - 0.00002080 - 0.00002175 - 0.00002290.
POC point: 0.00002075 - 0.00002080.
Daily candle close above could confirm a bull breakout.

BONK/USDT — Accumulation Zone Before a Potential Major Reversal?BONK is once again testing its historical demand zone between 0.000015–0.0000196 USDT, an area that has repeatedly acted as a strong defensive wall for buyers.
Each previous visit to this zone has sparked a surge in buying pressure, leading to significant rebounds. Now, the market faces the same critical point — a decisive moment that will determine whether this is the final phase of accumulation or the beginning of a deeper breakdown.
---
Technical Structure and Pattern Insight
On the 3-day timeframe, BONK has formed a clear triple-bottom pattern, marked by three rounded lows occurring around the same price range.
This formation typically represents institutional accumulation, as large players consistently defend a specific level to absorb selling pressure.
However, this pattern remains unconfirmed until the price manages to break and close above the key resistance near 0.00002710.
A breakout with strong volume from that level would confirm a potential mid-term bullish reversal and signal the start of a new accumulation-to-expansion phase.
---
Bullish Scenario — Reversal Potential
If BONK holds and rebounds from the current demand zone, it could mark the beginning of a major structural reversal.
The first leg of recovery would aim toward previous resistance levels, where prior distribution occurred.
A confirmed 3D close above the neckline would be a strong bullish validation, showing that buying pressure has regained market control.
In this case, BONK would likely form a macro higher low, reinforcing a shift in momentum from accumulation to a fresh bullish trend.
---
Bearish Scenario — Breakdown Risk
On the other hand, if BONK fails to defend this zone and closes a 3D candle below 0.000015, the bullish structure becomes invalidated.
Such a breakdown would open the door to a retest of lower support regions and indicate that the downtrend remains intact.
This would confirm that the market is not yet ready for a sustainable recovery and that further accumulation might be needed before any significant bullish move can develop.
---
Strategic Outlook
BONK currently stands at a critical equilibrium point — the boundary between reversal and continuation.
If the demand zone holds, the triple-bottom formation could trigger a strong upward expansion.
If it breaks, bearish continuation becomes highly probable, bringing the market into a new consolidation phase near previous lows.
Traders are advised to wait for confirmation before positioning, manage risk carefully, and avoid overexposure.
The next move will likely define BONK’s mid-term trend direction, determining whether this accumulation is the beginning of a new cycle — or merely a pause before the next leg down.
#BONK #BONKUSDT #CryptoAnalysis #AltcoinSetup #TechnicalAnalysis #MarketStructure #SwingTrade #TripleBottom #DemandZone #ReversalSetup #CryptoTA #PriceAction #BreakoutStrategy

BONK Update📊 SEED_DONKEYDAN_MARKET_CAP:BONK Update
SEED_DONKEYDAN_MARKET_CAP:BONK is retracing now 🔄
If the price keeps retracing to the green zone level 🟢, there’s potential to enter a long position with confirmation ✅
This area is where buyers previously accumulated and could push the price up again 📈

BONKUSDT 1D#BONK is trading within a falling wedge pattern on the daily chart. In case of a breakout above the wedge resistance and the daily SMA50, the potential targets are:
🎯 $0.00002585
🎯 $0.00003004
🎯 $0.00003342
🎯 $0.00003680
🎯 $0.00004162
⚠️ Always remember to use a tight stop-loss and maintain proper risk management.

BONK Update📊 SEED_DONKEYDAN_MARKET_CAP:BONK Update
SEED_DONKEYDAN_MARKET_CAP:BONK has formed a bullish double bottom pattern and is now testing the red resistance zone 🔥
If it breaks out, the first target will be the green line level 🚀

$BONKLong SEED_DONKEYDAN_MARKET_CAP:BONK here looking good for upside form her everything is in chart

35% profitThe chart indicates a target of 0.00002580, which represents a 35% potential gain for a long position.

BONK 4H Analysis – Key Triggers Ahead💀 Hey , how's it going ? Come over here — Satoshi got something for you !
⏰ We’re analyzing BONK on the 4-hour timeframe timeframe .
👀 In the 4-hour timeframe of Bank, we can see that Bank had a good descending channel, which with the recent drop reacted to the midline of the channel and then moved towards the top of the channel, and with a strong 4-hour whale candle, it stabilized above its descending channel and is now completing a pullback to its channel in multi-timeframe.
⚙️ The key RSI area is the 59 zone, which if the fluctuation passes this level, Bank can move upwards and have a trend reversal after this corrective wave.
🕯 The heavy and good increase in Bank’s volume at this bottom shows the presence of the market maker, the size of the 4-hour candle with which we broke the channel top also seems whale-like.
📊 The OTHERS.D index and we can see, this index is inside a 4-hour box, with the breakout of the top of this box which is at the 7.9% area, good money enters Bank. The midline of this box is at the 7.74% area, which if lost, our analysis can fail.
🔔 The areas we considered as alarm zones are the midline area and the top area. As long as we are above the midline area, we can open our position with low risk and a big stop, which is almost high-risk. The alarm zone 0.00002357 can be a more reliable area for breakout and taking trades. Keep in mind that the market conditions seem risky and the market is in decision-making mode.
❤️ Disclaimer : This analysis is purely based on my personal opinion and I only trade if the stated triggers are activated .

BUY AND HOLDHello friends
Due to the growth of the currency, the price of this currency has entered a correction after the growth, and given the good situation that has been provided, we can buy in steps with risk and capital management and move with it to the specified goals.
Note that the holding period is at least 3 months, so be patient and observe capital management.
*Trade safely with us*

BONK – Bullish Flag in Play📆 On the Daily timeframe, SEED_DONKEYDAN_MARKET_CAP:BONK is moving inside a bullish flag and currently testing the midline support 🛡️
This level is key — price could either re-test the lower trendline or push toward the upper boundary ⚡. A breakout from the flag would likely signal strong continuation, while a breakdown may stall momentum.
👀 Watch this structure closely for the next move.
Not financial advice.

BONK Positioned Near Support, Targeting 0.000032 With 25%Hello✌️
Let’s analyze BONK’s price action both technically and fundamentally 📈.
🔍Fundamental analysis:
BONK plans to burn 1T tokens once it hits 1M holders, adding deflationary pressure. Slower holder growth may soften the impact, like Shiba Inu’s 2021 burns. 🔥
📊Technical analysis:
BONK has broken a triangle pattern and key resistance, sitting near daily support, signaling a potential 25% upside toward 0.000032. 🔥
📈Using My Analysis to Open Your Position:
You can use my fundamental and technical insights along with the chart. The red and green arrows on the left help you set entry, take-profit, and stop-loss levels, serving as clear signals for your trades.⚡️ Also, please review the TradingView disclaimer carefully.🛡
✨We put love into every post!
Your support inspires us 💛 Drop a comment we’d love to hear from you! Thanks, Mad Whale

BONK/USDTBONK/USDT – LPL Setup
If SWEEP of DISCOUNT ARRAY is achieved, look for a potential move higher.
🚩 Invalidation: If the FVG breaks with a clear breakaway candle, this setup is void.

Bonk targetsWe are consolidating around 220-240, with 260-300 targets. If declined from this zone the good buying opportunity is around 150 zone. So far Bonk looks very promising.
