Trade ideas


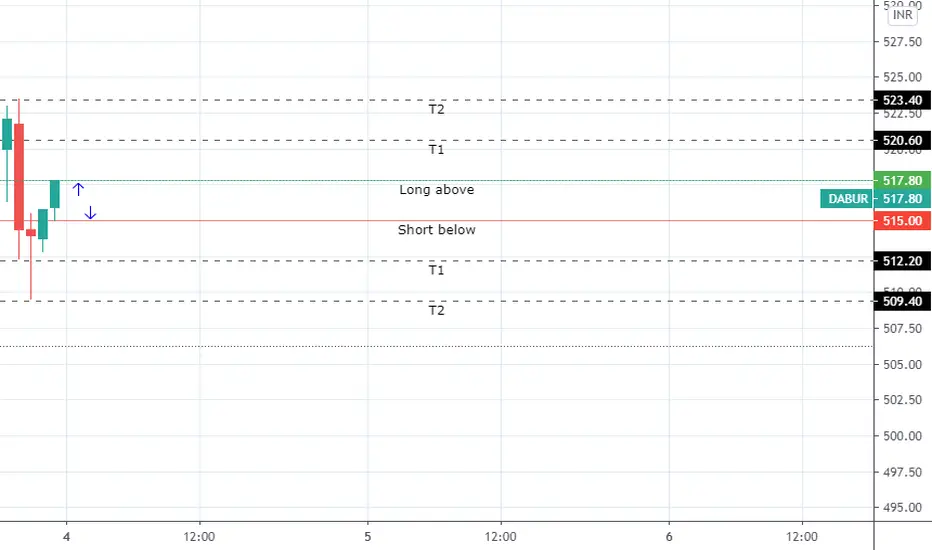
Dabur - Intraday Trade SetupDabur CMP - 515.00
Looking bullish in shorter time frame but overall trend is down only. One can go for Intraday trade setup with the following entry, exit & targets
Buy at or Above 518 / Stop Loss 510.50
Target 1 - 522
Target 2 - 527
Target 3 – 530
Disclaimer: This is my view and for educational purpose only.

Dabur - Consistently GrowingDabur- has only 3 bad months below 20 Month Moving Average in the last 120 months...!. Quite a consistent month perfomer. Price has doubled in last five years.
Disc: Not a SEBI Registered. I post charts for my own study.

PATTERN SPEAKS ITSELF.Ascending Triangle Breakout on Weekly chart.Buy around 525.Stop loss exit if price gives a close below 500.Target 600+++.I have already entered in to this trade.Let us see what happens.Happy Trading friends.Pls give me your valuable comments.thank you.

Dabur - Intraday / Swing Trade SetupDabur CMP - 511.45
Looking bearish in higher time frame. One can go Intraday / Swing Trade setup with the following entry, exit & targets
Sell at or below 506 - 505 / Stop Loss 512.50
Target 1 - 500
Target 2 - 495
Target 3 – 490 / 485
Disclaimer: This is my view and for educational purpose only.


Dabur- Bullish Flag BreakoutDabur has given a Bullish Flag Breakout with good volumes. Looks good for upward movement - 531/535/540 plus.


Dabur- Breaking Highs with confirmation.Dabur is breaking 52 weeks high and very importantly with a trend continuation Pattern ( FLAG PATTERN ). A continuation pattern near its highs and break with good closing is very interesting.
And as usual volumes which is also giving good signs for this bet to be good.
I hope everyone is learning.
Please let me know your views too. Comment below your analysis and your pick of the stocks too.
Cheers and Happy Trading.


Dabur Price in Ascending Trianglewe are hitting the resistance again and now try to move higher
we need weekly close above this resistance for the long setup
we will wait for good bounce and big bullish candle and than enter in this trade. till than watch the movement


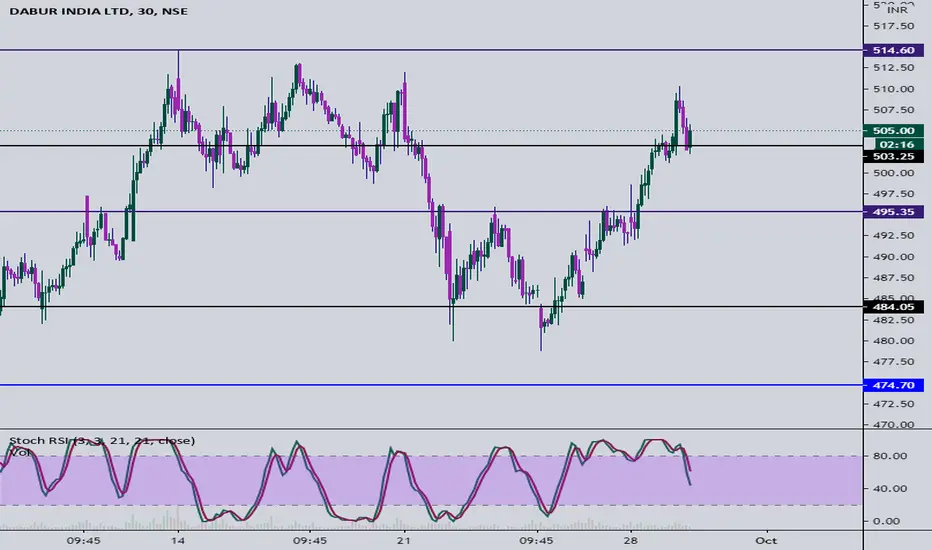
R-0224 Dabur break out GO LONG CMP 515 TGT 544/571 SL 4881. Symmetrical Triangle breakout on the daily charts
2. Volumes have gone up along with the price rise in the recent past
3. Stock price has surpassed the previous top resistance of 514.70
4. Long build up is seen in the October series, where OI has gone up more than 15% with price rise of 5.5%
5. ADX indicator crossed –DI line on the upside, indicating starting of a bullish momentum, RSI and MACD are also
showing strength in the current uptrend
6. Considering the technical evidences discussed above, we recommend buying the Dabur October Future at 515-516
and average at 497, for the upside targets of 544 and 571, keeping a stoploss at 488.

Dabur - 4th Re-test of All Time High regionThanks for coming to this update.
Before you start reading kindly hit that like button. It motivates me to keep doing such work for free.
Thanks
Dabur is re-testing the 515-525 region for the 4th time now. In the last trading session, it was consolidating below resistance which is a good sign for people wanting to go long.
A break above this could give some upside momentum.
It is also making an ascending triangle on the Daily chart that has a higher probability of breaking towards the upside.
One thing to note though is that volume is not great in the up move and this could result in a failed rally or trap.
Please beware of this and trade safe.
Please note: These are my views and not trading advice. Please consult your financial adviser before making any trading decision.
In the end, either you follow your rules, or get eaten

LOOK WHAT I FOUND IN DABUR.Company has a great potential to grow you just have to get an entry point and some patience and you will be definitely rewarded

Short Term TargetsBuy Dabur around 503 to 506
Targets 511/514
Stop Loss 500
#NSE call
*Disclaimer : I just shared my view. Please trade with your own and comfortable views.
DABUR (CHART OF THE WEEK.)Dabur has been forming a beautiful triangle and for me it is the chart of the week. Even though others have made some beautiful patterns, Dabur for some reason i like more than others.
A breach might not come soon (And i can be dead wrong) but it is surely worth tracking.
A breach on either side of the triangle should give some good price action.


