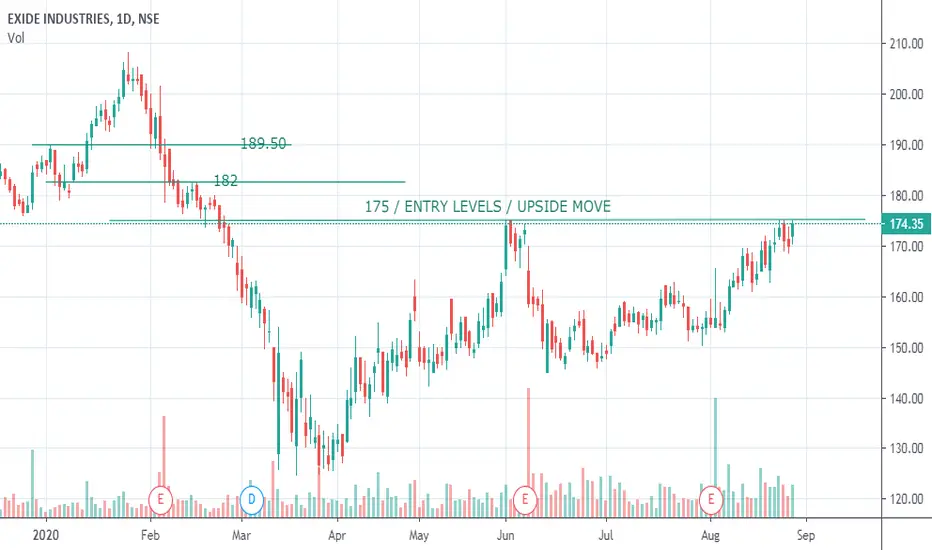
EXIDE INDUSTRIES - Ascending Triangle Pattern (Swing/Positional)This study is purely based on Price Action and Chart Patterns.
Reasons/Logics for going long is explained in image itself.
Trade strategy -
For Risk Taking Traders - Entry point would be above the high of next green candle or above 170 level - (ENTRY-1). SL is marked below the double bottom for Entry-1
For Risk Averse Traders - Entry point would be on the high of breakdown candle or on high of retesting candle (retesting the recent supply zone and taking it as support) - (ENTRY-2). SL is marked for Entry-2 as well.
This is for short term positional or swing trade.
SL should be trailed accordingly once the trade is initiated.
*This analysis is purely for study purpose, enter the trade at your risk and money management*
Comment for any further queries.
Trade ideas


Exide Industries PriceBasically the price is showing weakness and closed below it's 200 Moving Average which is showing down trend for the stock. I'm waiting for 140-150 level for accumulation. Happy Investing 😇

EXIDEINDIf it crosses trendline over 167 then keep your Target at 175.
High chances of breaking trendline upperside.

EXIDENSE:EXIDEIND
And one more handmade perfect chart,
The key levels are 175, if this sustains above 175, we can see 182 and 190 coming in few days and in short term may even show a good upmove, if playing for it then trail your stop losses
**********************************************************************************************************************************************
Hi all,
Its pleasure to have you all here.
I have started putting these charts as a contribution from my side to all people who are new to business, as I had to struggle a lot without any sources at disposal. So please consider this a just small contribution from my side.
Few Honest Disclosures:
1. Any idea shared is my personal view, its not a recommendation, neither any kind of paid propaganda, so please
do your bit of research.
2. Ideas shared does not mean that I trade all or have position in them, this is just a helping hand to all.
3. I expect no comments or like nor any negativity, as I said its just a small helping hand from my side, please plan your risk and trade as per your capacity.
4. To trade in Cash, options or futures is your sole choice and your own risk
5. I am no expert in Tech Indicators, I believe in support resistance and trendline theory, you may use this as a supplement theory for better results.
6. I work for my own living, this is a hobby which I do sincerely to help anyone who might come across my charts.
**********************************************************************************************************************************************
R-0193 Cash Buy EXIDEIND @172.70-173.7 SL 168.4 TGT 183Short Term Cash Buy EXIDEIND @172.70-173.7 SL 168.4 TGT 183
Above VWAP TK cross over + MACD cross over


Exideind long#Exideind Above 175 60mcb target 183 190 200+ Support placed at 155 dcb.Above 205 wcb expect 225 250+


EXCIDEIND-Quick Profit IdeaDownside : If Break 152 and sustain, T1-146, T2-140, T-135
Upside: If Break 154, T1-160, T2-170
Its oversold zone, should move upside.


Exide Industries : H&S pattern on 15 min chart#EXIDEIND form the Head&Shoulder reversal pattern on 15 min chart. Level 160 is very strong resistance. If level 157.90 will break then stock can see pullback on level 156.65 and if face resistance from 157.90 then bottom target will be 153 while support on 152.35
----------------------------------------------------------
Support : 156.65 and 153
Breakdown : 157.90
LTP : 159.15
Breakout : 160.10
Long Target : 162 and 165
----------------------------------------------------------
(Disclaimer: This is only for educational purpose and paper treading. Learn and take advice from you financial advisor)

EXIDE INDUSTRY 170 CE at 1.6, Jul Month -BullishTeam, I have given call in my Telegram channal today about EXIDE INDUSTRY I AM seeing Exide is strong can go upto 170 Levels and risk of 6K hardly we can take Hero or Zero of EXIDEIND 170 CE for JULY SERIES at 1.6, Stop Loss 0


EXIDE 2020 ANALYSISBUY AT SAID LVL
BLACK DOTED LINE ACT AS SUPPORT AND RESISTANCE
ZOOM OUT ON CHART TO SEE THAT IT IS TRAVELLING IN A RANGE
PURPLE LVL WE CAN START BUYING A BIT QTY & ADD AS SAID LVL
IF GROSSED GREEN LVL & SUSTAIN
THE NEXT TARGT IS PURPLE LVL.


Continuation to the UpsideExide looks like it completed a running flat - a sideways move, after the initial upmove. I expect an upmove next, in the same direction of the first move. I see a low risk , high reward setup here. The initial upside target could be the "b" point of the flat and there is a good chance it can continue moving up after the initial target. Its a classic continuation pattern.
** This is not a trade advise**


Exide India - longExide india has rebounced back from its 20 DEMA and is currently taking support at its previous resistance. The stock has fallen on account of its results. It is best time to accumulate for 5 to 10% upside, possibly within this week.


Exide Industries Short setup By elliote +Price Action Breakout Hello friends, Price is becoming narrow in lower value expected to move toward gravity price within days.
you can take Short entry in Exide Industries !!
Thanks
If you want long term analysis then you can check the link below price is moving according to our level thanks!
