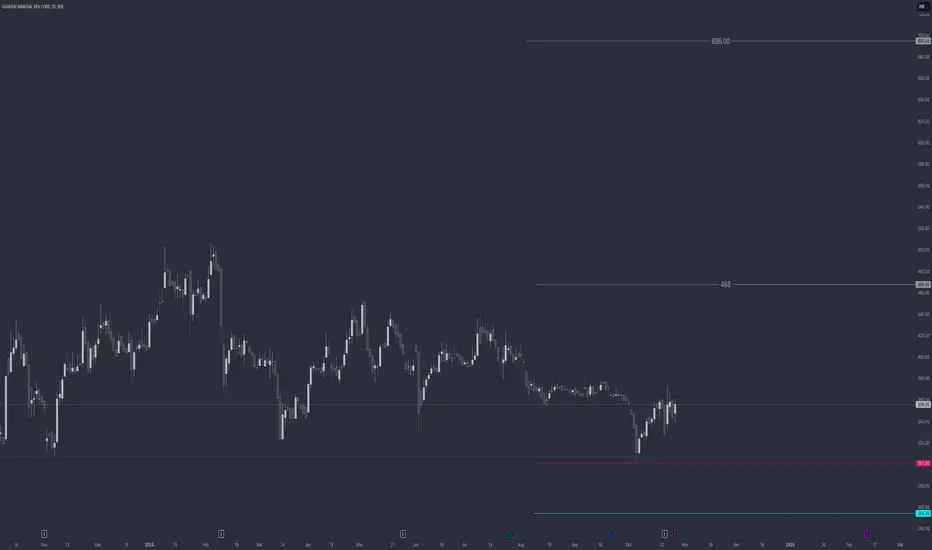
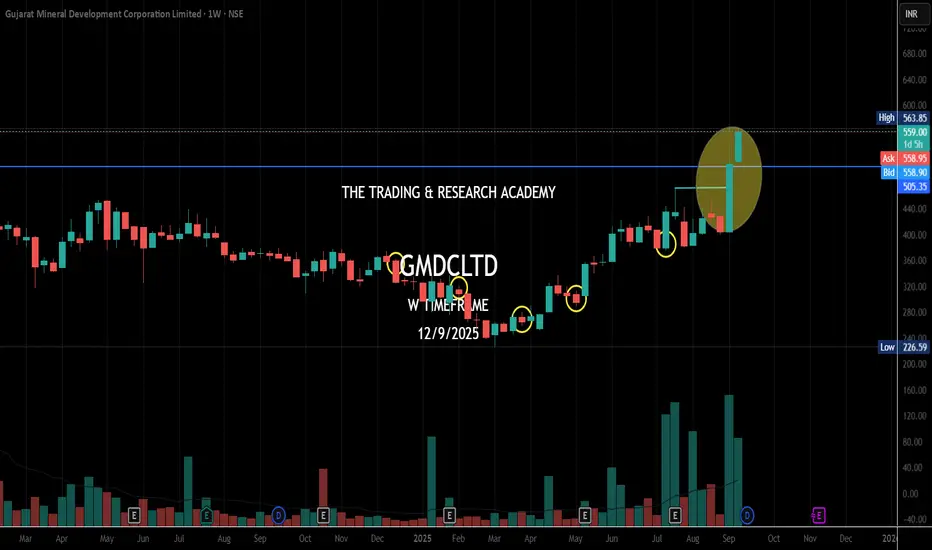
GMDC – Setup for All-Time High Breakout?🟦 GMDC – Setup for All-Time High Breakout?
Gujarat Mineral Development Corporation is showing a strong structural setup, indicating potential for an all-time high breakout if momentum sustains.
📊 Technical View
• Repeating box breakout pattern
• Long consolidation range: ₹488 – ₹651
• 19-week consolidation → sign of silent/stealth accumulation
• Sustained move above ₹651 can trigger fresh momentum
• If momentum continues, structure opens up for higher expansion
💰 Trade / Positional Plan
• CMP: ₹615
• Stop Loss: ₹460
🎯 Targets
• ₹773
• ₹901 (extended momentum target)
📌 Trading Approach
• High volatility → keep quantity in check
• Prefer staggered entry
• Strict position sizing
• Patience trade, not a chase
• Avoid reacting to news flow; respect SL
⚠️ Clarification: Independent analysis. No part of Religare involved.
📝 Important: No responsibility for profit/loss. No fees charged.
📉 Disclaimer: Not SEBI-registered. Please do your own research.
✅ Consolidation builds energy. Break above 651 decides the next leg.
Gujarat Mineral Development Corporation Limited
No trades
What traders are saying

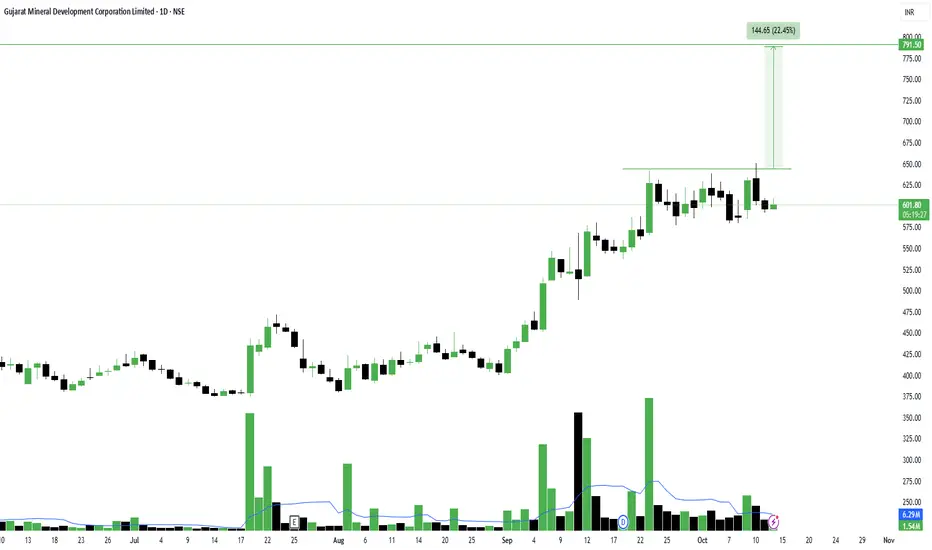
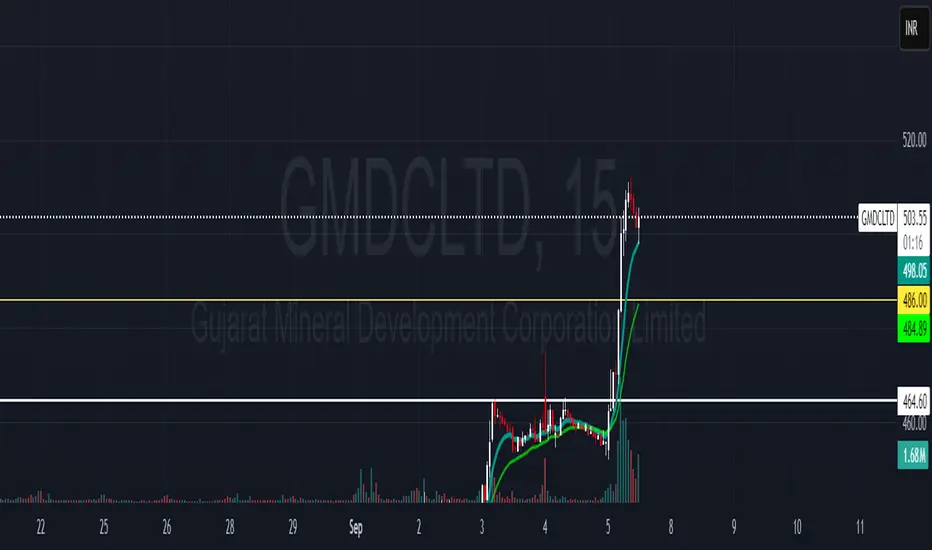
GMDC – Strong Retest + 23% Rebound Supported by Sector TailwindsNews Context:
India is moving toward a major ₹7,300-crore incentive scheme to boost domestic manufacturing of rare earth permanent magnets (REPM). The plan aims to build up to 6,000 tonnes of annual capacity and reduce import dependence. This macro tailwind has strengthened sentiment across the mining and minerals space, and GMDC is reacting well.
Technical Structure:
• GMDC broke out above the 485 zone earlier.
• Price rallied towards the all-time high region near 650.
• The pullback landed precisely on the 485–500 breakout/retest zone.
• From there, the stock printed a strong ~23% V-shaped rebound with supportive volume.
The “breakout → retest → strong bounce” sequence generally leans toward trend continuation rather than a bull trap.
Key Zone Ahead:
• 640–655 (all-time high supply).
This zone will determine whether the stock enters a fresh price-discovery phase or faces another rejection.
Bias:
Structure remains bullish as long as price holds above 560–570.
A high-volume breakout above 655 would confirm continuation.
Watching how the price behaves near ATH in the coming sessions.
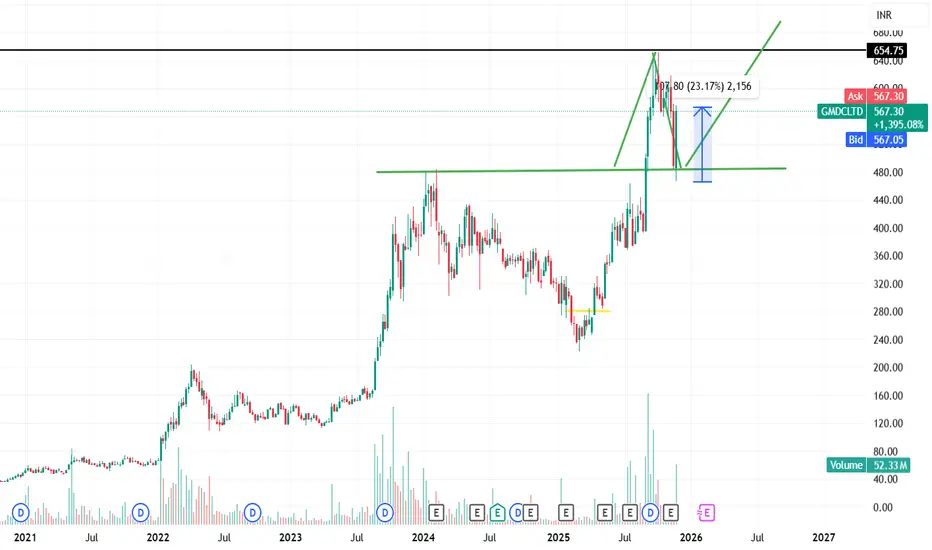
GMDCLTD - Range Breakout on RadarGujarat Mineral Development Corporation Ltd – Range Breakout on Radar
NSE:GMDCLTD
📈 Pattern & Setup:
GMDC has been consolidating in a tight range for the past few weeks after a sharp rally from its September lows. The stock faced resistance near 645–650 multiple times, forming a well-defined horizontal base while maintaining higher lows — a sign of strength and controlled accumulation.
The recent shakeouts near the moving averages successfully absorbed supply, with buyers stepping back in to defend the 600 zone. Price is now coiling just below resistance, suggesting a potential breakout setup in the making.
📝 Trade Plan:
✍Entry: Above 650 (breakout confirmation)
🚩Stop-Loss: 600 (below recent shakeout low)
🎯Targets:
Target 1 → 720
Target 2 → 790 (22% potential move)
💡 Pyramiding Strategy:
1. Enter with 60% position once it closes above 650
2. Add remaining 40% above 670 with volume confirmation
3. Trail stop-loss to 615 once price sustains above 690
🧠 Logic Behind Selecting this Trade:
This structure highlights textbook re-accumulation after a strong trend. The tight consolidation zone, clean moving average alignment, and controlled pullbacks point to steady institutional interest. With volumes gradually increasing near support, the next leg higher could be triggered by a close above the range top.
Keep Learning. Keep Earning.
Let’s grow together 📚🎯
🔴Disclaimer:
This analysis is for educational purposes only. Not a buy/sell recommendation. Please do your own research or consult your financial advisor before trading.
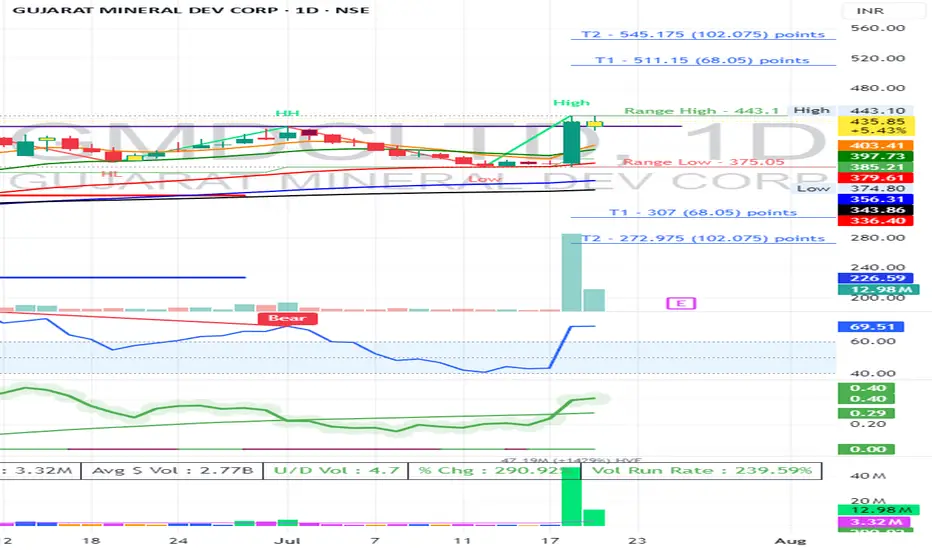
GMDC Breakout Setup: Buy Above 637Entry: Buy above 637 (recent resistance and Fibonacci breakout spot).
Target 1: 673 (Fibonacci 0.382 retracement).
Target 2: 703 (Fibonacci 0.5 retracement).
Target 3: 733 (Fibonacci 0.618 retracement).
Stoploss: 615 (below recent support and trendline).
Volume spike and RSI uptick signal momentum

LongI see it going good for medium to long term
500 is strong demand and support zone
Continue accumulation expected between 550-500
Target can be 200+
Based on chart
For educational purposes only
Make your decision using own analysis
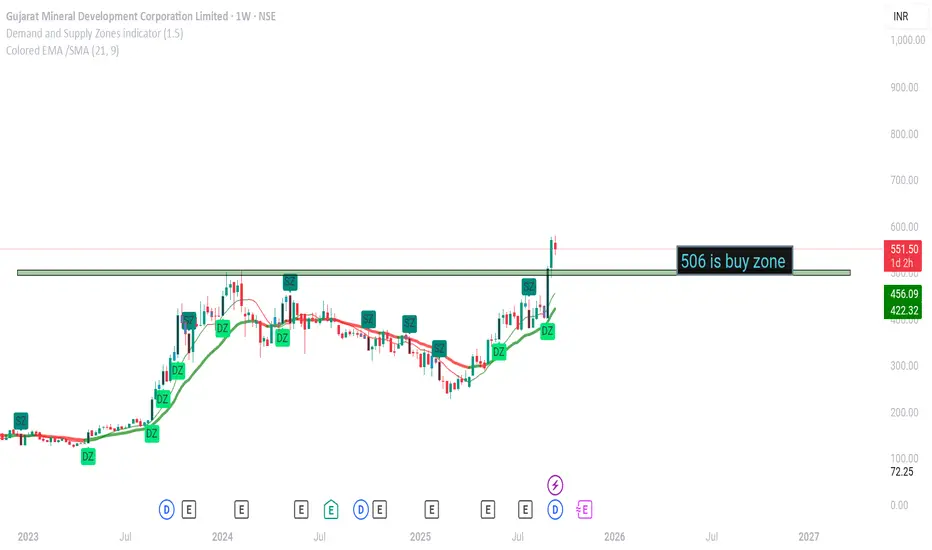
Chart Speaks- GMDCI have been sharing for a long time now about News v/s Chart analysis. I am a strong believer that any development about the company is visible on chart, be it positive or negative. This time its GMDC.
Read the News -
CENTRE PREPARING INCENTIVES TO ENCOURAGE DOMESTIC PRODUCTION OF RARE EARTH MAGNETS: KUMARASWAMY: MONEYCONTROL
Company was in the news since early this month on rare earth materials. Price action already hinting it since March, April, July & Aug 2025.
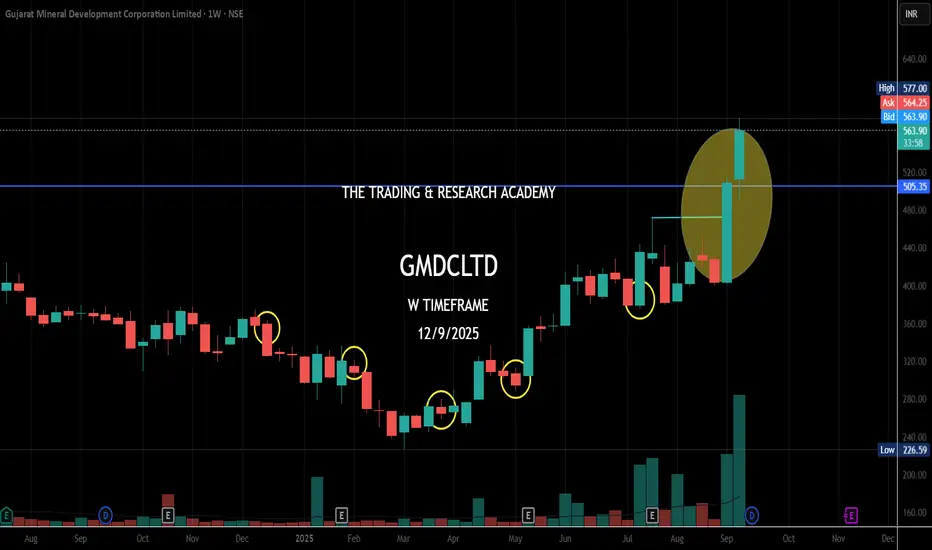
Chart Speaks - #GMDC#GMDCLTD : ENGAGED WITH MYANMAR TO PROCURE RARE-EARTH MINERALS|| GOVT HAS ASKED PSUS, PRIVATE COS TO SEE PROSPECTS OF SAMPLE COLLECTION FROM MINES IN NORTHEAST MYANMAR
GMDC is up36% in 2 days! Chart Speaks, Someone knew this already. Look at the chart
#chartspeaks
Strong Breakout This stock price first test its 200 week SMA and Finally break the consolidations zone and ready for upmove .

GMDCgmdc has given all time high breakout can move more on the upside 650 and 850 is the next resistence .
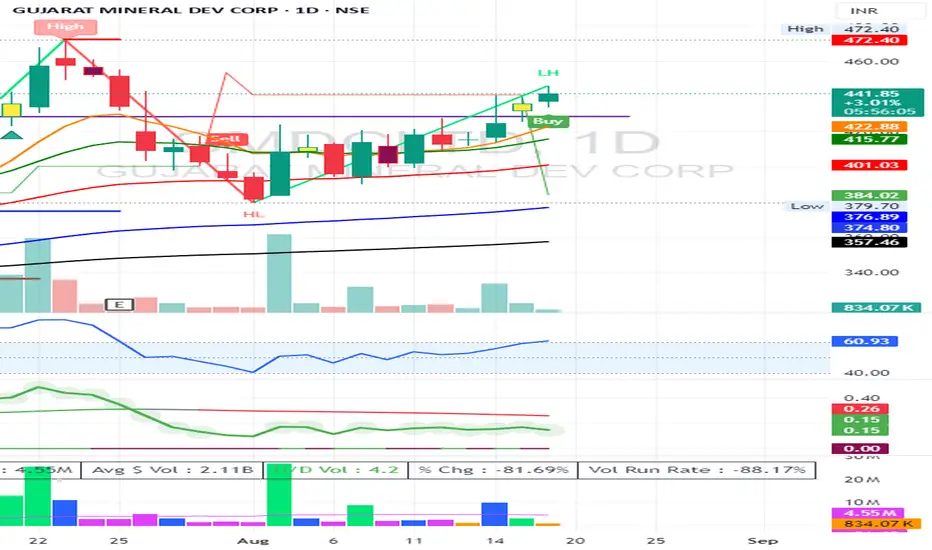
GMDC Inside Bar Strategy Entry 443
SL 422
RSI above 60 Daily / Weekly / Monthly
W Pattern formed
Volume Growth
GMDC Daily ChartGMDC Daily Chart
Inside Bar Candle
Resistance 440
Support 425
Expected level 472 / 492
RSI above 60 D / W / M
GMDC, Long 1D, Breakout, VolumesGMDC has shown a good volume in the stock today and has taken support from the previous low. If it breaks its recent high of 428 with Bullish candlestick patterns like Bullish Engulfing, Hammer & Inverted Hammer, Piercing Line, Morning Star, Three White Soldiers, Tweezer Bottoms or Bullish Harami, then take a long trade on this stock.
Entry: 428 (on Bullish candlestick pattern)
Target1: 445
Target2: 450 till 480.

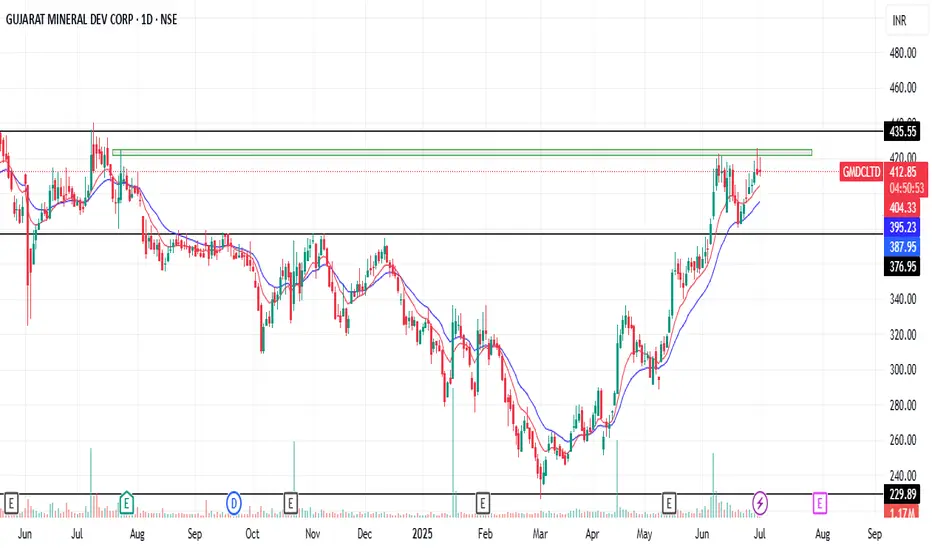

Cup & Handle and Trendline Breakout - GMDC LTDTechnical Analysis:
Current Price: ₹354 (Note: Live prices can fluctuate. As of the latest information available, GMDCLTD closed around ₹349.95 on May 16, 2025).
Targets: Your targets of ₹390 and ₹440 suggest a potential significant upside.
Cup & Handle Pattern Breakout: This is a bullish continuation pattern, and a breakout suggests a potential move higher.
Trendline Breakout: Breaking above a significant trendline also indicates potential bullish momentum.
Time Frame: A 1 to 3-month timeframe is a reasonable expectation for these patterns to play out, assuming the breakouts are sustained.
Confirming the Breakouts:
Volume: It's crucial to assess if the breakouts were accompanied by a noticeable increase in trading volume. Strong volume adds conviction to the validity of the breakouts.
Sustainability: Monitor if the price holds above the breakout levels in the coming trading sessions.
Potential Upside:
Target 1 (₹390): Represents an approximate 10.29% upside from the ₹354 level (or around 11.44% from the ₹349.95 closing price).
Target 2 (₹440): Represents a more significant potential upside of around 24.29% from ₹354 (or about 25.73% from ₹349.95).
Quarterly and Yearly Results & EPS Comparison:
Based on the available information (primarily data up to December 2024):
Latest Quarter Result (December 2024): GMDCLTD reported a rise of 26.39% in consolidated net profit. Sales also increased by 15.80% to ₹653.42 crore.
EPS (TTM - Trailing Twelve Months): The EPS for the trailing twelve months is around ₹20.97 (as per some sources).
To provide a more precise comparison of quarterly and yearly EPS, we would need the specific figures for the most recent quarters and the full financial year ending March 2025, which the company is expected to announce.
Key Factors to Monitor:
Breakout Confirmation: Watch for sustained price action above the breakout levels with good volume.
Upcoming Results: Keep an eye on the full-year results and any further quarterly results announcements, as these can significantly impact the stock price. The board meeting to consider these was held on May 15, 2025.
Sector Performance: The performance of the mining and minerals sector can also influence GMDCLTD.
Technical Indicators: Using other technical indicators like RSI and MACD can help confirm the bullish momentum.
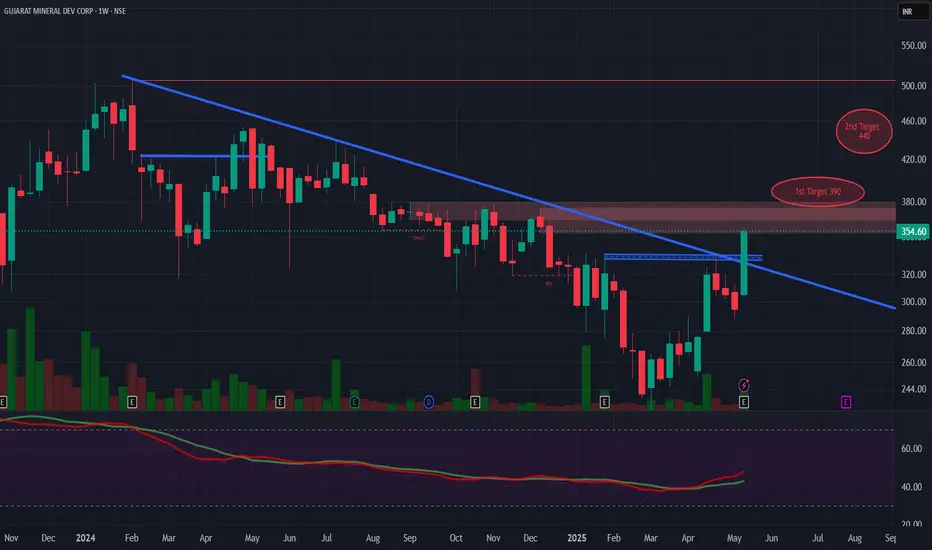

GMDC , 1WPattern is Looking very Great and is Ready to Breakout ,
if it broke the upper trendline with Good Volume then we can consider it is the best breakout
Follow for more Swing Ideas Like this

GMDC - LONGNSE:GMDCLTD Weekly chart and macd setup both looking extreme bullish for med to long term.

Review and plan for 2nd April 2025Nifty future and banknifty future analysis and intraday plan in kannada.
Few stocks too.
This video is for information/education purpose only. you are 100% responsible for any actions you take by reading/viewing this post.
please consult your financial advisor before taking any action.
----Vinaykumar hiremath, CMT

GMDCLTDprice is traded at support area so it s possible chance that price will move upper side
after breaking of trendline entry will be possible
This idea is for Educational purpose and paper trading only. Please consult your financial advisor before investing or making any position. Facts or Data given above may be slightly incorrect. We are not SEBI registered.

GMDC---AccumulateWe might have corrected in 4th wave and inverse head and shoulder in making once crosses 378 will show immense power and target of 478 as per breakout

GMDC BUYNSE:GMDCLTD Weekly parabolic formation on chart with buyers will create positive price breakout in near future. macd also giving buying signal , that is the clear cut indication of force.

GMDCLTDHi guys,
In this chart i Found a Demand Zone in GMDCLTD CHART for Positional entry,
Observed these Levels based on price action and Demand & Supply.
*Don't Take any trades based on this Picture.
... because this chart is for educational purpose only not for Buy or Sell Recommendation..
Thank you