IDFC First Bank Q2 FY26 Earnings PreviewHey everyone, with the end of September 2025 upon us, the buzz in the banking world is building around IDFC First Bank Q2 results 2026. As a private lender that's been making waves with its retail focus, the bank is set to drop its July-September quarter numbers on October 18, 2025. If you're an investor or just keen on market trends, this could be a pivotal update. Drawing from recent analyst reports and the bank's Q1 performance, let's break down what we might see – think steady growth, a big capital boost, and some margin tweaks. I'll keep it real and straightforward, no fluff.
A Quick Look Back at Q1 FY26: Solid Foundations Amid Challenges
IDFC First Bank's first quarter kicked off FY26 on a resilient note, even if profits took a hit from higher provisions. The standalone profit after tax (PAT) landed at ₹463 crore – down 32% year-on-year but up a healthy 52% from the previous quarter. This dip mainly stemmed from stress in the microfinance segment and seasonal bumps, but the core business held strong.
Key highlights? Net interest income (NII) climbed to ₹4,695 crore, showing the bank's lending engine is humming. Deposits surged 26% to ₹2,56,799 crore, with CASA (current and savings accounts) making up a solid 48% – that's great for keeping funding costs low. Advances grew 21% to ₹2,53,233 crore, powered by retail and MSME loans. Asset quality saw gross NPAs at 1.97%, with provisions at ₹1,659 crore, leading to credit costs around 2% (excluding microfinance). The microfinance book shrunk 37% to ₹8,354 crore, now just 3.3% of loans, and collections bounced back to 99%.
Overall, it's clear the bank is derisking smartly while expanding its balance sheet. Net interest margins (NIM) dipped to 5.71%, but that's part of adjusting to rate changes.
What to Expect in Q2 FY26: Growth Momentum and Margin Recovery
Analysts are optimistic for IDFC First Bank Q2 results 2026, forecasting a rebound in earnings. Consensus points to revenue growth around 17% for FY26, with profits potentially doubling (103% up) thanks to controlled costs. For Q2 specifically, expect PAT in the ₹500-600 crore ballpark, driven by 20% loan growth and income expansion of 14-19%.
NII could hit ₹5,100-5,200 crore, with NIMs stabilizing or edging up toward 5.8% by year-end as deposit rates ease. Credit costs should stick to the 2.0-2.05% guidance, with lower provisions as microfinance woes fade. The bank aims for 20-24% annual growth in loans and deposits, keeping the retail push alive.
One big wildcard: The ₹7,500 crore equity raise announced in Q1 is likely wrapping up this quarter, boosting capital adequacy to ~17.6% and giving room for more lending without hurting returns.
Strategic Plays Driving the Quarter
IDFC First is laser-focused on efficiency. They're trimming the microfinance slice to 3-3.5% by Q4 FY26 and capping branch growth at 10% yearly to drop the cost-to-income ratio to 65% by FY27. OPEX growth is expected at 13%, supporting better operating profits. CEO V Vaidyanathan has highlighted diversifying into SME, corporate, and agribusiness for balanced growth.
Stock Outlook: Potential Upside Ahead?
Shares are hovering around ₹68-70, down a bit lately, but analysts see value. Average target? ₹71-76, with earnings growth forecasted at 43.7% annually. ROE could hit 10-11% by FY26. If Q2 beats estimates, we might see a pop toward ₹80-85.
In wrapping up, IDFC First Bank Q2 results 2026 could affirm its turnaround story – stronger capital, tamed risks, and growth firepower. Mark October 18 on your calendar; it might just signal brighter days for this dynamic bank. What are your thoughts? Drop a comment below!
(Word count: 482)
Disclaimer: This is not investment advice; always do your own research.
IDFCFIRSTB trade ideas
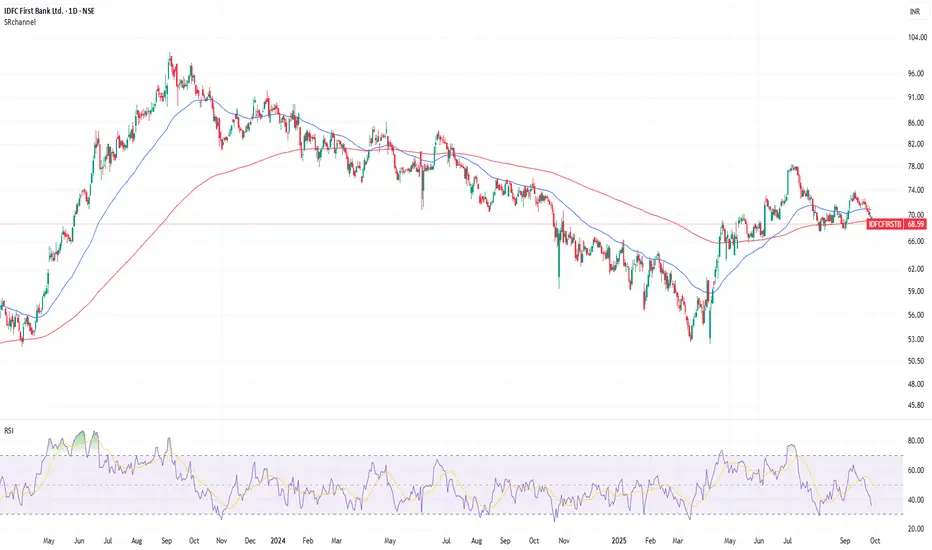
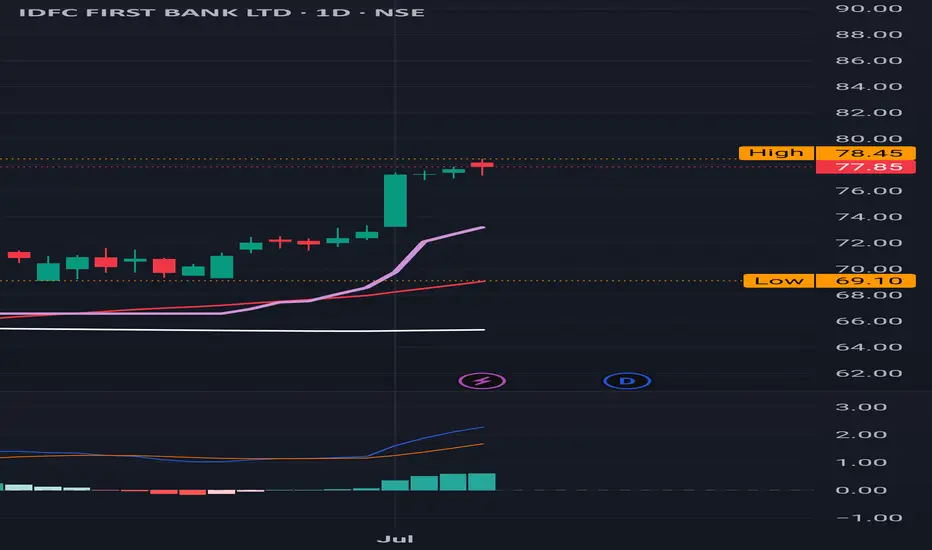
IDFC First Bank Holding Firm — Buyers Defending Key LevelsIDFC First Bank – Daily Chart Analysis
Timeframe: Daily chart observation.
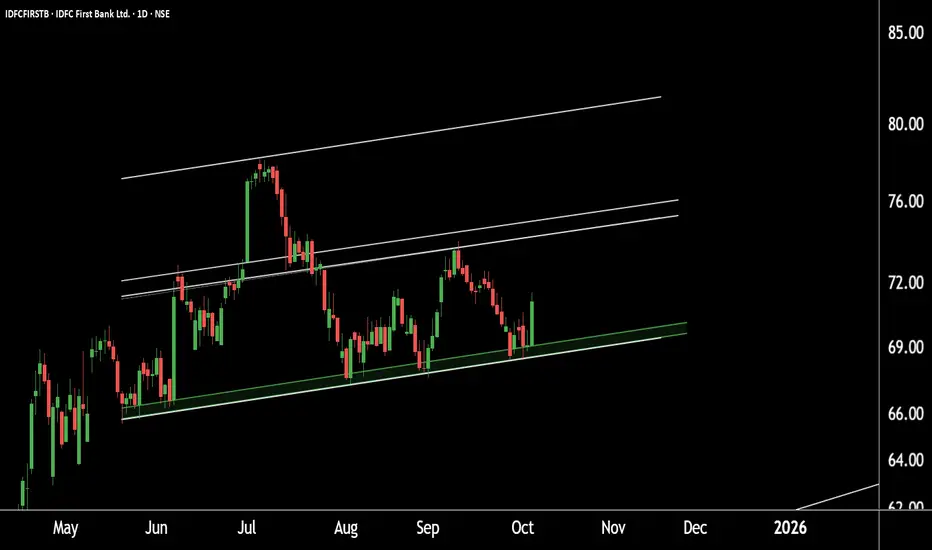
Price Structure: The stock is trading within a well-defined parallel channel.
Support Zone: Strong support identified near the ₹67–₹69 range.
Upside Target: If the support zone holds, the next potential upside target lies around ₹81–₹82.
Outlook: Sustaining above the support levels may lead to higher prices in the upcoming sessions.
Thank you.
IDFC First : Red band Resistances disappears IDFC First : Red band Resistances disappears
Moves somewhat to a Buy trajectory just seating at a resistance at 73.50 and awaiting to clear this and a for decent green candle
Another resistance is 78.50
( Not a Buy / Sell Recommendation
Do your own due diligence ,Market is subject to risks, This is my own view and for learning only .)

IDFC First Bank BuyIDFC FIrst Bank taking support at trend line. Although it is nearing a resistance line, it is likley break above as there are double test of the trend line as well as higher high and higher low formation. Buy @CMP (72) with SL of 69 and target of 75 & 85.

IDFC Fisrt Bank BuyIDFC First Bank formed a double-bottom at 200-day EMA. Buy @CMP (72.25) with SL of 70.35 and target of 74.5, 78 & 84

IDFC FIRST BANKHi, This is day candles to expect the short term bear move and long term Bull move expected. And this is takes time to achieve the targets and i could recommends this only for investors.
Additionally, this is purely educational purpose and risk is yours!
Review and plan for 28th July 2025 Nifty future and banknifty future analysis and intraday plan.
Quartely results.
This video is for information/education purpose only. you are 100% responsible for any actions you take by reading/viewing this post.
please consult your financial advisor before taking any action.
----Vinaykumar hiremath, CMT

Potential Reversal Ahead: Elliott Wave AnalysisHello friends,
Welcome to RK_Chaarts,
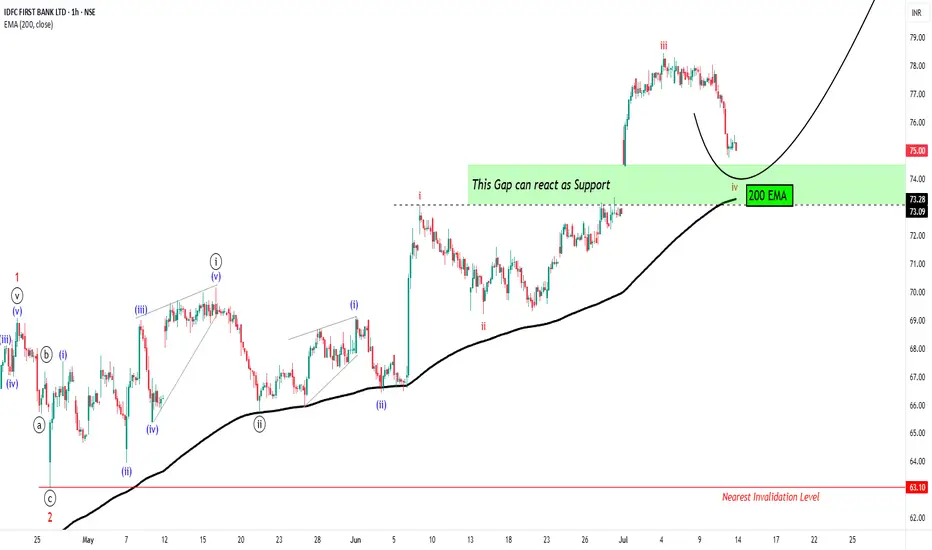
Today we're going to analyze chart of stock named IDFC First Bank, based on Elliott wave theory.
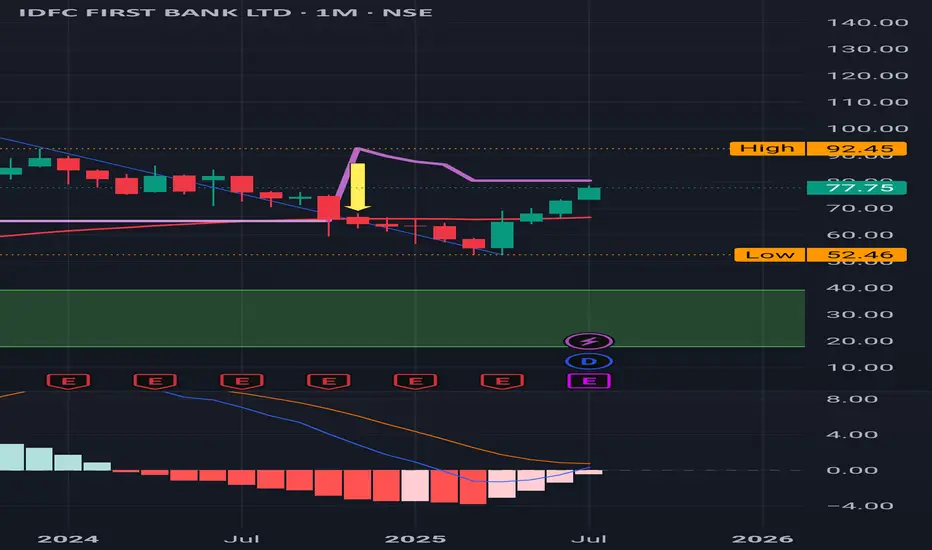
Today, we're analyzing the chart of IDFC First Bank using Elliott Wave theory. On the chart, we've marked the Elliott Waves, indicating that:
- Red wave 1 and 2 (Minor degree) have ended
- Price is unfolding into red wave 3 (Minor degree)
- Black wave ((i)) and ((ii)) (Minute degree) have completed
- Black wave ((iii)) (Minute degree) is ongoing
- Blue wave (i) and (ii) (Minuette degree) have finished
- Blue wave (iii) (Minuette degree) is in progress
- Red wave i, ii, and iii (Subminuette degree) have completed
- Possibly in the correction phase of red wave iv (Subminuette degree)
We observe that the price gapped up, retraced to correct wave iv, and is now supported by the gap zone. Along with 200Exponential Moving Average is also at Gap level which can also provide a good Support to same view.
Our estimate suggests a high probability of a price reversal. However, market uncertainties exist.
Potential price targets: 81, 93, and 100+
Nearest invalidation level: 73.09 (wave iv should not overlap wave i)
Please note that this analysis is for educational purposes only. I'm not a SEBI-registered analyst, and you should consult your financial advisor before trading or investing.
Let's see how the market unfolds. This entire study is shared solely for educational purposes. Thank you so much.
I am not Sebi registered analyst.
My studies are for educational purpose only.
Please Consult your financial advisor before trading or investing.
I am not responsible for any kinds of your profits and your losses.
Most investors treat trading as a hobby because they have a full-time job doing something else.
However, If you treat trading like a business, it will pay you like a business.
If you treat like a hobby, hobbies don't pay, they cost you...!
Hope this post is helpful to community
Thanks
RK💕
Disclaimer and Risk Warning.
The analysis and discussion provided on in.tradingview.com is intended for educational purposes only and should not be relied upon for trading decisions. RK_Chaarts is not an investment adviser and the information provided here should not be taken as professional investment advice. Before buying or selling any investments, securities, or precious metals, it is recommended that you conduct your own due diligence. RK_Chaarts does not share in your profits and will not take responsibility for any losses you may incur. So Please Consult your financial advisor before trading or investing.
IDFC First: Monthly time frame , on a verge of a Buy Signal.IDFC First: Monthly time frame , on a verge of a Buy Signal. An important Milestone.
No more Red Band Resistances .
Upcoming Important Levels : 86 / 100 .
( Not a Buy / Sell Recommendation
Do your own due diligence ,Market is subject to risks, This is my own view and for learning only .)
IDFC First: Red Band disappeared, a very important milestone , mIDFC First: Red Band disappeared, a very important milestone , momentum picks up .
Already it's in a Buy trajectory.
There are no more red bands in any time frames anymore ,Daily ,Monthly ,3 Monthly .
Important levels : 86/100
( Not a Buy / Sell Recommendation
Do your own due diligence ,Market is subject to risks, This is my own view and for learning only .)
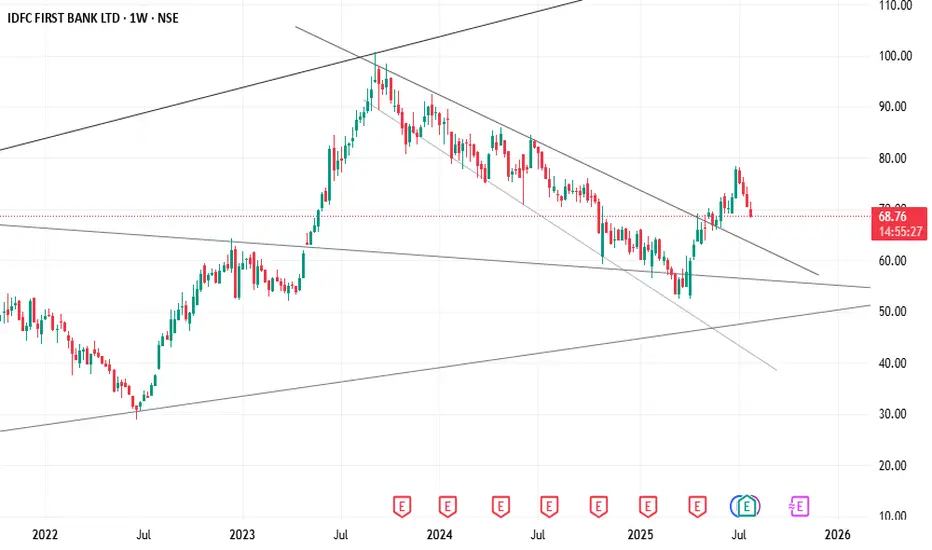
Ye Chart Kuch Kehta Hai - IDFC First BankThe weekly technical chart for IDFC First Bank (NSE:IDFCFIRSTB) indicates a positive outlook for the stock due to several key factors:
Strong Buy Signals from Moving Averages: All major moving averages (5, 10, 20, 50, 100, and 200 periods) are signaling a "Buy" on the weekly chart, reflecting strong upward momentum and trend strength.
Positive RSI and MACD Indicators: The Relative Strength Index (RSI) stands at around 57.4 on the weekly scale, which is in a healthy bullish zone below overbought levels, suggesting room for further upside. The MACD is also positive, reinforcing bullish momentum.
Support from Ultimate Oscillator and Other Indicators: The Ultimate Oscillator reading is above 50, indicating buying pressure. Although some oscillators like CCI and ADX show mixed signals, the overall technical consensus leans bullish.
Price Above Key Pivot Points and Supports: The current price is trading above key pivot levels and support zones, which typically act as strong floors for price action and reduce downside risk.
Recent Price and Volume Trends: The stock price has risen about 4.58% over the past week and 6.12% over the last month, indicating sustained buying interest. Mutual fund holdings have also increased recently, which often supports price appreciation.
Analyst Sentiment and Growth Indicators: Over 50% of analysts recommend a "Buy" rating with an average target price near current levels, reflecting confidence in the stock’s growth potential. The company has shown consistent revenue growth and outperformance relative to peers in recent quarters.
In summary, the weekly technical chart for IDFC First Bank shows a confluence of bullish signals from moving averages, momentum indicators, and price action, supported by positive market sentiment and fundamental growth trends. This technical setup suggests a likely upward movement in the stock price in the near term on a weekly basis

IDFC First : Red band resistance
IDFC First : Red band resistance
( Not a Buy / Sell Recommendation
Do your own due diligence ,Market is subject to risks, This is my own view and for learning only .)


A look at IDFC first bank"Wait till it sustain above 64"
if sustain above 64 then play for 76 else avoid.

IDFC First Bank : Rallied from a Buy Signal, now at a resistance
IDFC First Bank : Rallied from a Buy Signal, now at a Red band resistance.
( Not a Buy / Sell Recommendation
Do your own due diligence ,Market is subject to risks, This is my own view and for learning only .)

idfc first bank going to boom upside ??yes as per my analysis and technical , it is uspport at demand and start as uptrend and final target of 177 first target of 135

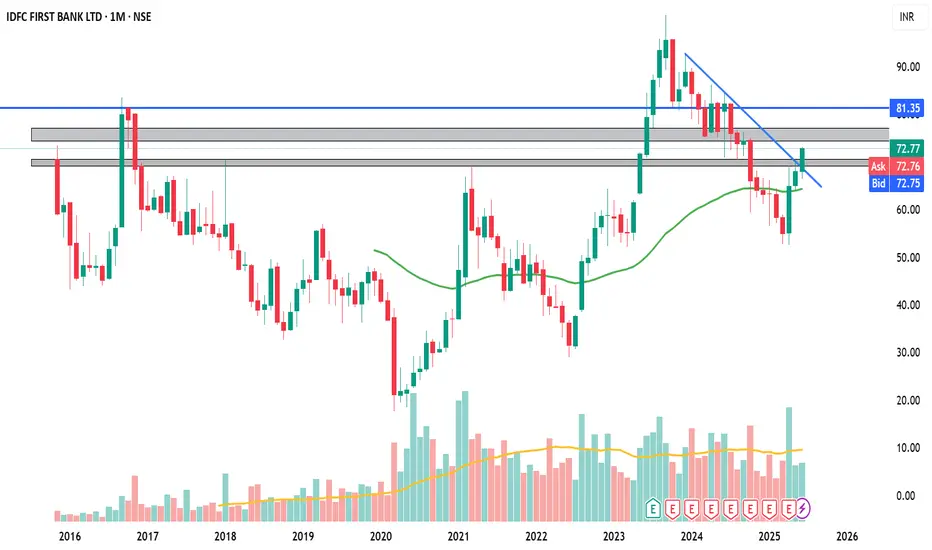
[TechnoFunda]IDFC FIRST BANK – DEEP DIVE INTO MULTI-YEAR SUPPORTTECHNICAL ANALYSIS:
Ascending broadening channel structure
– Since the Aug-20 low (~₹15) price has traced a steady up-sloping trendline, touching in Mar-21, Feb-22 and now Apr-25
– Parallel resistance capped rallies in Feb-18 and Sep-23, defining a ~₹80–100 supply zone
– Channel slope averages ~30% annualized gains from support to resistance
EMA confluence and momentum
– April formed a bullish engulfing candle that closed above the 50 EMA (₹63.8), signalling renewed buyer conviction
Elliott-style wave count
– Wave 1: Aug-20 to Feb-23 advance into channel top (₹100)
– Wave 2: Feb-23 to Apr-25 retrace back to support/200 EMA (₹55)
– Wave 3 (projected): expected to carry price toward channel top again, targeting ₹95–100
Measured-move & targets
– Channel height (~₹85–15 = ₹70) added to support gives a potential target near ₹125 – bullish scenario only on a clean break above channel resistance
– Shorter-term target zone: ₹75 (minor swing highs) → ₹85 (channel midline)
Risk management
– Invalidation: monthly close below ₹55 erodes the uptrend and negates wave-count
– Use a stop 1.5× ATR below the Apr-25 low (₹50) for defined risk
FUNDAMENTAL ANALYSIS:
Revenue & earnings trajectory
– Quarterly revenue up from ~₹40 B in 2020 to ₹113 B in Q1 ’25, reflecting strong loan book growth and fee income diversification
– Net income swung from losses in 2018–19 to a peak of ~₹12 B in 2023, and stays positive at ₹3 B in the latest quarter
Asset-quality improvement
– GNPA ratio down from ~2.2% in 2020 to ~1.3% in Q1 ’25; PCR steadily rising above 75%
– Slippages have trended lower quarter-on-quarter, supporting margin stability
Margin & capital metrics
– Net interest margin at ~4.2%, above industry average, driven by retail and SME lending
– CET-1 ratio comfortably above 13% with Tier-1 capital buffer, enabling healthy credit growth
Valuation & catalysts
– Trades at ~0.4× book value and 10× trailing P/E vs sector averages of 1.5× and 15× respectively
– Potential rerating catalysts: continued NIM expansion, sustained reduction in credit cost, digital customer growth
MACRO & SENTIMENT CONTEXT:
- RBI rate cycle poised for cuts in H2 ’25, which could support credit demand
- Bank Nifty outperforming broader markets; institutional flows have rotated into midcap banks
- Relative strength vs Nifty: RSI on a monthly sits near 50, rising from oversold – room to run before overbought
TRADING PLAN:
- Enter partial long near current price (₹66–70)
- Add on break above ₹75 with conviction
- Targets: ₹75 → ₹85 → ₹95–100 (channel top)
- Stop-loss: ₹50–55 zone (monthly close basis)
- Trail stops above each new swing low to lock in profits as price advances

IDFC FIRST BANK : Important milestone achieved IDFC FIRST BANK : Important milestone achieved . Closed above 200 SMA .
This has happened after a long wait since January 2024.
It's in a buy trajectory.
MACD looks fantastic.
Resistance bands are clearly visible on the chart which could also act as a target band .
( Not a Buy / Sell Recommendation
Do your own due diligence ,Market is subject to risks, This is my own view and for learning only .)

IDFC FIRST LONG ON PULLBACKLOOKS GOOD ENOUGH TO BUY AT 60 TO 65 ZONE
Stoploss Is 49
Target 1 - 85
Target 2 - 100
Target 3 - 123
Long Term Investment
Upside 125 Huge Target

"IDFC First Bank: A Potential Swing Trade Setup – Key Levels to IDFC First Bank: Swing Trade Setup – Key Levels & Entry Strategy
Market Overview:
IDFC First Bank has recently pulled back after making an all-time high and is now testing a critical support zone on the monthly timeframe. This presents a potential swing trade opportunity, provided we see confirmation at key levels.
Today's low is ₹52.60, and a break below ₹52.15 could signal further downside before a strong reversal. This trade setup focuses on taking advantage of liquidity grabs and price structure shifts.
Step-by-Step Trade Plan
1. Key Price Levels & Structure Analysis
📌 Current Price Action: Market tested previous lows and showed signs of stabilizing.
📌 Breakdown Level: If ₹52.15 is breached, it could trigger further downside liquidity grab.
📌 Potential Entry Zones:
Early Entry: Above ₹52.15, but only after confirmation of reversal signals.
Safer Entry: If no confirmation appears, wait for a dip between ₹50 – ₹46.
Liquidity Tap Zone: ₹42, where stop losses of many traders may be triggered before a potential upside move.
2. Profit Targets & Risk-Reward Ratio
📈 Profit Targets:
1️⃣ ₹58.65 – First short-term target.
2️⃣ ₹63 – Second target for a larger swing move.
📉 Stop-Loss Strategy:
Place stop-loss near ₹42, below key liquidity zones.
Adjust stop-loss as per risk appetite.
💡 Risk-Reward Calculation:
Entry (₹52.15 - ₹50)
Stop-Loss (₹42)
Target 1 (₹58.65) → Risk-Reward Ratio ~ 2:1
Target 2 (₹63) → Risk-Reward Ratio ~ 3:1
3. Confirmation & Execution Plan
✅ Scenario 1 (Confirmation after ₹52.15 Breakout) – If price stabilizes above ₹52.15 with strong momentum, an early entry can be considered.
✅ Scenario 2 (No Confirmation) – If price continues to decline, wait for accumulation between ₹50 – ₹46.
✅ Scenario 3 (Liquidity Grab at ₹42) – If price taps this zone and rebounds strongly, it may signal a major reversal.
Final Thoughts & Risk Management
🔹 IDFC First Bank is in a critical zone, where institutional buying could occur.
🔹 Patience is key – Wait for confirmation before entering aggressively.
🔹 Manage risk with a strict stop-loss – Avoid emotional trading.
💡 Will IDFC First Bank hold key support levels and push higher, or is a deeper liquidity grab needed before reversal? Let’s analyze further! 🚀📊

IDFCFIRSTBNSE:IDFCFIRSTB Long for short term trade
Only technical view and that's also for very short term.
Reversal seems good enough to execute trade at mentioned price.
Volume is being supportive for up move.
Disclaimer: My ideas are not for recommendation purpose. Just sharing ideas with community.

IDFC FITST BANK : Rebound from the support level IDFC FITST BANK : Rebound from the support level of 52 ish .
Sitting near the recent resistance.
Major resistance level to test is at 65 .
Still under 200 SMA
MACD went above 0 which is a positive sign.
The pull back from the support level of 52 shows the interests of buyers.
A few green candles closing above 200 SMA and staying afloat above 200 SMA will be crucial in coming days.
( Not a Buy / Sell Recommendation
Do your own due diligence ,Market is subject to risks, This is my own view and for learning only .)
