IOLCPBreakout trading implementation:
1. **Identifying New Trends:** Breakout trading helps traders identify the beginning of new trends by focusing on price levels where an asset breaks out of its historical trading range.
2. **Volatility Indicator:** Breakouts often occur when there's increased volatility in the market. Monitoring breakouts can provide insights into shifts in market sentiment and potential price movements.
3. **Entry Points:** Breakout points serve as potential entry points for traders looking to ride the momentum of a newly established trend. Buying on a breakout can capture the early stages of a price movement.
4. **Confirmation of Strength:** Successful breakouts indicate the strength of a trend. If an asset breaks out with high volume and follows through with sustained price movement, it suggests a strong trend in that direction.
5. **Avoiding False Signals:** Breakout strategies often include using indicators or confirmation signals to avoid false breakouts. This can enhance the accuracy of trade decisions.
6. **Defined Risk and Reward:** Breakout trading allows for setting clear stop-loss levels below the breakout point, which helps manage risk. Traders can also calculate potential profits based on the distance between the breakout point and a projected target.
7. **Adaptable to Various Markets:** Breakout trading can be applied to various markets, including stocks, forex, commodities, and cryptocurrencies. The concept remains consistent across different assets.
8. **Flexibility:** Traders can adapt breakout strategies to their preferred timeframes, whether they are day traders, swing traders, or long-term investors.
9. **Liquidity Opportunities:** Breakout points are often associated with increased trading volume, which can provide better liquidity for executing trades.
10. **Risk vs. Reward Assessment:** Traders can evaluate the potential risk of a trade (stop-loss) against the potential reward (target price), aiding in decision-making and portfolio management.
11. **Psychological Advantage:** Successful breakout trades can boost a trader's confidence and discipline, reinforcing the effectiveness of their strategy.
12. **Market Events:** Breakouts can occur around significant market events such as earnings reports, economic data releases, or geopolitical developments, offering traders opportunities to capitalize on sudden price movements.
Remember, while breakout trading offers potential advantages, it also carries risks. False breakouts and market reversals can lead to losses. Successful implementation requires a solid understanding of technical analysis, risk management, and the ability to adapt to changing market conditions.
IOLCP trade ideas

Good Fundamental educational purpose CMP 368 closed below 270(w) Target Follow Chart
Study before Investing

IOLCP for Swing/Positional IOLCP Prediction for Swing/ Posional Trading
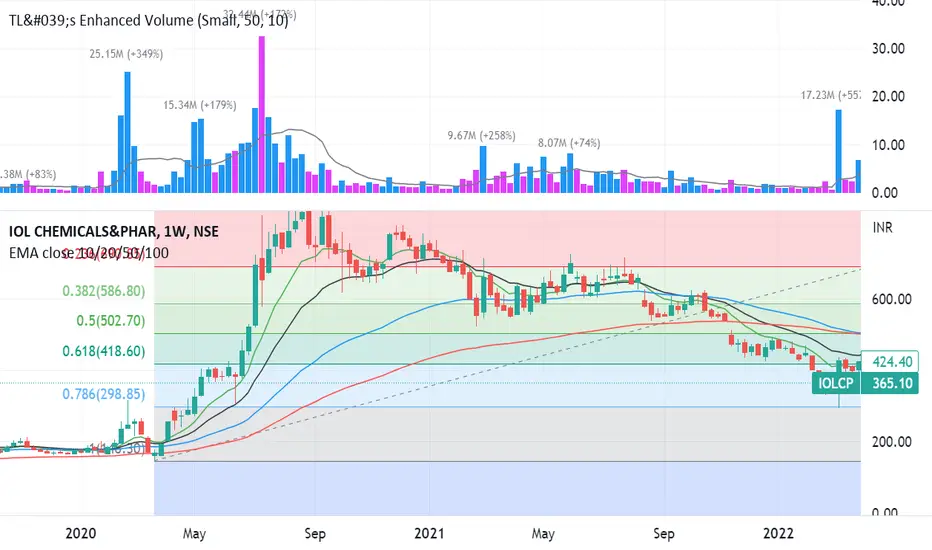
First breakout at Entry 1 level. Trendline breakout at Entry 2 and this entry 2 was retested . There is a resistance 531-539 level. You can enter in trade at Entry 3 level above 540. It can again come to 485-500 level or 465-468 level and will give upmove. You can also enter into the trade in these levels also or you can entry at any of the above levels according to your experience.
SLs- according to your entry and RRR
Targets- 531,540,570,589,641,690,744,735,845,895,945,1000,1050,1100,..
According to your “STOMACH” book your profit. Always maintain your risk management.
Watch Carefully – The Chart Explains For Itself.
Can anyone tell me which chat patterns are shown up here?
Disclaimer:
I am not a SEBI Registered Analyst. Anything posted here is my own analysis and views. This is created for educational purposes only. Always consult your Financial Advisor before taking any decision or trade.
Request: Please support by Like, follow, comment, share and boost.
Happy trading.
About IOLCP –
IOL Chemicals & Pharmaceuticals Ltd. engages in the manufacture of organic and inorganic chemical compounds. It operates through the following geographical segments: India and Rest of the World. The company was founded on September 28, 1986 and is headquartered in Ludhiana, India.
You can follow me in social media through links given below-

Looking to Rise and ShineStock is gaining good momentum for last few weeks. Slow and steady growth. Look for 4 figure price within 12 months.

Iolcp hidden bullish divergence and classic bullish divergenceIolcp fundamentally strong company
Now stock is in one side looking hidden bullish divergence and in other sight stock looking classic bullish divdrgence .both are in one stock in one time is good sign to buying signal
I am not sebi registered

IOL Chemicals & Pharmaceuticals Ltd IOL Chemicals & Pharmaceuticals Ltd is a leading pharmaceutical (APIs) company and is a significant player in the specialty chemicals space. It serves the domestic and export market. It is the largest player of Ibuprofen (pain killer) globally with a worldwide market share of 35%.
Firstly, let's start with the concept of Elliott Wave Theory. This theory is a method of technical analysis that attempts to identify recurring patterns in the stock market, based on the idea that stock prices move in waves. There are five waves in an uptrend and three waves in a downtrend, and these waves are labeled 1, 2, 3, 4, and 5 for an uptrend, and A, B, and C for a downtrend. The wave 2 that is being referred to in this statement is part of a larger uptrend, and typically represents a pullback or correction in the stock price, following an initial upward movement in wave 1.
When a stock has completed its retracement of wave 2, it is believed to be ready for a new upward movement in wave 3. Wave 3 is typically the strongest and longest wave in an uptrend, and often sees the largest price gains for investors. It is important to note that while Elliott Wave Theory is a popular tool used by technical analysts, it is not foolproof and cannot predict the future movements of a stock with absolute certainty.
It appears that the chemical sector is expected to experience a bullish trend in the near future. This may be due to a variety of factors, such as positive earnings reports from key companies in the sector, or increased demand for chemical products due to economic growth or other industry-specific factors. However, it's important to note that predicting sector performance can be difficult, and investors should always conduct thorough research and analysis before making investment decisions.
This seems from the chart that the stock has completed its retracement of wave 2 and will go in wave 3 now...! This chart is dedicated for investor community. It seems now the sector of chemical will be on focus. Additionally, the chart suggests that the chemical sector is expected to perform well in the near future. However, as with all investment decisions, it's important for investors to conduct their own research and analysis before making any decisions.
Thank you for following me...!

IOLCP long0.786 retracement (taken from last march 2020 rally to ATH).
Near 300 big volume delivery observed.
Talking about fundamentals, they are great !!!
As everyone says, pharma and construction are sectors for the next five years, then its my pharma top pick 2
IOLCP look goodsIOL Chemicals Receives Patent for Improved Sartan Drugs Preparation Process; Shares Jump 7%
can expected to touch trend line @ 500
once cross then round bottom pattern form

Weekly Chart - IOL Chemicals PharmaThe Structure looks good to us, waiting for this instrument to correct and then give us these opportunities as shown on this instrument (Price Chart).
Note: Its my view only and its for educational purpose only. Only who has got knowledge about this strategy, will understand what to be done on this setup. its purely based on my technical analysis only (strategies). we don't focus on the short term moves, we look for only for Bullish or Bearish Impulsive moves on the setups after a good price action is formed as per the strategy. we never get into corrective moves. because it will test our patience and also it will be a bullish or a bearish trap. and try trade the big moves.
we do not get into bullish or bearish traps. We anticipate and get into only big bullish or bearish moves (Impulsive Moves). Just ride the Bullish or Bearish Impulsive Move. Learn & Know the Complete Market Cycle.
Buy Low and Sell High Concept. Buy at Cheaper Price and Sell at Expensive Price.
Keep it simple, keep it Unique.
please keep your comments useful & respectful.
Thanks for your support....
Tradelikemee Academy

IOLCP look goodsResistence @ 358
2nd Resistence @ 388
Once cross 520 level
Goverment appvoed Patent for Invention Entitled

IOLCP BUY @ 343.3entrt 343.3
qty 20
risk 206rs
sl 333
very tight SL
expecting good short term move. Overall its bearish with 200 price range as very big support


Price action HH & HLAs chart says price wont go in one direction upside.
Therefore price has came down to retrace and retest its Breakout level.
Bottom side can be bought or added.
Invest your time before investing your money.


IOLCP - A booming chemical stockRead chart well !!!
Company is almost debt free. Company has delivered good profit growth of 67.35% CAGR over last 5 years.
Company has a good return on equity (ROE) track record: 3 Years ROE 51.94%.
IOL Chemicals & Pharmaceuticals Ltd. engages in the manufacture of organic and inorganic chemical compounds.
It operates through the following geographical segments: India and Rest of the World.
The company was founded on September 28, 1986 and is headquartered in Ludhiana, India.
It is the largest player of Ibuprofen (pain killer) globally with a world market share of 35%.

IOLCP - Downtrend - Short term target 382 , may be 302 as well IOLCP had a massive run up and has been been on bearish trend after making all time high. This is a no touch stock right now, as the short term and mid term trend are bearish. It's making higher high and lower lows, one can start investing after the trend starts reversing to bullish. Volume has also died down, basically no interest from institutional investors. Don't try catching a falling knife. You can keep shorting the stocks until trend changes. I see target 382 coming and may be 302 as well.

IOL CHEMICALS - NEAR DEMAND ZONEIOL Chemicals seen strong holding the major support trend line.one can go long near to the support with stops below support zone.
this analysis is for educational purpose only.
we are not SEBI registered, kindly contact your financial advisor before taking trade.

IOLCPIOLCP - Uptrend
Above 50 Moving Average
RSI - @ 59.33 which is good
MACD - uptrend
1st Target - 620 Next target 630
Incase there is a fall There is good support at 596
Like & Follow :)

iolcp its in consolidation from a long time , it may give a good move upside after the trendline breakout .

IOL CHEMICALsStocks now break the trendline
Bullish trend start according to me
Target mentioned in chart

Bullish on IOL Chem(Daily)
- Change of Polarity ↕
- Symmetric triangle pattern breakout
- closed above 200 MA


