Netweb Technologies: The Backbone of India’s AI RevolutionWhile everyone's talking about AI, Netweb is actually BUILDING India's AI backbone - and the results are spectacular! 📈
What's Happening:
● Stock soared 116% in 6 months (₹1,638 → ₹3,535) 📊
● Just secured ₹450 Cr fresh order (Sep 22) + earlier ₹1,734 Cr NVIDIA deal
● Q1 results were phenomenal - Revenue & PAT both DOUBLED! 💰
Why This Matters:
Netweb is powering India's ambitious AI Mission with high-performance servers and GPU systems. They're not just riding the AI wave - they're the infrastructure making it possible.
The Numbers Speak:
✅ Revenue: ₹301 Cr (+102% YoY)
✅ Profit: ₹30.5 Cr (+101% YoY)
✅ AI Segment: +300% growth
✅ Order book: Strong visibility till FY27
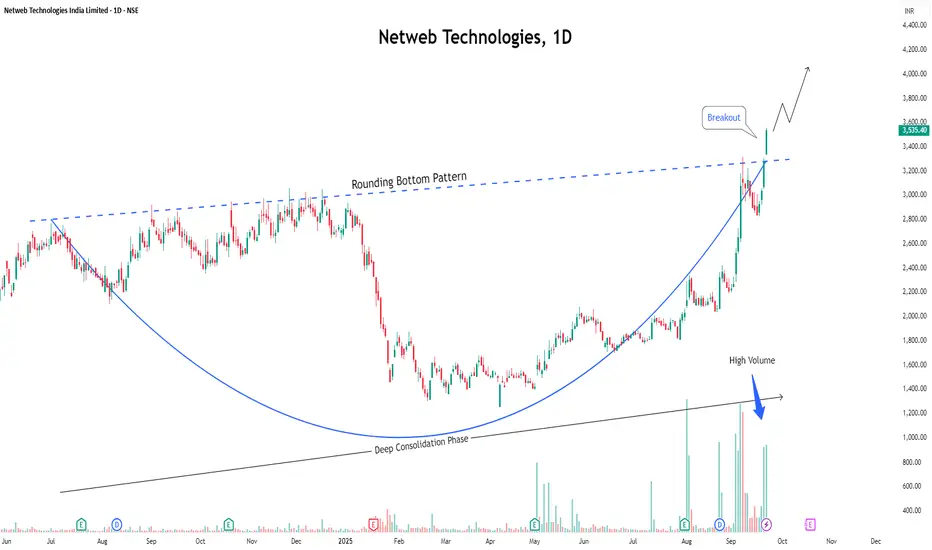
Technical View:
● Fresh breakout confirmed from a rounding bottom, with robust volume support.
● Setup looks primed for another strong rally ahead. 🚀
⚠️ Disclaimer: This is an educational post meant for learning purposes only. Not a stock recommendation.
NETWEB trade ideas
netwebThe company's order book pipeline as on June 30, 2025 stood at ₹4,142 crore.
Guidance
Last month, Netweb Technologies' CMD Sanjay Lodha told CNBC-TV18 that the first quarter was a robust one for the company.
The AI segment, which used to be at 7% two years ago was 29% in the first quarter of FY26 and will keep growing at the same pace of 40% compound annual growth rate (CAGR) seen in the past, the company said.
It added that 20-22% of its business would come from AI. Netweb Tech increased the AI contribution guidance from 20% to 22%.
It said 50% of its business comes from the Centre and the remaining comes from high-end enterprises.
The company also maintained its EBITDA margin guidance of 14%. Its profit after tax (PAT) margin guidance is of 10-10.5% for this fiscal. The company said its order execution timeline is between eight to 12 weeks.
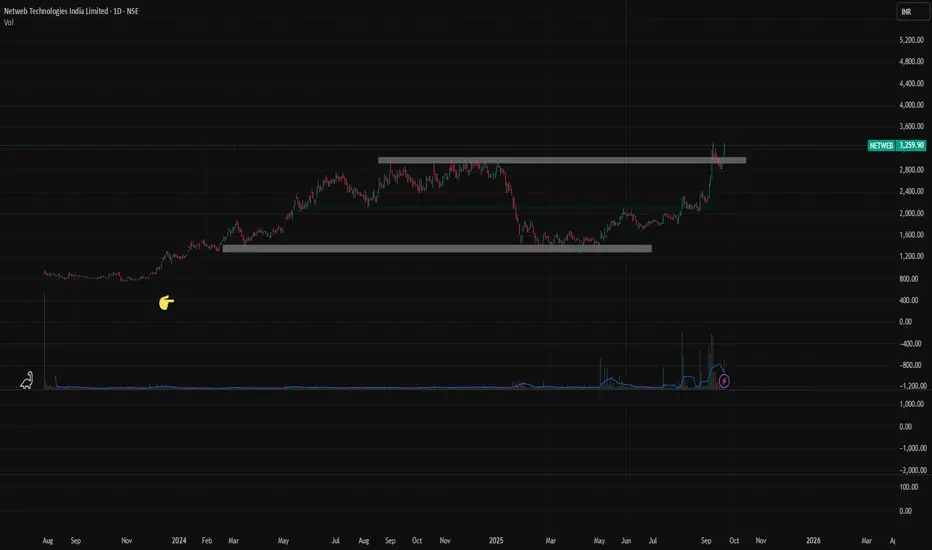
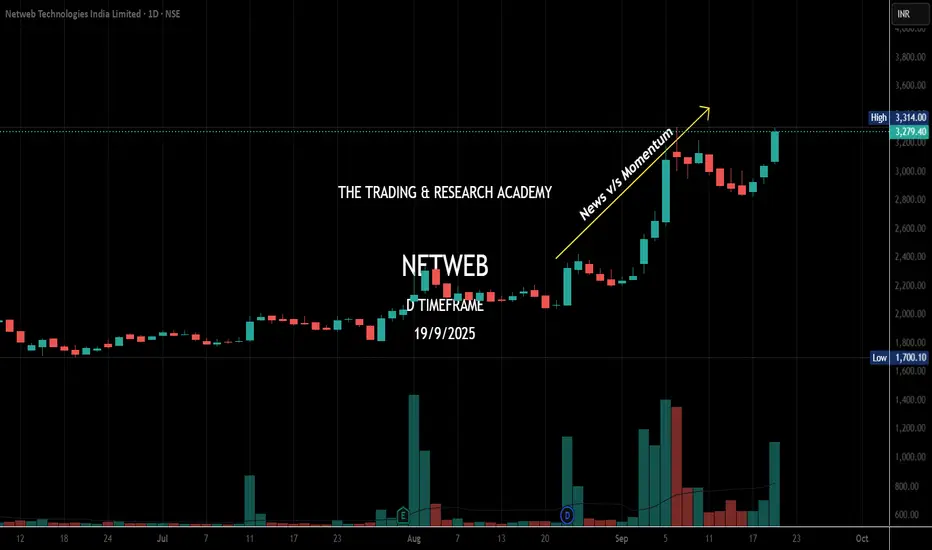
CHART SPEAKS- NETWEB TECHIn my chart speaks series, i have been writing about the charts which are rallying high & corresponding news hits the market later. It means the price is leading the news! This has started happening often lately.
THE NETWEB NEWS CAME TODAY & SEE THE CHART MOVING EARLY THIS MONTH!
Netweb technologies: Co secures rs. 450 crore order for Tyrone Ai GPU accelerated systems from leading Indian tech distributor
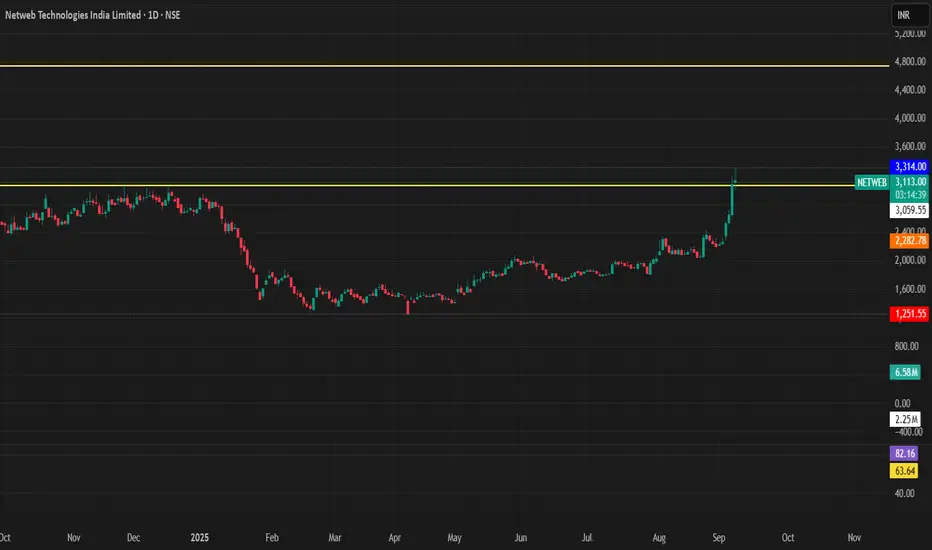
netweb tech india buy near 3060 closing base tgt 4700if Netweb close above 3060 today then buy for positional tgt is 4700 ,
fundamental is good , growth in net profit , gorwth in sales, growth in opm.
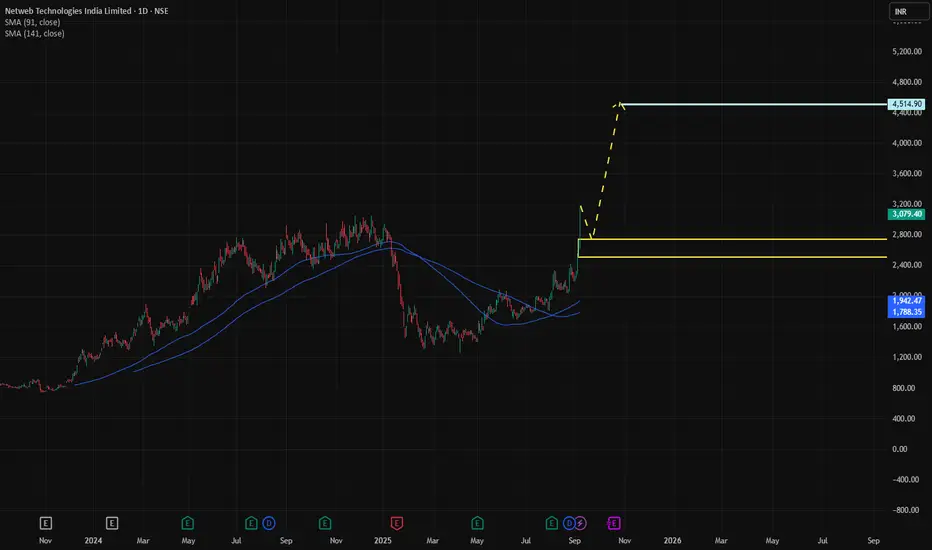
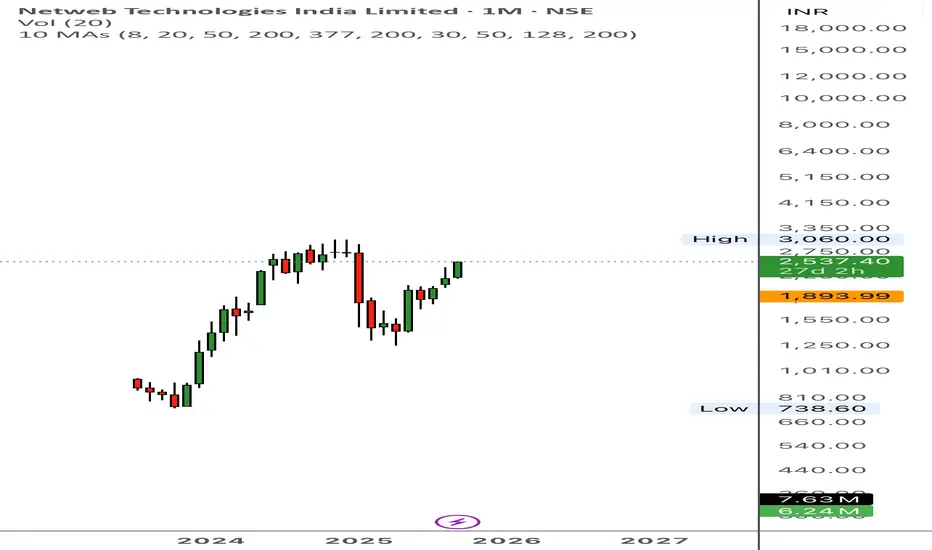
NETWEBMulti-Timeframe (MTF) Analysis
HTF (Higher Timeframe) → Yearly, Half-Yearly, and Quarterly all show UPTREND with strong support around 1139–1309.
Average = 1321 (long-term base demand).
MTF (Medium Timeframe) → Monthly, Weekly, and Daily also UP, with demand zones tightening at 2037–2725.
Average = 2360 (medium-term strong demand).
ITF (Intraday Timeframe) → 60M–240M also UP, clustered demand around 2872–2907.
Average = 2890 (short-term demand).
👉 Overall alignment: All timeframes are in UPTREND, so the structure is bullish.
📈 Trade Plan
Entry-1: 2725
Stop Loss (SL): 2513 (≈8% risk)
Target: 4534 (≈66% reward)
Risk per share: 212
Reward per share: 1809
Risk-Reward Ratio (RR): 8.53 (very favorable)
💰 Capital & Profitability
Qty: 1000 shares → Total Buy Value = 2,725,000
Brokerage + Taxes: 0.49% → ₹13,357
Profit if target hits: 1,809,000
Net Profit after costs: 1,795,643
Loss if SL hits: 225,357
Net RR: 7.97 (still excellent).
📊 ROI & Leverage
Capital Value considered: 953,750 (MTF 65%)
Leverage effect: Only ~35% of cash deployed, rest financed.
ROI in 4 months (if target hit): 182% after deducting interest.
⚠️ Key Observations
Entry zone (2725) is close to Daily demand (2725–2513). Good location.
SL (2513) sits at lower edge of daily demand → smart protection.
Target (4534) is ~50% higher than Last High (3060) → aggressive but supported by structure.
Risk very low vs reward, but you must watch minor supply at 18,100 (highlighted in sheet).
Leverage used (65%) amplifies returns, but also increases sensitivity to SL hit.
✅ Conclusion:
This is a highly asymmetric bullish trade. With all MTFs aligned UP, entry near demand, and a stellar RR (8.5+), the plan is strong. The only caution is the stretch in target (4534) — it requires sustained trend continuation. Managing partial profits near 3060 (previous high) could derisk while still aiming for extended targets.
NetwebNetweb showing a good positional structure with a bullish setup forming on the charts. Trend remains positive!!
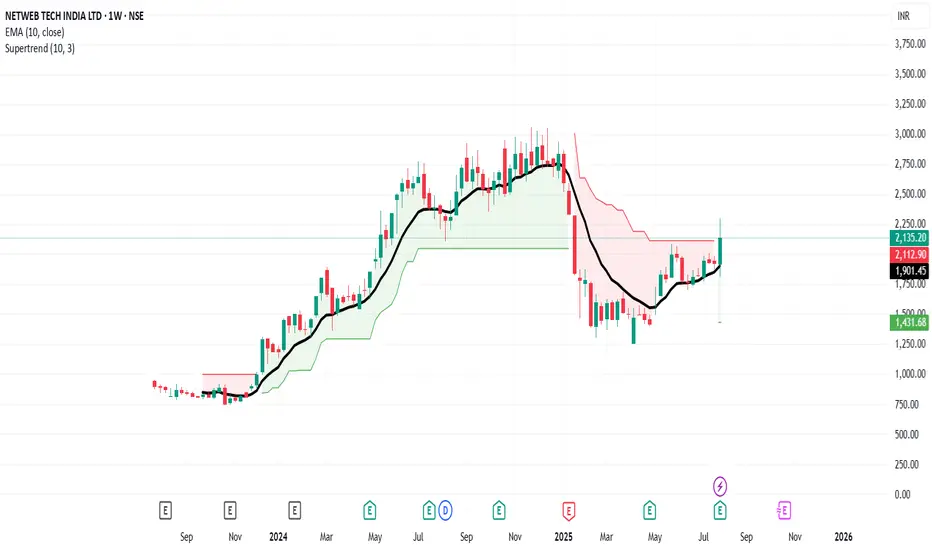
Long NETWEBSuperTrend has turned positive on the weekly chart, with the recent closing price trading above the 10 EMA
BUY NETWEB
Entry - 2296
SL - 1811
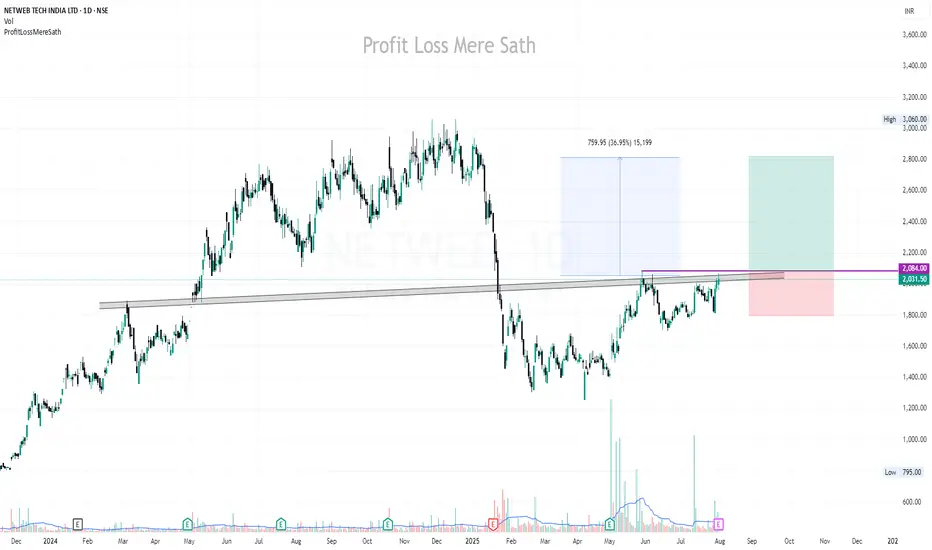
NETWEB | Buy above 2085 | Strict SL below 1800 | Target 2830Disclaimer:
This is not financial advice. Please do your own research or consult with a financial advisor before making any investment decisions. Investments in stocks can be risky and may result in loss of capital.
Netweb technology I'm not a SEBI REGISTERED ANYLISIS
just for learning purpose
above the blue line close in D chart candle i will buy and put strictly SL to below red line...once candle close below Red line in D chart...i will close the Trade...
Note: 1
Breakout candle should close time 6 or below 6 points I will buy same day or I will wait for the blue line price to re-trace)
Note:2
If previous volume is buyers(for ex- 10k) Breakout candle volume should be low in present day with buyers volume(below 10k for ex- 9k like this)
target check the chart
WAIT FOR ENTRY......then after
WAIT FOR TARGET...... or
WAIT FOR STOPLOSS
educational purpose only
oits simple ORB WITH VOLUME BREAKOUT STRATEGY...with small condition apply for selecting the stocks
owt not response for your profit and loss

Netweb Technologies India Ltd. (NETWEB)I'm not a SEBI REGISTERED ANYLISIS
just for learning purpose
above the blue line close in D chart candle i will buy and put strictly SL to below red line...once candle close below Red line in D chart...i will close the Trade...
target check the chart
educational purpose only
oits simple ORB WITH VOLUME BREAKOUT STRATEGY...with small condition apply for selecting the stocks
owt not response for your profit and loss

Netweb-a breakout stock to watchNetweb has recorded stellar quarterly results- double digit earnings and revenue growth YoY. But stock has not performed since market was unfavorable and it has stored pent up energy of strong earnings backing. Now stock has reached a resistance zone on daily chart that too with a humungous volume. Today its quarterly earnings were announced and yet again stock has delivered very good results. It's a good breakout stock to watch.

Stock Alert: NETWEB 🚨 Stock Alert: NETWEB 🚀
🔹 Breakout Setup
Buy Above ₹3073
Target 1 (T1): ₹3780 🎯
📊 Key Metrics:
Market Cap: ₹16,888 Cr
Strong Sales Growth: +73% YoY
Avg Vol: 64 Cr | RVol: 125%
Bullish Momentum 📈
🔍 Stay disciplined and trade smart!
#StockTrading #TechnicalAnalysis #BreakoutStocks

NETWEB TECH INDIA LTD S/RSupport and Resistance Levels:
Support Levels: These are price points (green line/shade) where a downward trend may be halted due to a concentration of buying interest. Imagine them as a safety net where buyers step in, preventing further decline.
Resistance Levels: Conversely, resistance levels (red line/shade) are where upward trends might stall due to increased selling interest. They act like a ceiling where sellers come in to push prices down.
Breakouts:
Bullish Breakout: When the price moves above resistance, it often indicates strong buying interest and the potential for a continued uptrend. Traders may view this as a signal to buy or hold.
Bearish Breakout: When the price falls below support, it can signal strong selling interest and the potential for a continued downtrend. Traders might see this as a cue to sell or avoid buying.
20 EMA (Exponential Moving Average):
Above 20 EMA(50 EMA): If the stock price is above the 20 EMA, it suggests a potential uptrend or bullish momentum.
Below 20 EMA: If the stock price is below the 20 EMA, it indicates a potential downtrend or bearish momentum.
Trendline: A trendline is a straight line drawn on a chart to represent the general direction of a data point set.
Uptrend Line: Drawn by connecting the lows in an upward trend. Indicates that the price is moving higher over time. Acts as a support level, where prices tend to bounce upward.
Downtrend Line: Drawn by connecting the highs in a downward trend. Indicates that the price is moving lower over time. It acts as a resistance level, where prices tend to drop.
RSI: RSI readings greater than the 70 level are overbought territory, and RSI readings lower than the 30 level are considered oversold territory.
Combining RSI with Support and Resistance:
Support Level: This is a price level where a stock tends to find buying interest, preventing it from falling further. If RSI is showing an oversold condition (below 30) and the price is near or at a strong support level, it could be a good buy signal.
Resistance Level: This is a price level where a stock tends to find selling interest, preventing it from rising further. If RSI is showing an overbought condition (above 70) and the price is near or at a strong resistance level, it could be a signal to sell or short the asset.
Disclaimer:
I am not a SEBI registered. The information provided here is for learning purposes only and should not be interpreted as financial advice. Consider the broader market context and consult with a qualified financial advisor before making investment decisions.


Netweb has formed cup and handle patternNetweb has formed cup and handle pattern. Once can put a stoploss at 2530 for a target of 3100. Not a financial advice. Do your own research before taking positions.


Trend Trading of Netweb TechnologiesIntroduction
Netweb Technologies India Limited is a leading Indian-origin, owned and controlled OEM in the space of High-end Computing Solutions (HCS). The company has been at the forefront of cutting-edge innovation for two and a half decades, with a focus on high-end computing solutions and comprehensive manufacturing capabilities. In this report, we will analyze the company's financial performance, growth drivers, and technical analysis to identify potential trends and opportunities for trend trading.
Financial Performance
Netweb's financial performance has been impressive, with a significant increase in revenue, EBITDA, and PAT. The company's revenue grew from ₹ 2,624 Mn in FY2021 to ₹ 7,359.62 Mn in FY2024, with a CAGR of 166.3%. The EBITDA margin also increased from 15.8% in FY2021 to 29.4% in FY2024. The PAT also grew from ₹ 759.03 Mn in FY2021 to ₹ 759.03 Mn in FY2024.
Growth Drivers
Netweb's growth drivers include:
Enhanced Capabilities: The company has commissioned a cutting-edge manufacturing facility equipped with the latest Surface Mount Technology (SMT) in May 2024.
Enhanced Opportunities: The growing investment in Generative AI infrastructure by government bodies and large enterprises is driving demand for large language model (LLM) oriented solutions.
Expanding Product Portfolio: Netweb's diversification by offering Enterprise-grade network Switches opens up new opportunities and markets for the company.
Strong Topline Visibility: Netweb boasts a robust pipeline valued at ₹ 34,466 Mn, alongside an L1 value of ₹ 3,142 Mn and an order book of ₹ 4,112 Mn as of March 31, 2024.
Technical Analysis
Based on the company's financial performance and growth drivers, we can identify the following technical trends:
Trend Line: The company's revenue trend line has been consistently increasing, with a CAGR of 166.3% over the period of FY2021-FY2024.
Moving Averages: The 50-day moving average has been consistently above the 200-day moving average, indicating a strong uptrend.
Conclusion
Based on the company's financial performance, growth drivers, and technical analysis, we can conclude that Netweb Technologies India Limited is a strong trend trading opportunity. The company's revenue trend line has been consistently increasing, with a CAGR of 166.3% over the period of FY2021-FY2024.
Disclaimer
This report is for informational purposes only and should not be considered as investment advice. The reader should do their own research and consult with a financial advisor before making any investment decisions.

Symmetrical Triangle Breakout - NETWEB📊 Script: NETWEB
📊 Sector: IT - Software
📊 Industry: Computers - Software - Medium / Small
Key highlights: 💡⚡
📈 Script is giving Symmetrical Triangle Breakout on 18th April but there was no rally todays candle is giving breakout of that little consolidation so we may see some good rally.
📈 Script is trading at upper band of BB.
📈 MACD & Double Moving Averages are giving crossover .
📈 Right now RSI is around 61.
📈 One can go for Swing Trade.
⏱️ C.M.P 📑💰- 1730
🟢 Target 🎯🏆 - 1890
⚠️ Stoploss ☠️🚫 - 1664
⚠️ Important: Always maintain your Risk & Reward Ratio.
✅Like and follow to never miss a new idea!✅
Disclaimer: I am not SEBI Registered Advisor. My posts are purely for training and educational purposes.
Eat🍜 Sleep😴 TradingView📈 Repeat 🔁
Happy learning with trading. Cheers!🥂

golden crossstock tarding at golden cross over
run-away gap in chart
last time run awy gap give big move
so same can be accepted.

