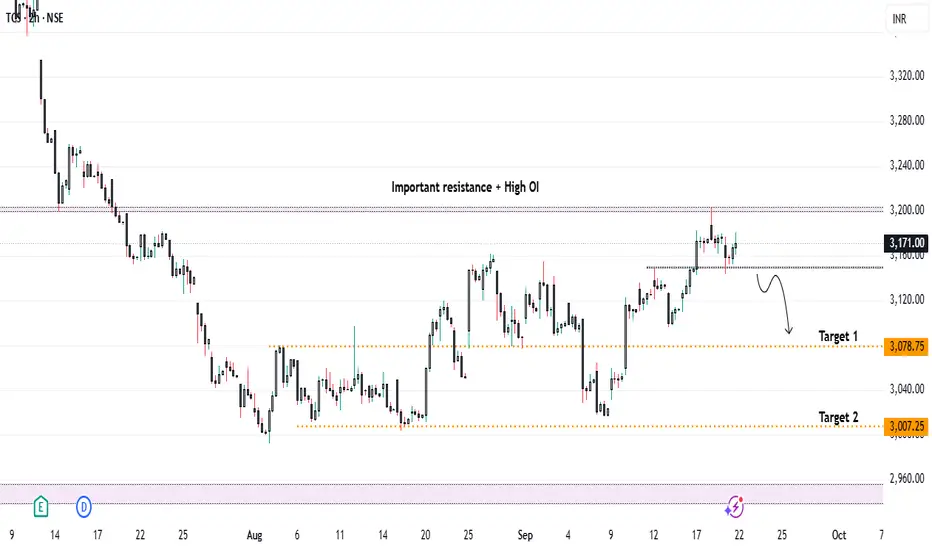
TCS Under Pressure – Will Visa Heat Trigger ₹3000 Levels..?Currently, TCS is trading near the crucial resistance zone of ₹3200, which also carries high open interest. From a technical perspective, if the stock breaks and closes below the short-term support of ₹3150, we can look for a short entry on retest, with targets:
* 🎯 Target 1: ₹3080
* 🎯 Target 2: ₹3000
📰 Fundamental / News Catalyst
The recent US H-1B visa policy update imposing a $100,000 fee on new petitions triggered a knee-jerk reaction in IT stocks:
* U.S.-listed Indian IT firms saw an immediate 2-5% decline.
* Analysts expect the impact on TCS to be limited, since a large part of its U.S. workforce is locally hired and renewals/existing visas are exempt.
* Worst-case estimates suggest a 3-5% downside in the short term, but not a structural collapse for large, diversified players like TCS.
📊 Impact Outlook on TCS
Short Term (days–weeks):
* Investor sentiment may turn negative, causing selling pressure.
* Margin compression possible due to new visa costs.
* Analysts could revise earnings growth expectations lower.
* Offsetting factors: Renewals exempt, TCS has a solid U.S. local workforce, and offshore flexibility.
Medium Term (months):
* New contracts may factor in higher costs.
* Shift to offshore delivery could reduce higher-margin onsite revenues.
* More local U.S. hiring may raise costs.
* Offsetting factors: TCS’s scale allows cost absorption; some costs may be passed to clients.
Long Term (year+):
* Delivery model may shift further to offshore/local U.S. hiring.
* Competitive pressure if peers adapt faster in the U.S. market.
* Margins could be under pressure.
*Offsetting factors: Strong global brand, diversified business, investments in AI & automation can offset long-term risks.
🔎 Scenarios for Share Price
* Mild Reaction: 3-5% decline → cautious investors, limited disruption.
* Moderate Reaction: 8-12% decline → project delays, client pushback, stricter visa rules.
* Severe Reaction: 15-20%+ decline → contract losses, earnings downgrades, tighter U.S. policy.
✅ Conclusion
* 📌 Technicals: Watch ₹3150 for breakdown confirmation; short entries possible below this with ₹3080 / ₹3000 as downside targets.
* 📌 Fundamentals: News-driven weakness is likely, but structural risk to TCS remains limited vs smaller IT peers.
* 📌 Strategy: Short-term bearish setup aligns with both technical chart structure and negative sentiment from visa policy changes.
📌 Sentiment: Bearish (Short Term)
TCS trade ideas
#TCS Looks one more push lower is possibleNSE:TCS Looks intresting sugessting one more push lower to complete wave 5 in red of wave (4) in blue, we dont recommend buying this stock now. Any rally can be sold only.

BULLISH SIGNAL ON TCSPrices comes at near Previous level of support.It indicates started rising upwards for the long term holding.
Let's wait periods....
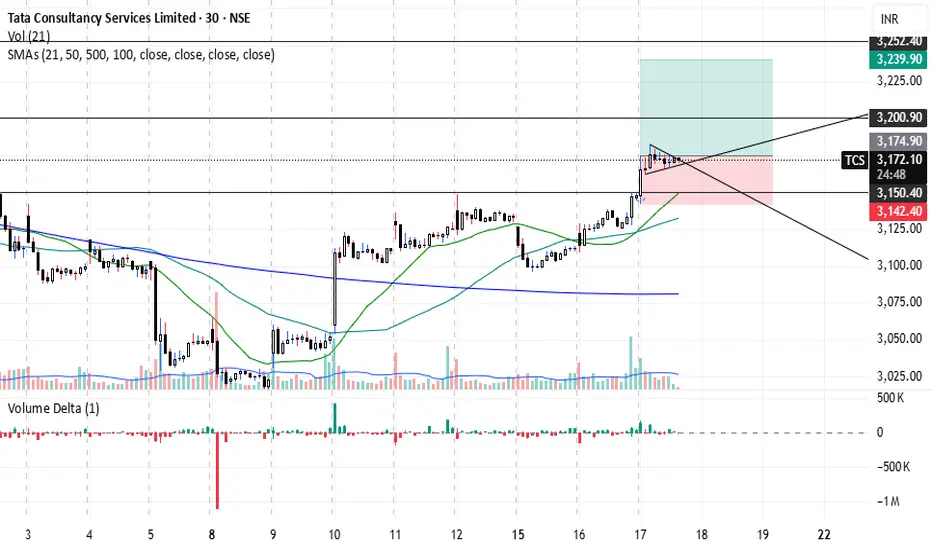
Bullish 21,50 corss over in tcs Bullish 21,50 corss over in tcs 30 min time frame. May go upside up to 3240-3300 in coming sessions
10% and more in TCS in upcoming days ?Tcs sitting around it's monthly support. It might give us 10% and more in a few days...

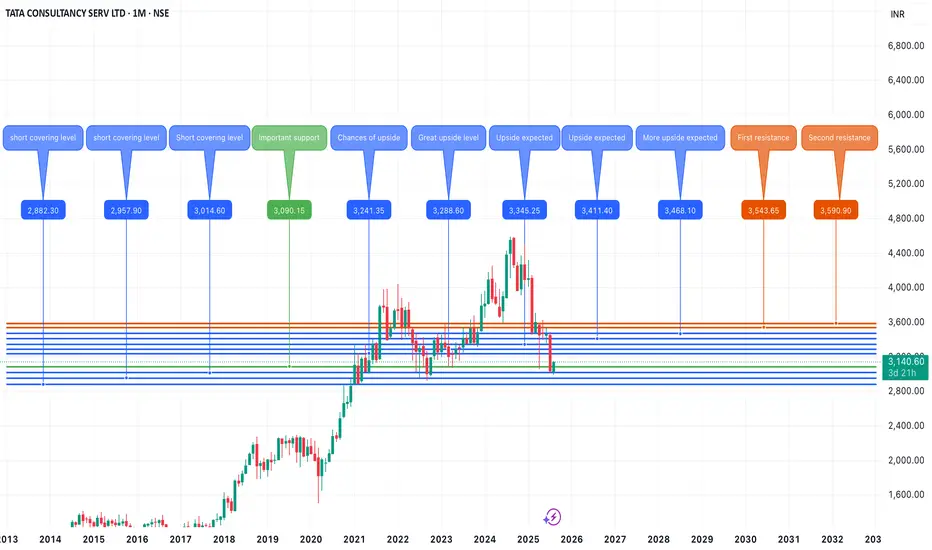
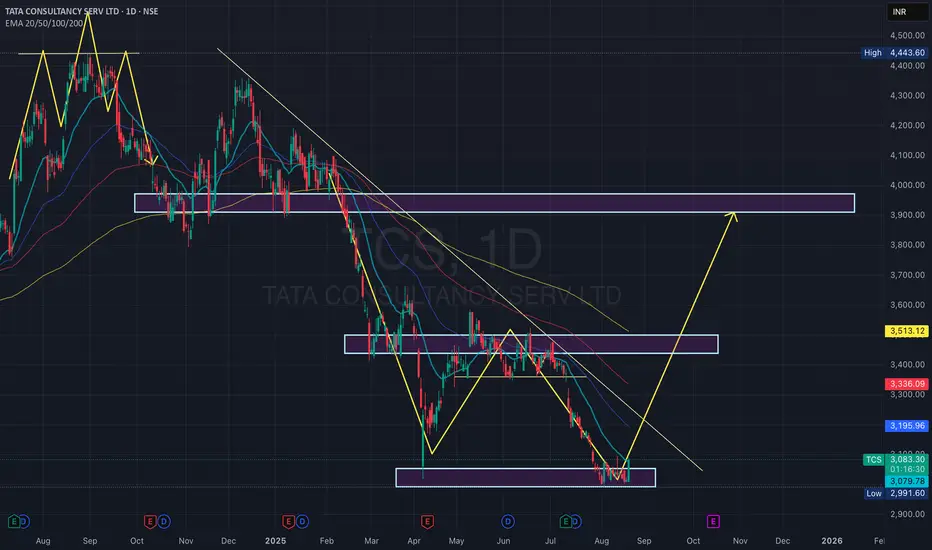
TATA CONSULTANCY SERVICES LTD S/RSupport and Resistance Levels:
Support Levels: These are price points (green line/shade) where a downward trend may be halted due to a concentration of buying interest. Imagine them as a safety net where buyers step in, preventing further decline.
Resistance Levels: Conversely, resistance levels (red line/shade) are where upward trends might stall due to increased selling interest. They act like a ceiling where sellers come in to push prices down.
Breakouts:
Bullish Breakout: When the price moves above resistance, it often indicates strong buying interest and the potential for a continued uptrend. Traders may view this as a signal to buy or hold.
Bearish Breakout: When the price falls below support, it can signal strong selling interest and the potential for a continued downtrend. Traders might see this as a cue to sell or avoid buying.
MA Ribbon (EMA 20, EMA 50, EMA 100, EMA 200) :
Above EMA: If the stock price is above the EMA, it suggests a potential uptrend or bullish momentum.
Below EMA: If the stock price is below the EMA, it indicates a potential downtrend or bearish momentum.
Trendline: A trendline is a straight line drawn on a chart to represent the general direction of a data point set.
Uptrend Line: Drawn by connecting the lows in an upward trend. Indicates that the price is moving higher over time. Acts as a support level, where prices tend to bounce upward.
Downtrend Line: Drawn by connecting the highs in a downward trend. Indicates that the price is moving lower over time. It acts as a resistance level, where prices tend to drop.
Disclaimer:
I am not SEBI registered. The information provided here is for learning purposes only and should not be interpreted as financial advice. Consider the broader market context and consult with a qualified financial advisor before making investment decisions.

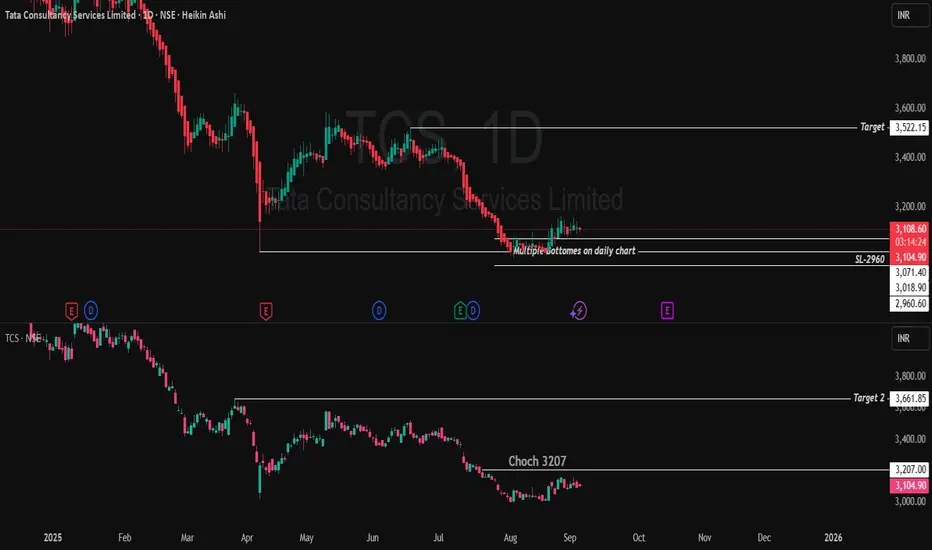
Buy Projection: TCS Daily (Heikin Ashi, Doji Signal)Trading Idea
Entry: On retracement or sustain above 3114, ideally scale in near 3070–3114 if retest occurs.
Trigger Level: Add or pyramid position above 3207 for further momentum.
Target Zones: 3295 (initial), 3661 (extended)
Key Point to be keep in mind before trade:
Doji candle after long bearish trend signals potential reversal
18-day consolidation between 3070–3015 formed a strong base
Breakout occurred above 3072 in last 6 days, confirming momentum shift
Current price around 3114 supports bullish trend continuation
Near-term change of character (CHoCH) expected at 3207; clears key resistance
Targets after CHoCH: 3295 (first), then 3661 (extended)
Suggested entry: buy on dips near 3070–3114 or on breakout above 3207
Stop loss: below 3070 to manage risk
Heikin Ashi Doji after bearish trend and consolidation, followed by breakout at 3072 and price holding above 3114, validates bullish momentum for targets at 3295 and 3661 if 3207 is cleared with volume.Based on the Heikin Ashi daily chart for TCS, with a doji after a long bearish trend and consolidation between 3070–3015 for the last 18 days, a breakout above 3072 seen in the previous six days, and current price at 3114:
Entry: Consider buying on dips above the 3072 breakout or if price sustains above 3114, confirming momentum after the doji and consolidation.
First Trigger: Watch for price action near 3207 (marked CHoCH); clearing this adds conviction to the uptrend.
Targets: Initial target at 3295, with a higher target at 3661 as shown for extended bullish move.
Stop-loss: Below the consolidation low at 3015, or more tightly just under 3070 depending on risk appetite.
This projection aligns with typical Heikin Ashi reversal logic, highlighting developing bullish strength if key resistance levels are cleared and maintained.
Disclaimer: lnkd.in
TCS SHORT-TERM ANALYSISTCS seems to have made a low for short term. The max downside risk is limited upto 8%, which would be 2882 from the current market price of 3140. But the recent bounce from 3000 levels is giving hope for further upside momentum, and this momentum will get stronger once TCS crosses and sustains above 3288. Upon that, we can expect highs upto 3540-3590. And if it breaches the recent support of 3000, then the downside risk upto 2882 will open .
THIS IS MY PERSONAL VIEW AND NOT A BUY/SELL RECOMMENDATION.
TCS Swing Trade Setup📊 Price Action & Trend Analysis
Analyzing market trends using price action, key support/resistance levels, and candlestick patterns to identify high-probability trade setups.
Always follow the trend and manage risk wisely!
Price Action Analysis Interprets Market Movements Using Patterns And Trends On Price Charts.
👉👉👉Follow us for Live Market Views/Trades/Analysis/News Updates.
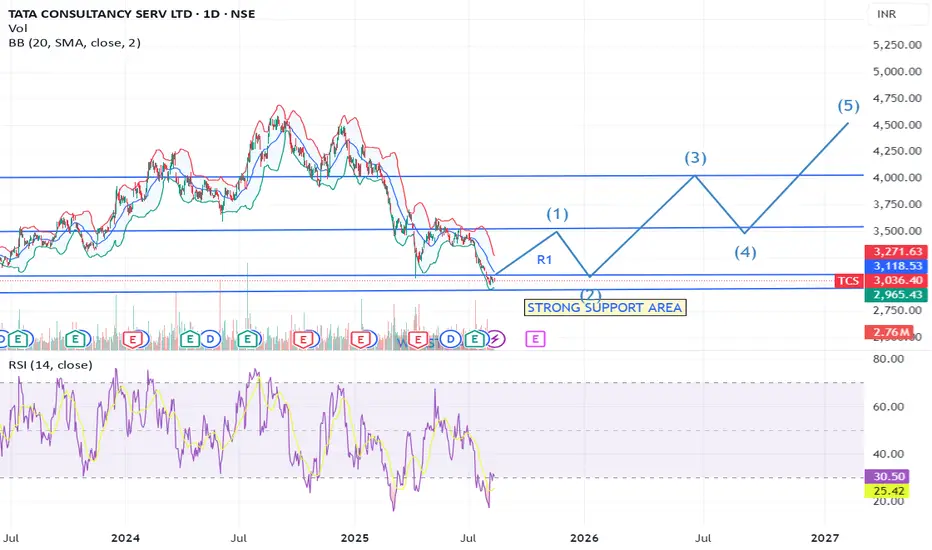
TCS - Positional - LongTCS in heavy oversold zone. Double bottom and support at level of 3000. Far away from 200 EMA on D timeframe. Bounce back will push its price till 3500 as first level where it will face resistance again. Consolidation around 3500 will push again till 4300+. Buy entry for positional long.
TCS looks at attractive priceTCS looks at attractive price, maximum downside looks like 2900. One can start buying in tranche. Also Nifty IT looks to be at reversal.

Large Cap IT Stock - Will it take support?In last few weeks, TCS has corrected significantly. Presently around support zone. Still the overall sentiments around IT sector is not very positive given the results, the associated commentary from different companies. Will TCS buck the trend or see some more correction. Below the current support zone (2900-3000), down move can take it towards 2600.
Disclaimer - View shared for study and learning. Kindly consult your advisor before taking any positions.

TCS to 5000 if it clears 3400-3500TCS future price outlook (as per recent market chatter & analyst commentary):
Short term (3–6 months): ₹3,400–₹3,600 possible if sentiment improves post the U.S. tariff uncertainty, Q2/Q3 results show steady deal wins, and IT sector demand stabilizes.
Medium term (12–18 months): ₹4,000–₹4,500 possible if U.S. recession fears fade, large digital transformation deals continue, and margins expand due to cost optimization.
Why TCS could go up after the tariff dust settles:
Strong order book – TCS still has multi-year contracts from BFSI, retail, and manufacturing clients that aren’t directly tariff-sensitive.
Weak rupee benefit – A depreciating INR boosts export earnings for IT companies like TCS.
Digital demand – Enterprises continue investing in AI, cloud, and automation projects where TCS has leadership.
Share buybacks & dividends – TCS often announces buybacks, which support the stock price.
IT sector rebound – Historically, Indian IT stocks recover strongly once macro headwinds are priced in.
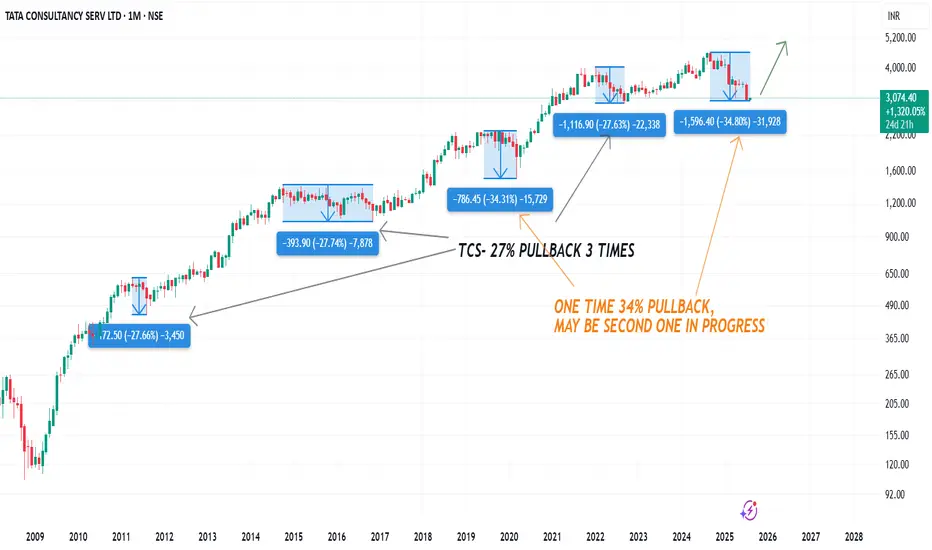
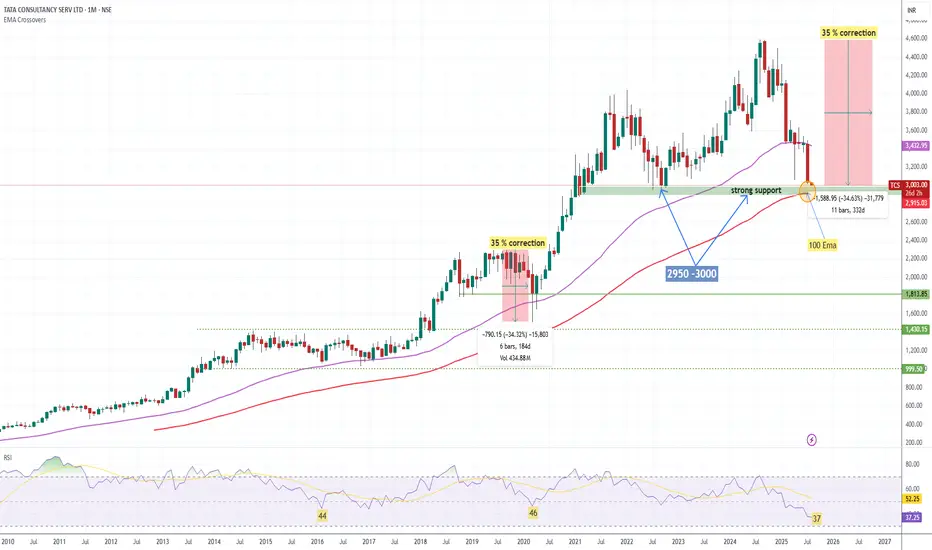
TCS Chart Analysis: Key Trends and Predictions for August 2025**TCS Historical Pullbacks Analysis and Outlook**
Tata Consultancy Services (TCS) has exhibited a remarkable long-term uptrend, punctuated by a series of significant corrections. Your chart annotation highlights a compelling technical pattern: TCS has experienced three major pullbacks of approximately **27%** each over the past decade. These deep corrections have historically been followed by periods of robust recovery and new highs.
Interestingly, your chart also marks two exceptional occasions where the stock witnessed even deeper corrections, around **34%**, the most recent of which may still be in progress. The ability of TCS to consistently bounce back after such steep declines testifies to its underlying strength, market leadership, and the confidence of long-term investors.
**Key Insights From the Chart:**
- **Three 27% Pullbacks:** Marked by distinct blue boxes, each of these corrections provided attractive accumulation opportunities, and each was followed by renewed bullish momentum.
- **Rare 34% Corrections:** These are far less frequent, indicating abnormal market stress or broader corrections, but also highlight zones of potential capitulation and renewed accumulation.
- **Current Status:** The latest price action suggests another 34% pullback may be underway or nearing completion, as marked in orange annotation.
**Strategic Takeaway:**
Given TCS’s proven track record of recovery after such corrections, investors may view these deep pullbacks as strategic buying opportunities for the long term. Patience and discipline are critical, as the stock often rewards those who accumulate during periods of pessimism.
**Conclusion:**
TCS remains a robust large-cap IT pick. Historical patterns suggest that major corrections—while unnerving—tend to precede strong rallies. Investors should watch for signs of stabilization and reversal to position themselves for the next phase of growth, always aligning choices with personal risk tolerance.
TCS near bounceTCS is near bound.. at long term support level, will bound probably to 3400 level in next 1-3 months

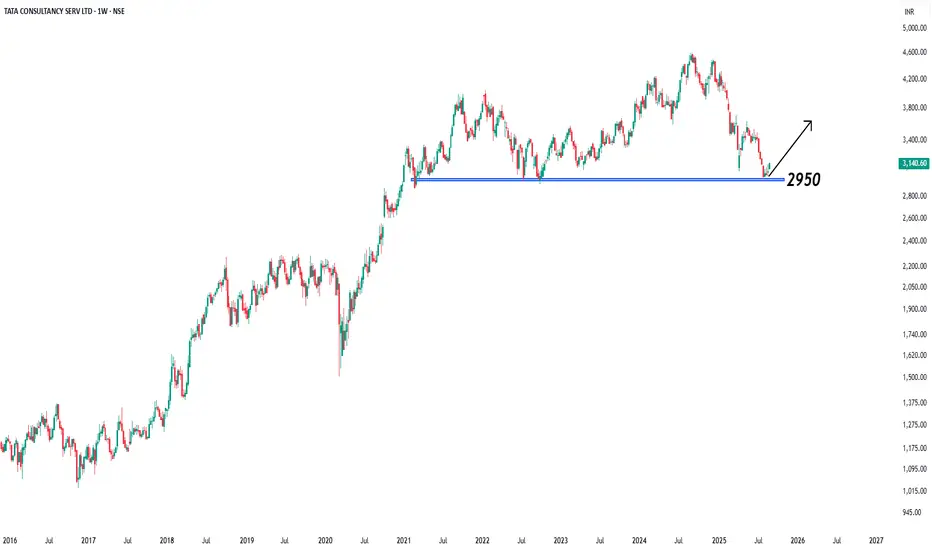
"TCS Takes a COVID-Style Dive Again – Is It Time to Buy?"Price Action History:
During the COVID crash, TCS fell nearly 35% from its top, eventually taking support at the 100 EMA on the monthly chart and staging a strong bounce.
In 2022 (June,july,Sep,Oct), around 3000 zone was tested multiple times, followed by a significant rally.
📊 Current Scenario:
Once again, TCS is trading near the ₹2950–₹3000 zone, which coincides with the 100-month EMA – a historically proven support level.
Price action suggests we are at a critical inflection point similar to past major bottoms.
✅ Key Technical Levels:
Support Zone: ₹2950–₹3000 (100 EMA Monthly+ 2022 support level)
Immediate Resistance: ₹3300–₹3400
Upside Potential: A bounce similar to COVID & 2022 patterns could trigger a strong upside move.
Trading Strategy:
if you are short term trader Keep a strict stop-loss below ₹2900 (monthly close basis) or 100 monthly EMA
Position sizing is key – don’t over-leverage.
🔎 Conclusion:
For long term trader This zone has historically acted as a strong accumulation area for long-term investors. If history repeats, this could be a high probability buying opportunity for swing and positional traders.
Fundamental Factor
Net Profit (Q1 FY26) ₹12,760 cr (+6% YoY)
Revenue Growth +1.3% YoY (−3.1% in CC)
Operating Margin 24.5% (↑30 bps QoQ)
Trailing P/E 22× (vs 5‑yr average ~24‑26×)
Dividend Yield 2.0%
ROE /ROCE 52%/64%
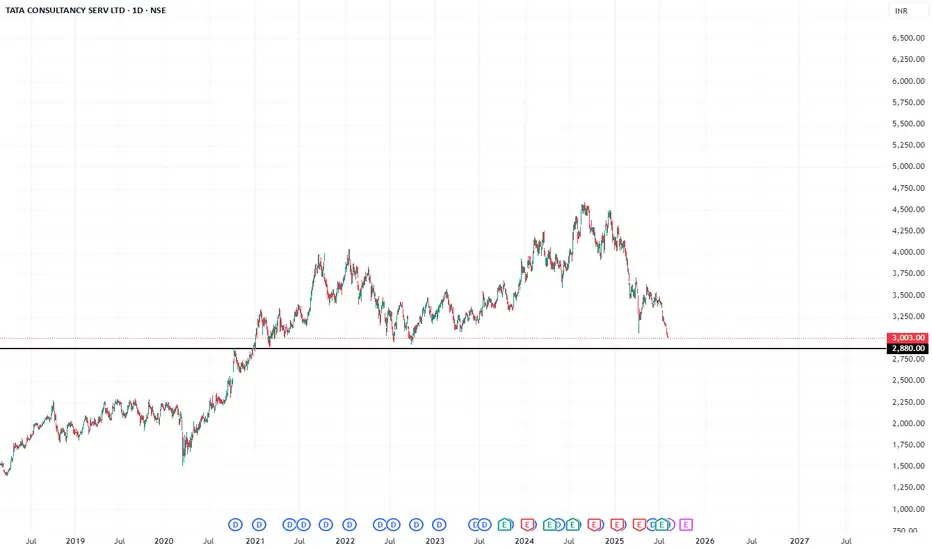
TCS Near Major Support !
TCS is approaching a critical multi-month support zone between ₹2,880–₹2,860. This level has previously acted as a reliable demand zone in June and July. A retest and breakdown below ₹2,875 may open the gates for further downside toward ₹2,810.
However, a bounce from this support — backed by volume and a strong daily close — could push the stock back to the ₹3,040–₹3,080 resistance range.
🔻 TCS – Approaching Major Support (Daily)
CMP: ₹2,890 (as of Aug 2, 2025)
Support Zone: ₹2,880 – ₹2,860
📌 Key Price Levels:
Major Support: ₹2,880 – ₹2,860
Resistance (Bounce Zone): ₹2,920
Breakdown Trigger: Below ₹2,860
Target (if breakdown): ₹2,810
Target (if bounce): ₹2,940 → ₹2,975
Stop Loss (Bounce Trade): ₹2,855
🧠 Setup Explanation:
TCS is nearing a multi-week demand zone around ₹2,880, previously tested in June and early July. Watch for price action confirmation — either a bounce with volume or a clean break below ₹2,860, which may invite further downside.
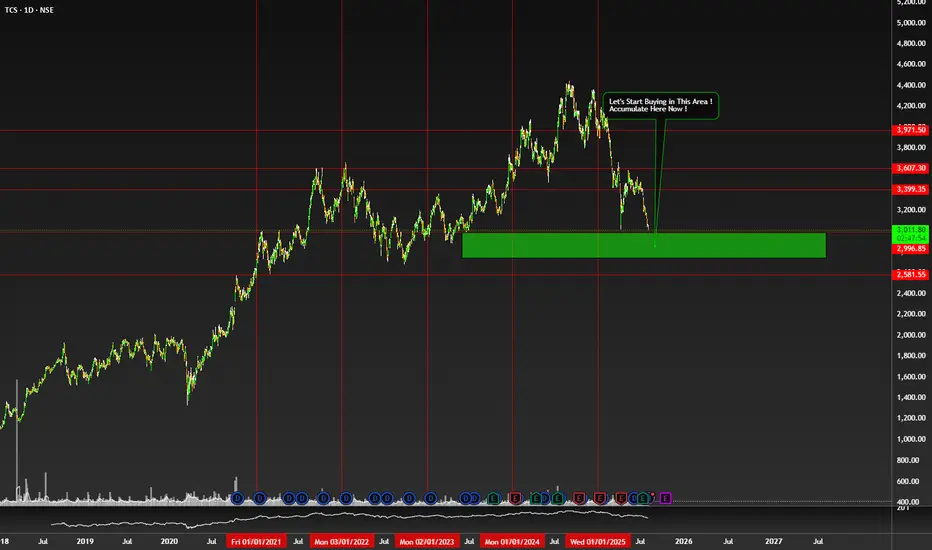
Time To Accumulate $NSE:TCS NSE:TCS
My Trade Opinion
Let's Accumulate here in Green area.
Best time to Buy here.
Don't Buy if Some One Think IT will Dead in india. :D
Future is at Some Time Ahead.
Don't Listen Just Observe it.
Company is Going to Aggressively Progress in Future.
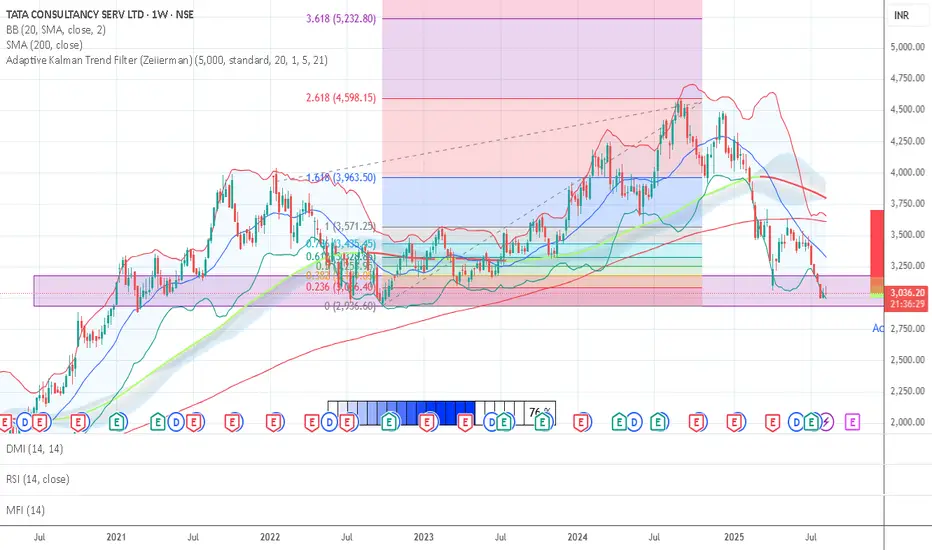
TCS nearing fibonachi support of 2700Historical Analysis of TCS for those who belive in fibonachi levels
Precious retracement of TCS happened exactly till golden ratio 61.8
This time it had already retraced till 50% level.
So buy now or wait till 61.8 levels।

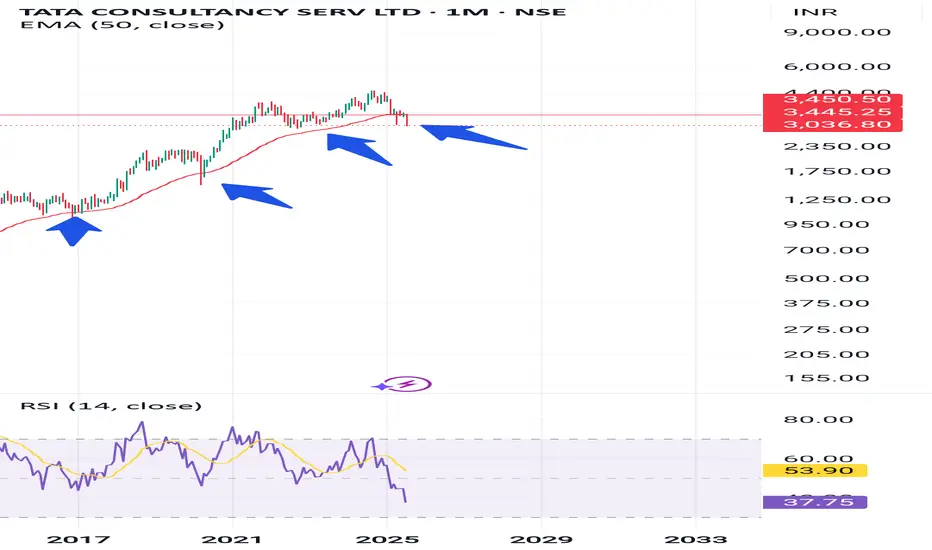
Hunting Stop loss , near moving avg historical Support Tcs is falling due to bad quarterly results now at historical support of 50 ema , each candle is monthly candle
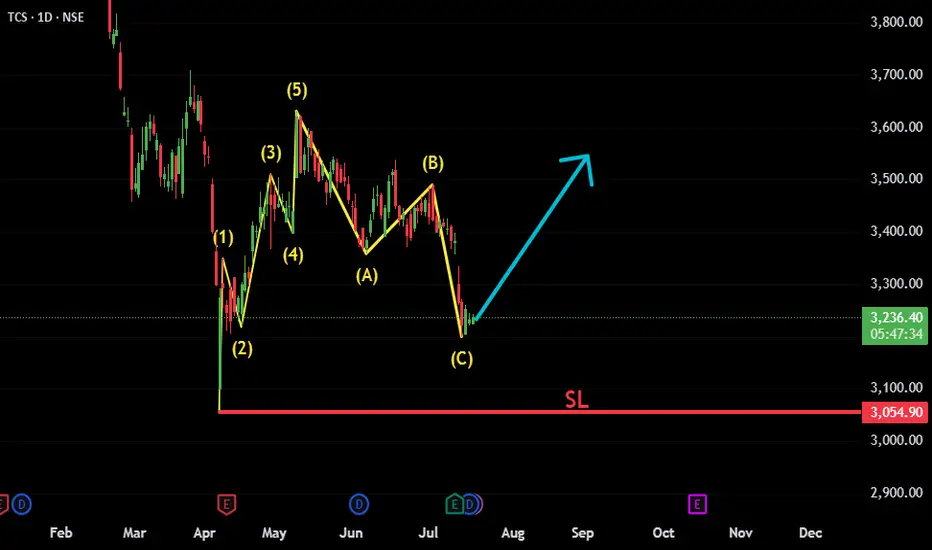
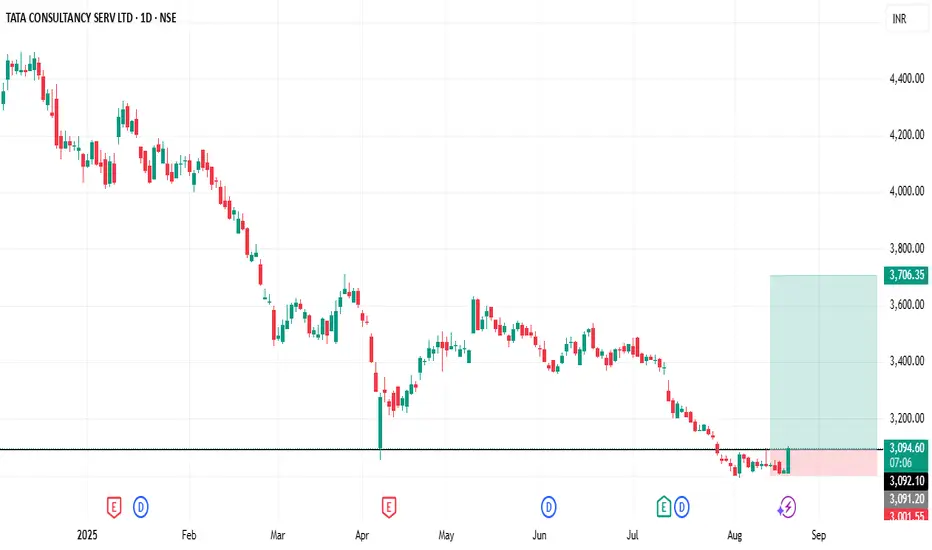
TCS: ABC Correction Complete – New Impulse Wave in FocusTCS appears to have completed a classic Elliott Wave structure, consisting of an initial 5-wave impulsive move followed by an A-B-C corrective phase. The recent price action suggests the correction has likely ended, and a new bullish impulsive move is beginning.
Fundamental trigger:
Interestingly, just a few days ago, TCS announced strong quarterly results — reporting solid profits and declaring a dividend. Despite the positive news, the stock reacted negatively and moved lower. This could have been a classic case of "good news, bad reaction" — possibly a stop-loss hunt or smart money absorbing liquidity before the next leg up.
Key technical points:
✅ Wave 1-2-3-4-5 clearly visible, forming the initial impulse.
✅ A-B-C correction appears complete with price reversing from a key support zone.
📈 Bullish structure forming; watching for confirmation with a break above recent highs.
🔍 Technicals and sentiment suggest renewed upside potential, despite short-term shakeouts.
Invalidation below recent swing low (Beginning of 1st Impulsive).
This setup offers a potential long opportunity with a favorable risk-reward
#TCS #NSE:TCS #ElliottWave #WaveAnalysis #TechnicalAnalysis #ABCCorrection #ImpulsiveWave #LongSetup #ChartAnalysis #NSEStocks #IndianStocks #Dividend #Earnings #PostEarningsMove #TrendReversal #SwingTrading #PriceAction #SmartMoney