TECH MAHINDRA S/R for 29/1/24Support and Resistance Levels:
Based on the price action, you have to identify two significant levels: the red line acting as resistance and the green line acting as support. Additionally, there have marked red and green shades to represent resistance and support zones, respectively.
Support: The green line and green shade represent support levels. These levels are where the price tends to find buying interest, preventing it from falling further. Traders can consider these levels as potential buying opportunities.
Resistance: The red line and red shade represent resistance levels. These levels are where the price tends to encounter selling pressure, preventing it from rising further. Traders can consider these levels as potential selling opportunities.
Breakouts: If the price breaks above the resistance zone (red shade) convincingly, it may indicate a bullish breakout, and the price could move higher to the next resistance level. On the other hand, if the price breaks below the support zone (green shade) convincingly, it may indicate a bearish breakout, and the price could move lower to the next support level.
Keltner Channel:
The Keltner Channel is a technical indicator that uses an exponential moving average (EMA) to create an upper and lower channel around the price action. Traders can use this channel to identify potential long and short positions.
Long Position: If the price is above the upper line of the Keltner Channel, it may indicate a potential long opportunity, as it suggests the price is trading above the average range and might continue in an upward trend.
Short Position: If the price is below the lower line of the Keltner Channel, it may indicate a potential short opportunity, as it suggests the price is trading below the average range and might continue in a downward trend.
TECHM trade ideas

MirrorThis script is making a mirror pattern showing how history repeats itself.
Currently, it's available at cheap valuations and also, the stock would be benefited from the upcoming season.
The target price is 50% upside as per the charts.
Duration - 6 to 12 months.
Fundamentally good stocks
Tech Mahindra and Nokia Collaborate to Drive Enterprise 5G Private Wireless Adoption Globally
Tech Mahindra is a $5.1 billion organisation focused on leveraging next-generation technologies including 5G, Blockchain, Cybersecurity, Artificial Intelligence, and more, to enable end-to-end digital transformation for global customers
Disclaimer:
- The view expressed here is my personal view
- Past performance is not a guarantee for future predictions
- Use this for educational purpose
- Any decision you take, you need to take responsibility for the same
- It's your hard earned money. Treat it wisely
- Trade / Invest keeping in mind your trading style, goals and objectives, time horizon & risk tolerance
- if trading in F&O, understand that F&O trading involves risk
- Do take proper risk management measures
- Do your own analysis and consult your financial adviser if need be

Tech MahindraTech mahindra may have started iii of 3rd wave.. If this holds right we may see spike till 1600

Tech Mahindra Weekly Chart AnalysisTech Mahindra Chart is looking strong on weekly time frame if stock holds at current level we will see this stock on 1500 level in few weeks

Tech Mahindra Simple Analysis BullishNSE:TECHM This stock has fallen a lot in the past and today broke an Important Resistance of a Consolidation.
Not only that, it also created a Trap Zone on the way. This stock should go up and give us a minimum of 10 to 15% Return on Investment in quick succession.

Stock Update $NSE:TECHMDear Followers,
I hope this message finds you well. I wanted to provide you with a brief update on the stock NSE:TECHM I have been monitoring.
It appears that the stock is approaching a potential resistance level Near 1340 This is an important technical point where the price has historically had difficulty breaking through. It suggests that we may see a temporary halt in the current upward momentum and Possibly it will test 1220 In Downmove.
Resistance Levels to Watch out.
Resistance levels are the opposite, representing prices at which a stock has historically struggled to move above. These levels can signal a selling interest. Understanding resistance points is crucial for anticipating potential obstacles in the upward movement of a stock.
R1= 1340
R2= 1420
R3= 1480
Support Levels To Watchout.
Support levels represent prices at which a stock has historically had difficulty falling below. These levels often indicate a strong buying interest. It's important to monitor these levels, as a breach might suggest a potential downward trend.
S1= 1280
S2= 1220
S3= 1160
As always, please remember that investing involves risks, and it's important to carefully consider your options. If you have any questions or would like to discuss this further, please don't hesitate to reach out.
Best regards,

Am i right? Is techm ready for breakoutHi guys. Please correct me if I'm wrong. Is techm ready for a breakout? There is an important support here that's showing. Par correct me if I'm wrong.
Please note I'm learning and this is not a recommendation as you can see I'll the winner who is asking whether it is correct or not 😬😎😄


TECH Mahindra Daily timeframe analysis for long term
NSE:TECHM about to breakout golden zone 1320 in monthly timeframe.
It has created strong bullish trend over year with LL LH HL structures, recent breakout from 1235 level and given strong bounce with pullback near entry level 1235 .
Buy range 1221 to 1320, SL 1182.
Major targets levels are highlighted in blue lines.

upcoming boom in IT sector will lead much more to this stockIT sector started its journey and the stock which will give highest return with the rally is here.

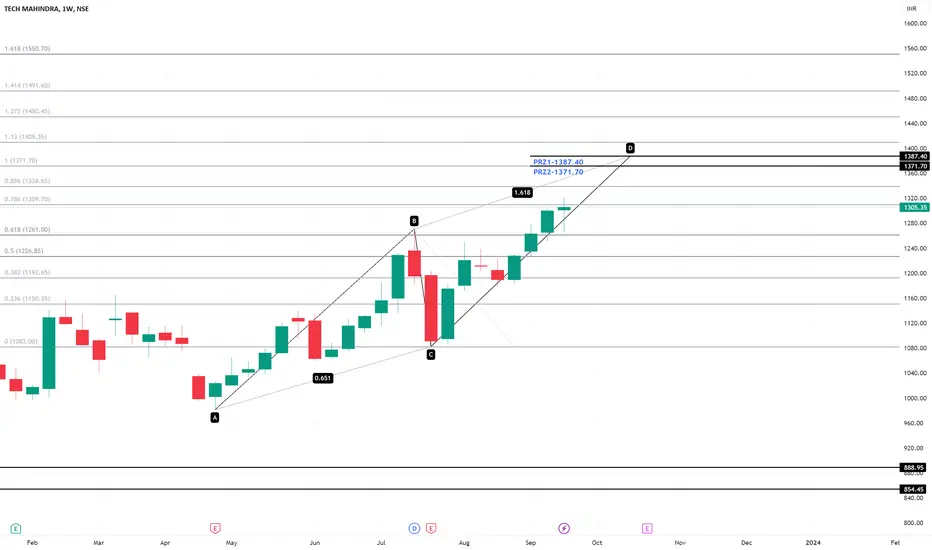
TECHM TREND BASED FIBO PROJECTIONSThe chart show support at 1098 with targets projected by the Trend based Fibo Extensions.
We have 2 Fibo extensions here.
1. Starts from 471.40 to 1838 and than placed at 943.70 for projections.
2. Starts from 943.70 to 1320 and than placed at 1098 for projections.
The Fibo projections are clearly visible on the charts.
With support at 1098 the Fibo projections help us to estimate the probable important target levels that can be traded in coming year.

Very good leval stock at support 200 ema and also support on weekly time frame and closing green of weekly candle if continue ride then very good leval for risk reward ratio

TECHM - **Navigating Opportunities: A Technical Outlook📊 **Analyzing Candlestick and Heikin Ashi Patterns**
Tech Mahindra Ltd is currently under the spotlight for its promising candlestick and Heikin Ashi patterns, showcasing a compelling narrative for traders seeking strategic entry points.
📉📈 **Decoding Tick Strength: Daily and Monthly Insights**
- **Daily Momentum:** The daily chart unravels a Bullish trend, accentuated by a Bullish Continuation Heikin Ashi Pattern. This signals a positive short-term outlook, hinting at potential opportunities for nimble traders.
- **Monthly Fortitude:** The monthly landscape paints an even more robust picture, featuring a Strong Bullish sentiment. A Bullish Heikin Ashi Pattern, coupled with noteworthy trading volume, underlines a sustained and formidable long-term uptrend.
🎯 **Pinpointing the Sweet Spot: Demand Zone 1172.05 - 1177.70**
Within the intricacies of the charts, a strategic buying opportunity emerges within the demand zone, ranging from 1172.05 to 1177.70. This zone acts as a magnet for potential buyers, creating a favorable entry window for astute traders.
📈 **Strategic Move: Buy Within the Range with Stop Below 1171**
To capitalize on the potential ascent, traders are urged to consider entering the market within the specified range of 1172.05 to 1177.70. Risk management is key, and setting a stop-loss just below 1171 serves as a protective measure against unforeseen market shifts.
🚀 **Seizing Opportunities with Tech Mahindra Ltd**
Tech Mahindra Ltd not only showcases favorable technical indicators but also offers a strategic entry point within a defined demand zone. Traders navigating this landscape should remain vigilant, stay abreast of market dynamics, and be ready to adapt their strategies as needed.
📈🚀 Happy Trading! 🚀📈

TECH MAHINDRA -1DTech Mahindra looks good for buy now as it has broken the recent resistance of 1180 and now moving towards next zone of 1311 in a bullish manner, the long term goal can be to hold it till the 1560 levels, as there is a gap near the zone which the price will try to fill out.

TECHM ( SHORT SELLING SETUP)In TECHM stock we can see trendline in Daily Timeframe (1D).
Right now stock is trading at price of 1175 Rs and the support of trendline lies on 1170 Rs.
Also according to the Fibonacci Retracement drawed from bottom to top the stock has broke the support of 0.382 which is at price 1240 Rs and now at trendline support.
One can plan short selling from here at price of 1170 Rs with small STOPLOSS at 1240 Rs(which is zone of 0.382 from Fib Retracemnet) and the 1st TARGET for short selling is 1080-1170 and 2nd TARGET is 990-980 Rs as there is major SUPPORT at 980 level.
There are Q3 rersults are coming of TECHM in upcoming days therefore the STOPLOSS should be little big which can provide space for volatility and SL will be safe thats why we put SL of 70 rs and the TAEGET of 200 Rs againts it. Which gives the RISK REWARD RATIO of 1:3.

TECHMStock Clearly downtrend
Make spinning top candle on chart bottom it means indicision.
Wait for confirmation downside or upside
Mostly probably downmove coming
Wait n watch ⌚
Macd Bearish
100 DEMA support.
Disclaimer This is my personal view for education purpose only
No Buy sell recommendations.

Buying time for TechM?
Looks like buying time for Tech Mahindra . Current downward swing may be over by tomorrow if not already is.

Tech Mahindra makes Bullish M pattern ready for big upside moveOn Our Harmonic pattern indicator based trade setup take trade as explained below :-
Early trades Buy or sell below/ above 23.6 %, safe trades buy or sell above / below 41% , after taking trade next upside or downside levels will be target ,
When reverse buy or sell signal appear then book profit on Target or trail SL to 23.6 % If trailing SL hit then early trade can be taken above or below 23.6 and safe trade can b taken above/ below 41% ..
Please note:-
It's working on news based and volitile market very well so exit if SL hit

TECHMNSE:TECHM
One Can Enter Now !
Or Wait for Retest of the Trendline (BO) !
Or wait For better R:R ratio !
Note :
1.One Can Go long with a Strict SL below the Trendline or Swing Low.
2. R:R ratio should be 1 :2 minimum
3. Plan as per your RISK appetite and Money Management.
Disclaimer : You are responsible for your Profits and loss, Shared for Educational purpose

Watch Out For BreakOut. 2000 in 10 to 15 months time. Stock Is trading near Resistance Range.
After the morgan stanly down grade of ratings , hoping it to come down to the range 1125 to 1010.
if it comes to those levels, Can be good entry point.
Then wait for breakout. Once breakout 2000 will come for sure.
Downside levels are marked by green support ranges.
Long Term 10 to 15 months.

tech mahindra buy @ 1167 target @1245, 1259, 1284 tech mahindra buy @ 1167 target @1245, 1259, 1284
channel pattern breakout
risk reward 1.5
sl@1092

TechmStrong breakout of resistance area
Now price resting on resistance level
Other stocks in this sector are also performing well
Took 40% position
Will add more as it unfolds
This is a short term - Medium term bet
