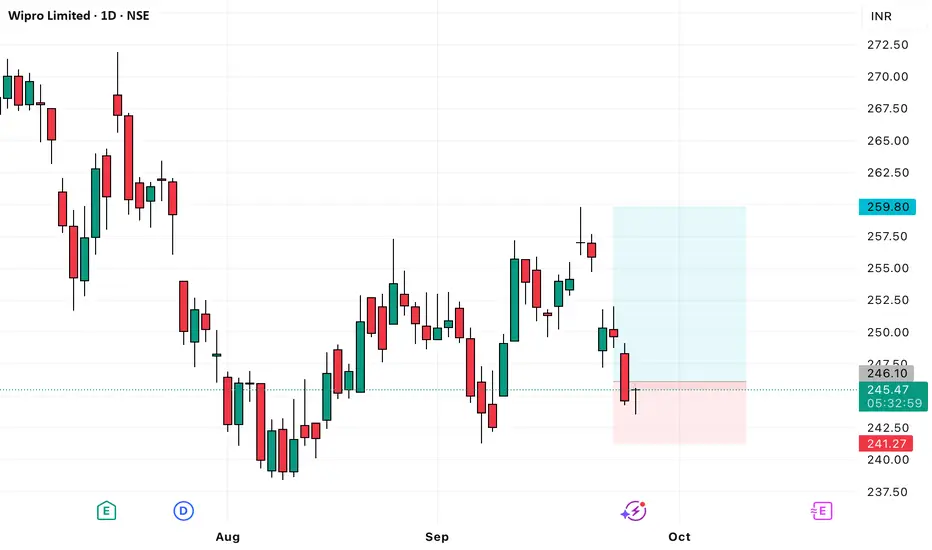
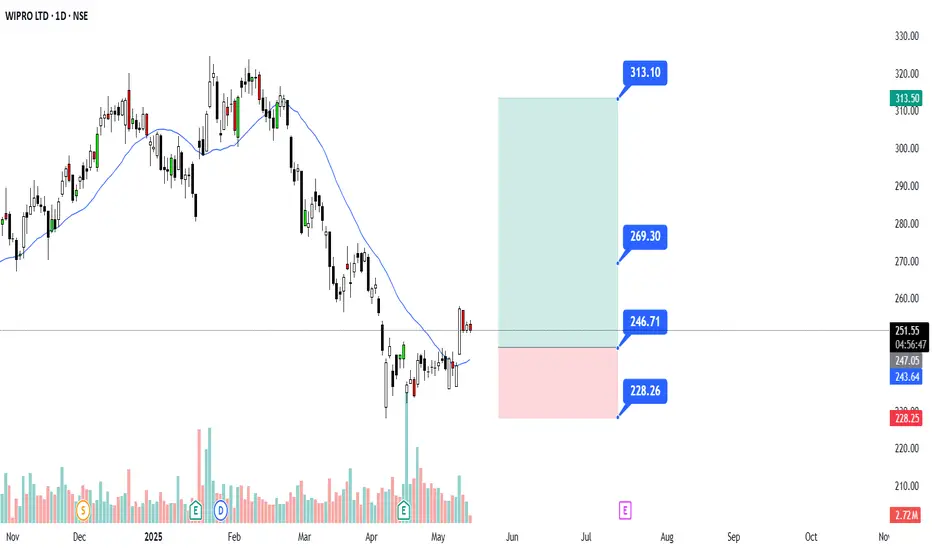
Wipro long setup looks good for 259Wipro looks good for 259
ENTRY - 244.36 to 246.1
Stop loss - 241.27
Target - 259.8
Risk Reward - 1:2.84
WIPRO trade ideas
WIPRO @ 255: BIGGER PICTURE ANALYSIS 19-SEP-2025Supports: 228/177/77/14
Resistances: 328/373
As long as the above supports hold, we can see
Min. target: 327-355-407
461
Normal target: 519-550-634
Ultimate target: 712-746-782-834
Extension: 1125-1195

WIPRO 1D Time frame📊 Wipro Daily Snapshot
Current Price: ₹256.50
Change: Up 2.97% from the previous close
Volume: 804,499 shares traded, significantly higher than the 50-day average of 369,496
MarketWatch
🔎 Key Levels
Resistance: ₹253.70 (short-term)
Support: ₹239.55 (short-term)
52-Week High: ₹324.55 (January 23, 2025)
52-Week Low: ₹239.55 (recent support level)
📈 Technical Indicators
RSI (14): Approximately 75 — indicates overbought conditions
MACD: Positive — suggests upward momentum
Moving Averages: Trading above 5-day (₹255.97), 50-day (₹248.47), and 200-day (₹247.12) SMAs — bullish trend
Stochastic Oscillator: Indicates overbought conditions
ADX: Approximately 17.49 — suggests a weak trend strength
Top Stock Research
📌 Market Sentiment
Catalysts: Positive market sentiment, with Wipro outperforming key competitors like HCL Technologies and Tata Consultancy Services in recent sessions
MarketWatch
Sector Performance: IT sector showing strength, with Wipro leading gains among peers
📅 Outlook
Bullish Scenario: Sustained trading above ₹253.70 could lead to a push toward ₹277.65 (long-term resistance)
Bearish Scenario: A drop below ₹239.55 may test support around ₹234.20 (mid-term support)

wipro with volume profile on volume profile base prise looks like can go another 22%down , there it have much volume support and now its reaching at volume profile resistnce as well
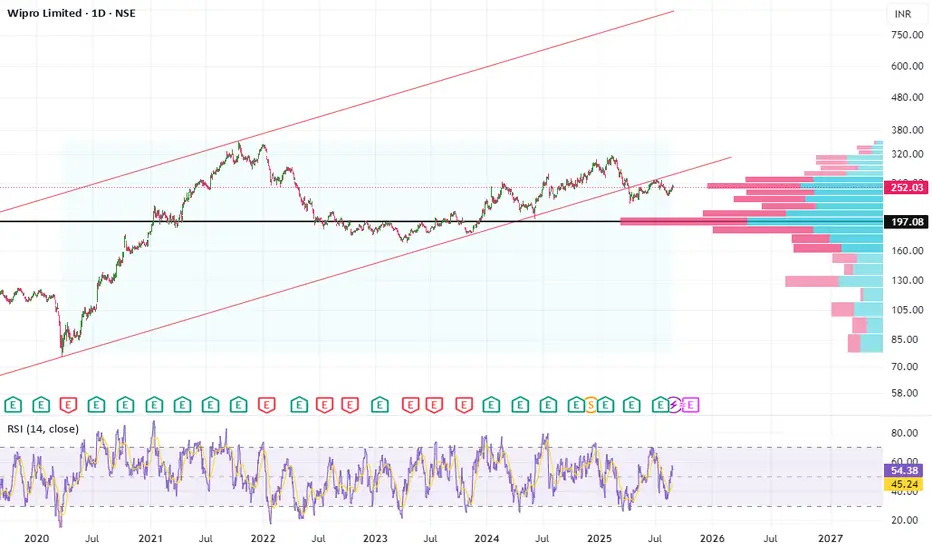
long time trendline retest done on this chart prise have done its retest on weekly frame 1 time , prise can go little more up then revese , but mostly chances are it will reverse now , on weekly frame candle looks like hammer

Wipro weekly analysis Fibonacci level & RSI showing showing strength on 1D & 1M chart.
Target 1: 260
Target 2 : 300

Spotlight on WIPRO: Building Momentum for Potential GainsThis is the daily chart of WIPRO.
WIPRO has a strong support zone in the 230–240 range.
If this level holds, we may see higher prices in WIPRO.
Thank You !!
WIPROWIPRO- Weak structure
Market Cap
₹ 2,50,596 Cr.
Current Price
₹ 239
High / Low
₹ 325 / 225
Stock P/E
18.6
Book Value
₹ 79.1
Dividend Yield
2.51 %
ROCE
19.5 %
ROE
16.6 %
Face Value
₹ 2.00
Price to book value
3.02
Intrinsic Value
₹ 141
PEG Ratio
8.13
Price to Sales
2.81
Debt
₹ 19,204 Cr.
Debt to equity
0.23
Int Coverage
12.8
Reserves
₹ 80,736 Cr.
Promoter holding
72.7 %
Pledged percentage
0.00 %
EPS last year
₹ 12.5
Net CF
₹ 2,502 Cr.
Price to Cash Flow
14.8
Free Cash Flow
₹ 15,651 Cr.
OPM last year
20.2 %
Return on assets
10.8 %
Industry PE
28.0
Sales growth
0.41 %

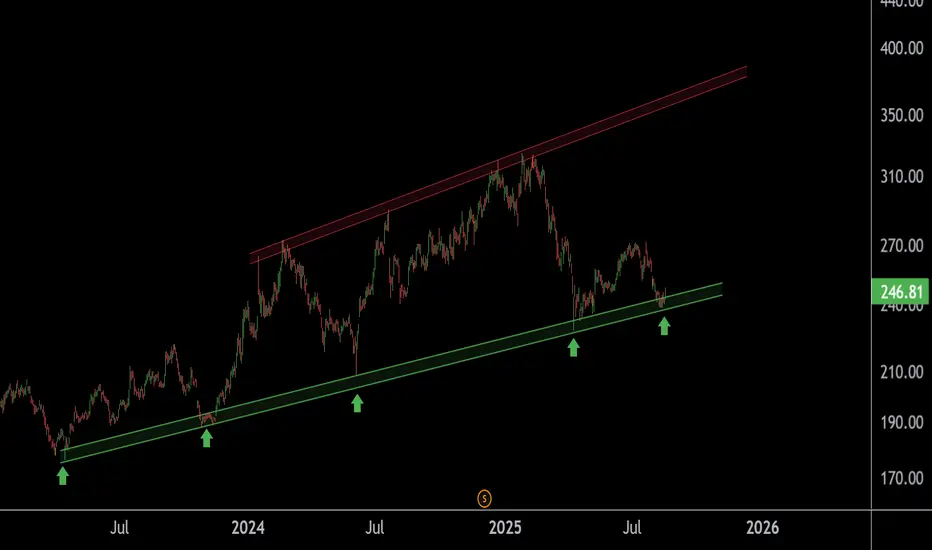
Wipro Near Crucial Support – Smart Money Watching Closely This is daily timeframe chart of Wipro.
Wipro is moving in well defined parallel channel with support zone near at 240 range.
If Wipro is sustain this level , then we may see higher prices in Wipro.
Thank You !!
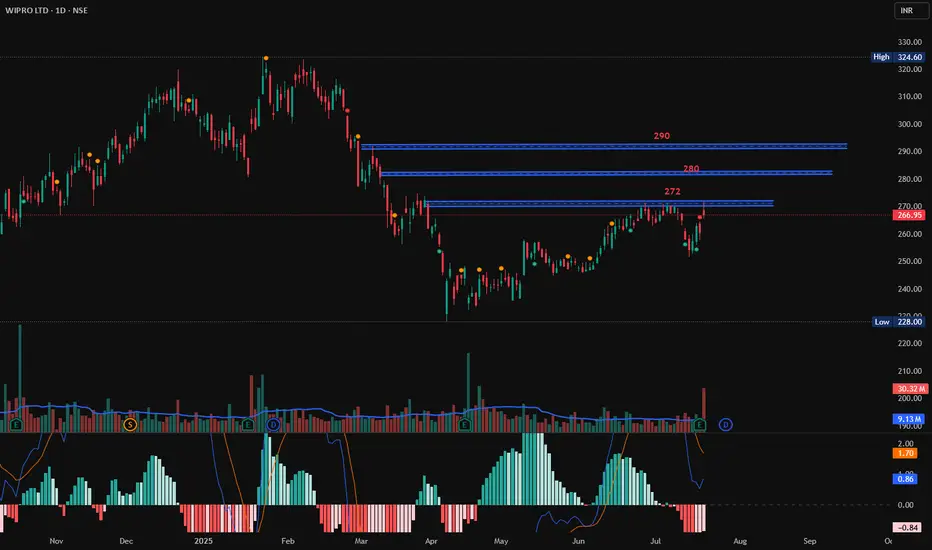
Wipro at Resistance, Long, 1DWipro has shown huge volume traded today however it has not broken a resistance which is at 272. If it breaks 272 with Bullish candlestick patterns like Bullish Engulfing, Hammer & Inverted Hammer, Piercing Line, Morning Star, Three White Soldiers, Tweezer Bottoms or Bullish Harami, then enter at 272 with small targets of 280 and 290.
Entry: 272 (only at Bullish candlestick pattern)
Target1: 280
Target2: 290
WIPRO & the Squiggle Prophecy Drew this green curve a year ago just for vibes… and WIPRO said “bet.”
Now it’s casually forming a monstrous cup, heading toward the ₹320 neckline.
If that breaks, we might see ₹370+, and maaaybe ₹480-ish… ish. Idk. Don’t ask me. Ask the squiggle.
Hopefully the squiggle squiggle prophecy holds true and I make more money lmao 💸
📈 When price action meets prophecy.

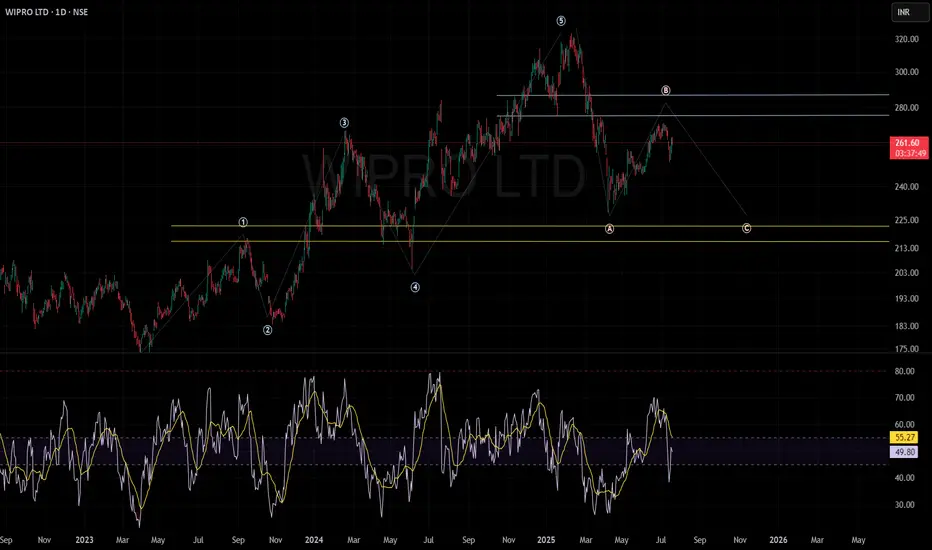
WIPRO CAN STILL FACE SOME PRESSUREWIPRO LTD.
Wave Structure:
The chart depicts a well-defined Elliott Wave pattern, illustrating a completed five-wave impulse sequence succeeded by a classic ABC corrective phase.
Wave B retracement appears to be underway, with resistance anticipated around the ₹275–₹285 zone.
Support & Resistance:
Key resistance levels are established at ₹275–₹285, which historically coincided with selling pressure and reversal zones.
Major support zones are highlighted between ₹210–₹225, a region with repeated buying interest and robust price recovery in the past.
Technical Outlook:
The current price structure suggests continued corrective bias, with a probable move towards the lower support band (₹210–₹225), barring any decisive reversal above the key resistance.
Unless momentum breaks out above ₹285 with conviction, the base scenario remains cautious to bearish.
My analysis is anchored in classical price action and Elliott Wave theory to identify potential market inflection points.
Sentiment:
The prevailing market sentiment remains neutral to negative as the price fails to breach significant resistance and is trading below the Wave B peak.
A shift in momentum can only be confirmed if there is sustained price action above resistance with increased volume.
Disclaimer:
This analysis is strictly for educational and informational purposes, not intended as trading or investment advice.
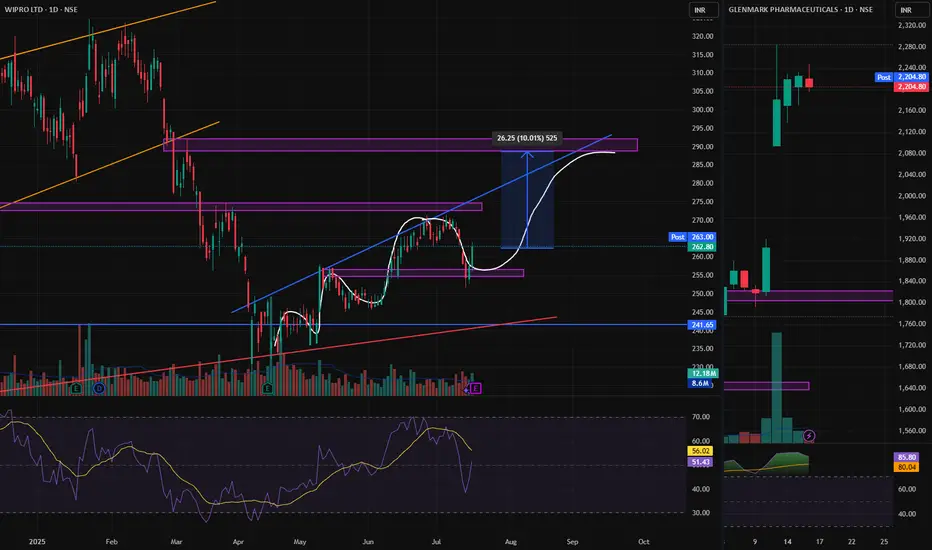
WIPRO, CREATING NEW HIGHER HIGHWIPRO, Creating new higher high pattern, this can reward us with 10% return in few weeks. mark the levels and plan your trade.
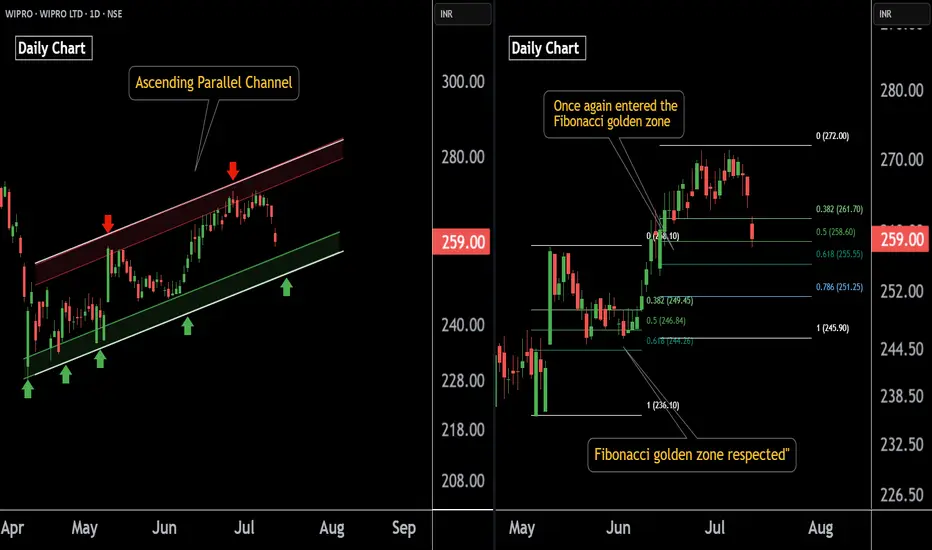
Wipro AT Best Support Zone These are two daily timeframe charts of Wipro .
In the first chart : Wipro is trading within an ascending parallel channel, with the lower boundary positioned around the ₹251–₹254 zone.
Wipro has previously respected the Fibonacci golden zone, and the stock is once again approaching this key retracement area. A potential bounce from this zone is likely if the level is respected again around 254 near .
If this level is sustain , then we may see higher Prices in Wipro.
Thank You !!

Wipro : Momentum continues after a buy signal
Wipro : Momentum continues after a buy signal .
Watch out for a major Red Band Resistance.
( Not a Buy / Sell Recommendation
Do your own due diligence ,Market is subject to risks, This is my own view and for learning only .)

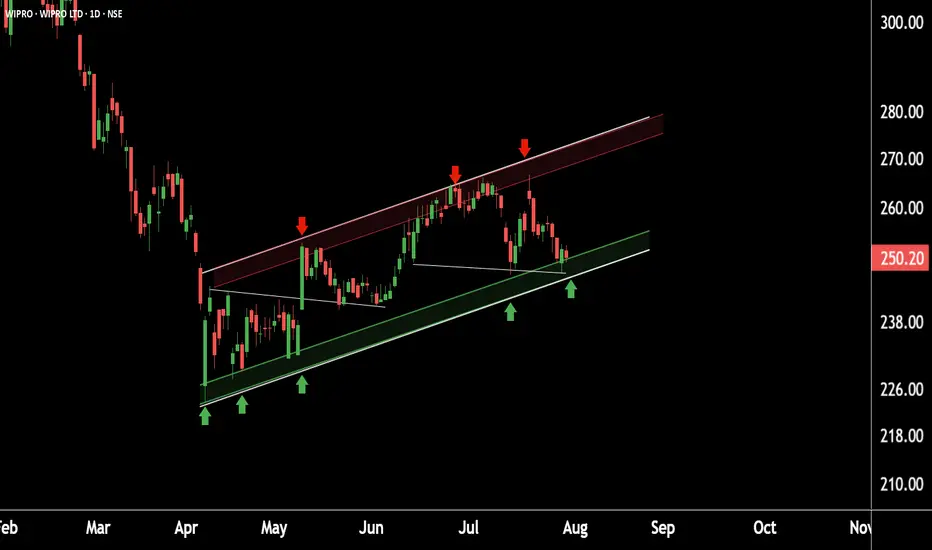
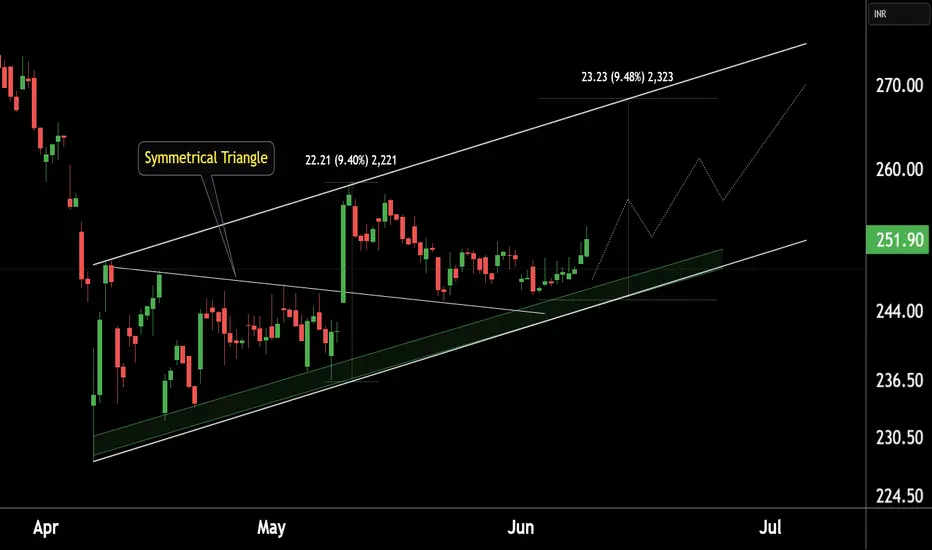
WIPRO at Best Support !!This is the 4 hour chart of Wipro ltd.
WIPRO has a strong support zone in the 245–248 range.
WIPRO is forming a symmetrical triangle pattern, with a potential target of 268, which also aligns with the channel's resistance zone at 268-270."
If this level is sustain , we may see higher prices in Wipro !!
Thank You
Wipro ExitWipro 247 is in bearish trend. Exit with SL 243.
Signals are negatively diverged.
If support breached, it may fall to 213.

WiproThis stock is showing signs of a potential reversal on the weekly timeframe, based on Fibonacci retracement levels and 200( ema+ dma) dynamic support may move upwards.

Wipro in recovery mode on monthly chart.Wipro Ltd. is a global information technology, consulting and outsourcing company, which engages in the development and integration of solutions.
Wipro Closing price is 249.67. The positive aspects of the company are Attractive Valuation (P.E. = 19.9), Companies with Zero Promoter Pledge, Companies with Low Debt, Annual Profit Growth higher than Sector Profit Growth, Company able to generate Net Cash - Improving Net Cash Flow for last 2 years and FII / FPI or Institutions increasing their shareholding. The Negative aspects of the company are Stocks Underperforming their Industry Price Change in the Quarter, Promoter decreasing their shareholding, Increasing Trend in Non-Core Income and MFs decreased their shareholding last quarter.
Entry can be taken after closing above 251 Historical Resistance in the stock will be 257 and 277. PEAK Historic Resistance in the stock will be 292 and 312. Stop loss in the stock should be maintained at Closing below 227.
Disclaimer: The above information is provided for educational purpose, analysis and paper trading only. Please don't treat this as a buy or sell recommendation for the stock or index. The Techno-Funda analysis is based on data that is more than 3 months old. Supports and Resistances are determined by historic past peaks and Valley in the chart. Many other indicators and patterns like EMA, RSI, MACD, Volumes, Fibonacci, parallel channel etc. use historic data which is 3 months or older cyclical points. There is no guarantee they will work in future as markets are highly volatile and swings in prices are also due to macro and micro factors based on actions taken by the company as well as region and global events. Equity investment is subject to risks. I or my clients or family members might have positions in the stocks that we mention in our educational posts. We will not be responsible for any Profit or loss that may occur due to any financial decision taken based on any data provided in this message. Do consult your investment advisor before taking any financial decisions. Stop losses should be an important part of any investment in equity.

WIPRO - Wipro Ltd. (45 minutes chart, NSE) - Long PositionWIPRO - Wipro Ltd. (45 minutes chart, NSE) - Long Position; short-term research idea.
Risk assessment: Medium {volume & support structure integrity risk}
Risk/Reward ratio ~ 2
Current Market Price (CMP) ~ 254.4
Entry limit ~ 254 on May 16, 2025
1. Target limit ~ 258.5 (+1.77%; +4.5 points)
2. Target limit ~ 263 (+3.54%; +9 points)
Stop order limit ~ 249.5 (-1.77%; -4.5 points)
Disclaimer: Investments in securities markets are subject to market risks. All information presented in this group is strictly for reference and personal study purposes only and is not a recommendation and/or a solicitation to act upon under any interpretation of the letter.
LEGEND:
{curly brackets} = observation notes
= important updates
(parentheses) = information details
~ tilde/approximation = variable value
-hyphen = fixed value

Wipro Ltd view for Intraday 15th May #WIPRO Wipro Ltd view for Intraday 15th May #WIPRO
Resistance 255 Watching above 255 for upside momentum.
Support area 250 Below 250 ignoring upside momentum for intraday
Watching below 249 for downside movement...
Above 255 ignoring downside move for intraday
Charts for Educational purposes only.
Please follow strict stop loss and risk reward if you follow the level.
Thanks,
V Trade Point
