#BSW/USDT is bullish engulfing and also took ?#BSW
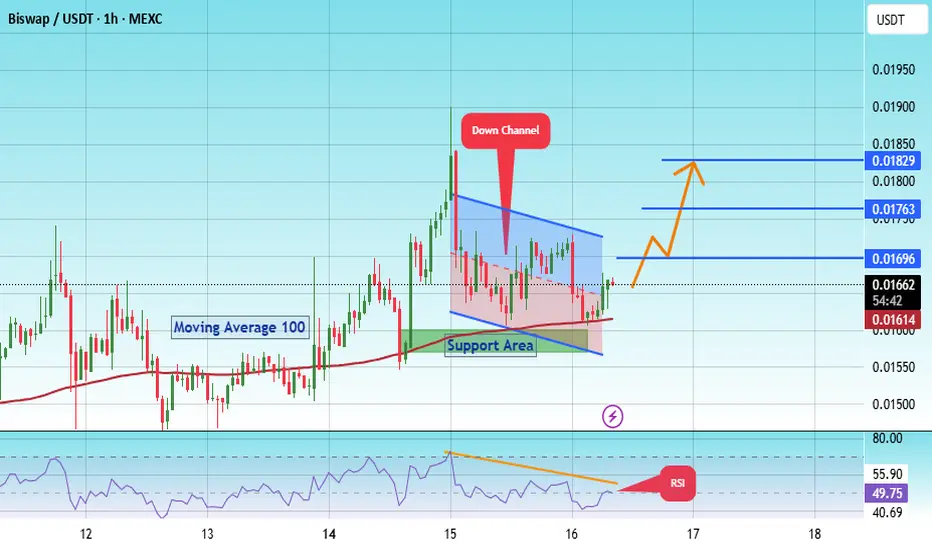
The price is moving within a descending channel on the 1-hour frame, adhering well to it, and is on its way to breaking it strongly upwards and retesting it.
We have a bounce from the lower boundary of the descending channel. This support is at 0.01580.
We have a downtrend on the RSI indicato
Key data points
No news here
Looks like there's nothing to report right now
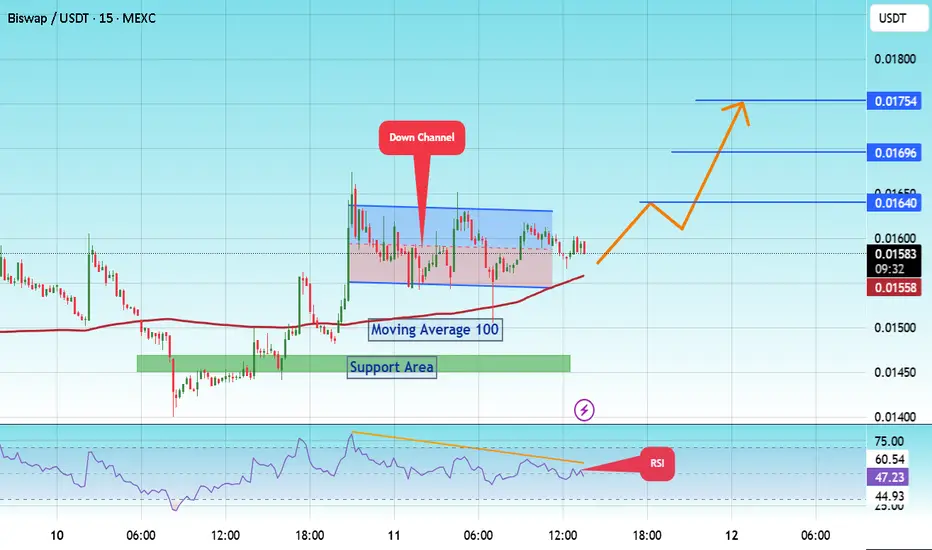
#BSW/USDT How Long Will It Take For A $0.01754 Target?#BSW
The price is moving within a descending channel on the 15-minute frame and is expected to break and continue upward.
We have a trend to stabilize above the 100 Moving Average once again.
We have a downtrend on the RSI indicator that supports the upward break.
We have a support area at the l
#BSW/USDT is bullish engulfing and also took#BSW
The price is moving within a descending channel on the 1-hour frame and is expected to break and continue upward.
We have a trend to stabilize above the 100 moving average once again.
We have a downtrend on the RSI indicator that supports the upward break.
We have a support area at the lowe

BSW Bull Trap:Binance Delisting + Weak Fundamentals = -50% AheadToday, I want to analyze the Biswap project ( BINANCE:BSWUSDT ) with the BSW token for you and examine the opportunity for a short position on the BSW token from a Fundamental and Technical perspective.
First, let's examine the conditions of the Biswap project from a Fundamental persp


BSWUSDT Forming Falling WedgeBSWUSDT is currently showcasing a classic falling wedge pattern, a bullish reversal signal often associated with a sharp move to the upside once the pattern resolves. This technical structure forms when price action consolidates with lower highs and lower lows, while volume typically decreases — set

BSWUSDT is printed bullish engulfing and also took BSWUSDT is printed bullish engulfing and also took support on looking good volume
BSW/USDT Analysis – Weekly Timeframe
#BSW The price is currently moving within a descending trend channel, showing attempts to break out of the structure.
📌 The ideal buy signal will be confirmed by a weekly candle close above the 0.0535 USDT level, which acts as a key resistance.
🎯 Potential upside targets after breakout:
Target

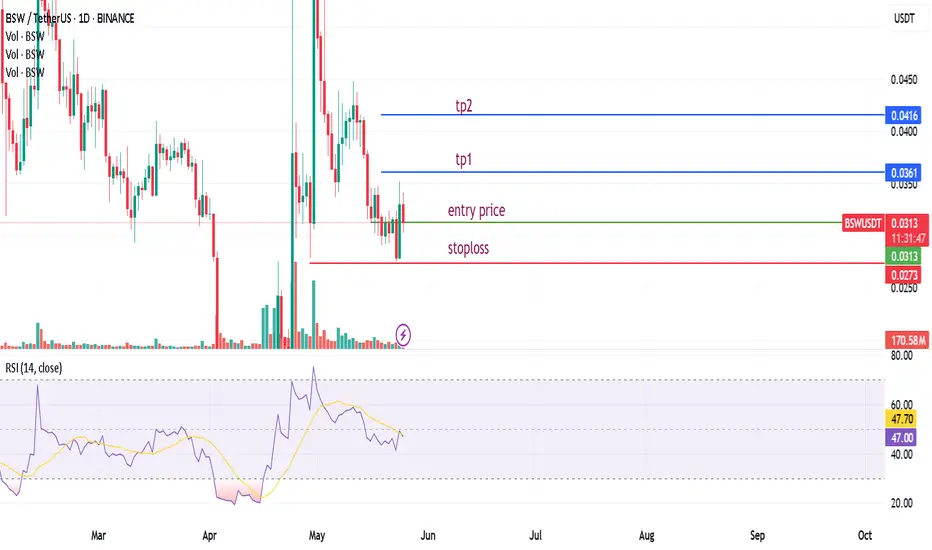
6/3 RR tradePrice may stop at the indicated daily SOR. Likely. A safer entry is provided however. There is good risk:reward for either trade!

BSW LONG Long
#BSW/USDT
Entry zone : 0.0416227 - 0.0428670
Targets : 0.0431224 - 0.0439763 - 0.0448302 - 0.0456841 - 0.0465380 - 0.0473919 - 0.0482458 - 0.0490997
Stop loss :0.0399063

See all ideas
Summarizing what the indicators are suggesting.
Oscillators
Neutral
SellBuy
Strong sellStrong buy
Strong sellSellNeutralBuyStrong buy
Oscillators
Neutral
SellBuy
Strong sellStrong buy
Strong sellSellNeutralBuyStrong buy
Summary
Neutral
SellBuy
Strong sellStrong buy
Strong sellSellNeutralBuyStrong buy
Summary
Neutral
SellBuy
Strong sellStrong buy
Strong sellSellNeutralBuyStrong buy
Summary
Neutral
SellBuy
Strong sellStrong buy
Strong sellSellNeutralBuyStrong buy
Moving Averages
Neutral
SellBuy
Strong sellStrong buy
Strong sellSellNeutralBuyStrong buy
Moving Averages
Neutral
SellBuy
Strong sellStrong buy
Strong sellSellNeutralBuyStrong buy
Curated watchlists where BSWUSDT is featured.

Frequently Asked Questions
The current price of BSW / Tether USD (BSW) is 0.026823 USDT — it has fallen −7.59% in the past 24 hours. Try placing this info into the context by checking out what coins are also gaining and losing at the moment and seeing BSW price chart.
BSW / Tether USD price has risen by 27.58% over the last week, its month performance shows a 82.04% increase, and as for the last year, BSW / Tether USD has increased by 170.64%. See more dynamics on BSW price chart.
Keep track of coins' changes with our Crypto Coins Heatmap.
Keep track of coins' changes with our Crypto Coins Heatmap.
BSW / Tether USD (BSW) reached its highest price on May 1, 2025 — it amounted to 0.060787 USDT. Find more insights on the BSW price chart.
See the list of crypto gainers and choose what best fits your strategy.
See the list of crypto gainers and choose what best fits your strategy.
BSW / Tether USD (BSW) reached the lowest price of 0.010000 USDT on Apr 30, 2025. View more BSW / Tether USD dynamics on the price chart.
See the list of crypto losers to find unexpected opportunities.
See the list of crypto losers to find unexpected opportunities.
The safest choice when buying BSW is to go to a well-known crypto exchange. Some of the popular names are Binance, Coinbase, Kraken. But you'll have to find a reliable broker and create an account first. You can trade BSW right from TradingView charts — just choose a broker and connect to your account.
BSW / Tether USD (BSW) is just as reliable as any other crypto asset — this corner of the world market is highly volatile. Today, for instance, BSW / Tether USD is estimated as 10.24% volatile. The only thing it means is that you must prepare and examine all available information before making a decision. And if you're not sure about BSW / Tether USD, you can find more inspiration in our curated watchlists.
You can discuss BSW / Tether USD (BSW) with other users in our public chats, Minds or in the comments to Ideas.