BTC bullish shark harmonicAfter yesterdays $20 billion worth of liquidations it was time to zoom out a little.
Here I'm posting this bullish shark harmonic, yes, it doesn't look bullish considering what we witnessed yesterday and for me there was a lot of manipulation involved, directly after the CME closed we saw a massive liquidation event that not even your SL could save.
President Trump posted something on Truth Social about China holding countries to ransom for their rare earth minerals, now, we all know that Trump won't take that lying down and will obviously set tarrifs against China (at time of posting, this hasn't happened yet) once it does then we could see a further drop.
This shark harmonic is showing the way and a possible drop into the CME gap between $97k-$96k, at time of posting btc is currently at $111,770 which if given there's still a possible $15k drop to come, yesterdays liquidations saw btc dump around the same levels.....
This is only my thoughts and not financial advice
Stay safe......
Trade ideas

Bitcoin btc 4h
The main target of the analysis is a decline to the $98,000 zone.
If price takes the opposite path and closes above $126,500 on the 4-hour chart, the bearish analysis is invalidated and price is expected to rise toward the $141,700–$142,000 zone.

Bitcoin Breaks $123K Resistance as Bulls Target $133K Bitcoin has reclaimed the critical $123,000 resistance level, confirming renewed acceptance in its upper trading channel. This breakout paves the way for a possible rotation toward the $133,000 macro target.
Bitcoin continues to lead broader market sentiment, acting as the benchmark for overall bullish momentum. Following weeks of range consolidation, the decisive move above $123K signals strength and increasing demand among market participants.
Key Technical Points
- Breakout Level: $123,000 reclaimed on daily close, confirming channel acceptance.
- Target Objective: $133,000 represents the next structural resistance zone.
- Market Context: Rising open interest and healthy funding rates support sustainable momentum.
The $123,000 level was previously a high-timeframe resistance acting as a ceiling for several weeks. The recent bullish breakout now flips this level into support, signaling the start of a potential expansion phase within Bitcoin’s larger ascending channel.
Market participation metrics confirm the breakout’s legitimacy. Both open interest and spot volume have increased in tandem, showing that the move is supported by genuine buying activity rather than short-term speculation. On the daily timeframe, consecutive bullish closes above $123K reinforce structural strength, while the channel high near $133K remains the next logical technical magnet.
Additionally, Bitcoin’s dominance has stabilized, suggesting that capital rotation may follow toward major altcoins once BTC reaches its upper target region.
What to Expect in the Coming Price Action
As long as Bitcoin holds above $123K, the next technical rotation toward $133K remains the most probable scenario. Sustained bullish structure and volume support could open the path for another all-time-high challenge in the medium term.

BTC; Aiming For A New (ATH) At $140k ?Bitcoin is set to break this resistance level and scale toward $140k before the year end. it have been moving within this momentum region of $109k-$123k for this couple of weeks, which we experienced a new ATH at $126k this week.
However according this structure our SMA 80 and SMA 200 the chances of this new ATH clearly high, also the "uptober" psychology actually nails the current market movement.
My fellow traders and investors do think we would see a plane climb to $140k by December..?
Like and share your thoughts
Thanks for reading.

BTC - All Important Trendlines and Liquidity ZonesAs of the current Bitcoin trend, I have outlined 3 key trendlines as well as the two major liquidity zones we need to keep an eye on right now.
The "Upper Resistance Trendline" has so far marked our three recent all time highs (red arrows). This has been a series of higher highs, which is normally a good sign in a bull market, the only problem is we are started to see some early signs of bearish divergence.
The "Middle Trendline" has acted as a key level mainly for the candle bodies. It has been a support/resistance flip level, but may have confluence in the future.
The "Lower Support Trendline" has acted as our three recent lows. It has helped to create a series of higher lows which is a good sign in an uptrend. The trend needs to maintain this series of higher lows, once we see the confirmation of this trend broken, the bear market will have begun.
Now let's focus on the two main liquidity zones right now.
The first is our "Important Liquidity Zone". This represents all the resistance that was built up from July-August 2025. Ideally, for this uptrend to continue to make new higher highs, this important liquidity zone is a crucial area to hold as a new support level. It ranges from $119.3k-$120.4k. A flip of this zone into new support would indicate that Bitcoin is ready for new all time highs. That is the first thing to watch for.
However, the "Middle Liquidity Zone" represents the $116k-$118k level. This level marked many support/resistance levels for our current trend. Therefore, if our main liquidity zone is breached this could come in confluence with our middle trendline.

BTC daily chartThis is my analysis for BTC,it is on the daily chart, no need to panic, this is a very healthy correction.

BTC Price Overview from 19Oct till 26Oct or Oct MonthCOINBASE:BTCUSD CRYPTO:BTCUSD KRAKEN:BTCUSD GEMINI:BTCUSD BINANCE:BTCUSD BINANCE:BTCUSDT.P BYBIT:BTCUSDT.P BYBIT:BTCUSD.P OKX:BTCUSDT.P MEXC:BTCUSDT.P BITGET:BTCUSDT.P BINANCE:BTCUSD.P DELTAIN:BTCUSD.P BINGX:BTCUSDT.P BITMEX:BTCUSD.P DERIBIT:BTCUSD.P KRAKEN:BTCUSD.P COINBASE:BTCUSDC.P
COINBASE:USDTUSD KRAKEN:USDTUSD
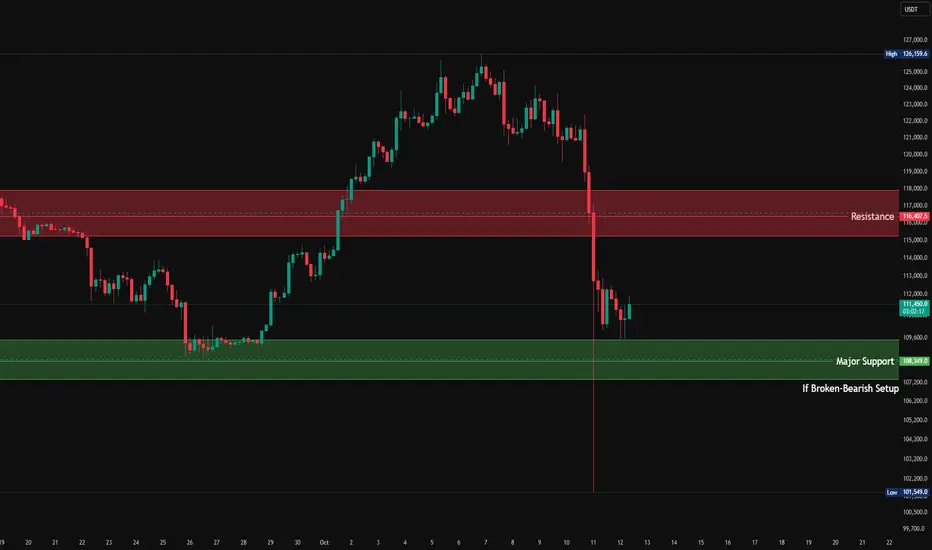
🧭 General Overview
Timeframe: 4H
Asset: USDT-BTC
Current Price: ≈ 111,300 USDT
Major Resistance Zone: 116,000–116,400 USDT
Major Support Zone: 108,000–108,350 USDT
Recent High: 126,159 USDT
Recent Low: 101,549 USDT
Price recently rejected from the resistance zone after a strong breakdown, suggesting momentum has turned bearish in the short term.
🧩 Structure & Key Zones
1️⃣ Resistance Zone: 116,000–116,400 USDT
This zone acted as previous support that broke down sharply.
On retest, it now serves as major supply/resistance.
A strong bearish candle initiated from this zone, showing seller dominance.
📉 Expect:
Sellers to re-enter aggressively if price tests this level again.
A lower high formation below 116K = confirmation of short-term bearish bias.
2️⃣ Support Zone: 108,000–108,350 USDT
This is a major demand area, visible from the past bounce.
Price has wicked into it but hasn’t closed below yet — buyers are still defending.
⚠️ If this zone breaks (close below 108K):
Opens room for a deeper correction toward:
106,200 → 103,000 → 101,500 (recent swing low)
📅 Next Week’s Outlook
🔹 Bullish Scenario (Short-Term Relief Rally)
If price holds above 108K and breaks above 112K, we could see:
Short-term bounce toward 114.5K–116K (Resistance Retest)
Watch for rejection candles or weakening momentum there.
Suitable for short-term scalp longs, but risky for swing trades due to strong overhead supply.
🔹 Bearish Scenario (Primary Bias)
Given:
Strong downtrend continuation
Failed recovery attempts
Rejection from prior demand turned supply zone (116K)
If 108K fails, expect:
Acceleration to 105K–102K
Possible overshoot wicks below 101.5K before consolidation or reversal attempt.
Bearish targets for next week (if breakdown occurs):
TP1 → 106,200
TP2 → 103,000
TP3 → 101,500
🕐 Short-Term Perspective (Next 24–72 Hours)
Price is currently consolidating sideways between 111K–108K.
Watch for a range break:
Above 112K → short-term bullish relief
Below 108K → confirmation of bearish continuation
Volume and candle body analysis suggest that sellers are stronger, but buyers are still defending 108K strongly.
🔍 Key Takeaways
The trend is bearish, but we’re at critical support.
Watch 108K closely — it’s the line between correction & collapse.
Any bounce toward 114–116K is likely a sell opportunity.
A breakdown below 108K opens path toward the 100–102K zone.
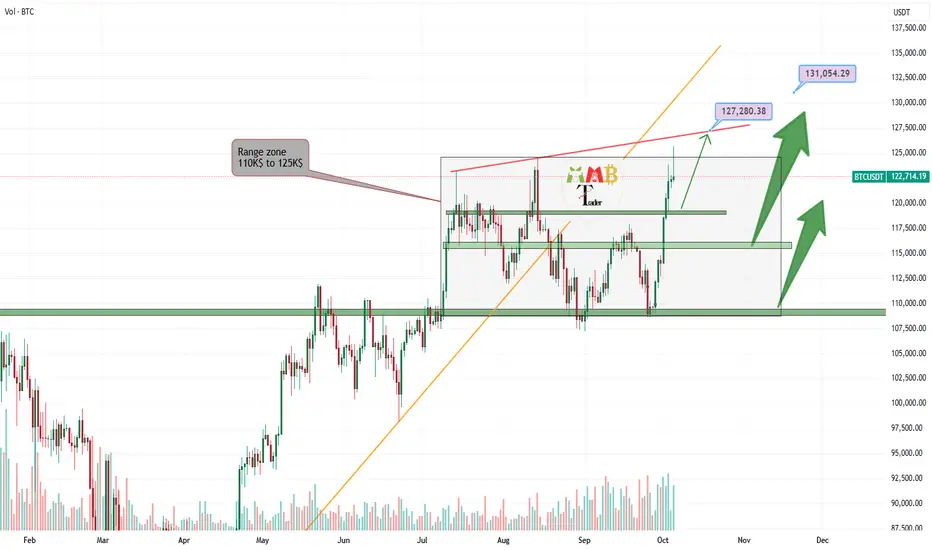
Bitcoin the price is still in range zone The price is still bounded with this support and resistance of range zone which is also mentioned on the chart too and soon i believe we can expect breakout of 125K$ to the upside and then targets like 127K$ & 132$ are easy to hit as new ATH.
But also we should remember this that if 110K$ break to the downside then market is bearish after a months and dump can be huge.
DISCLAIMER: ((trade based on your own decision))
<<press like👍 if you enjoy💚
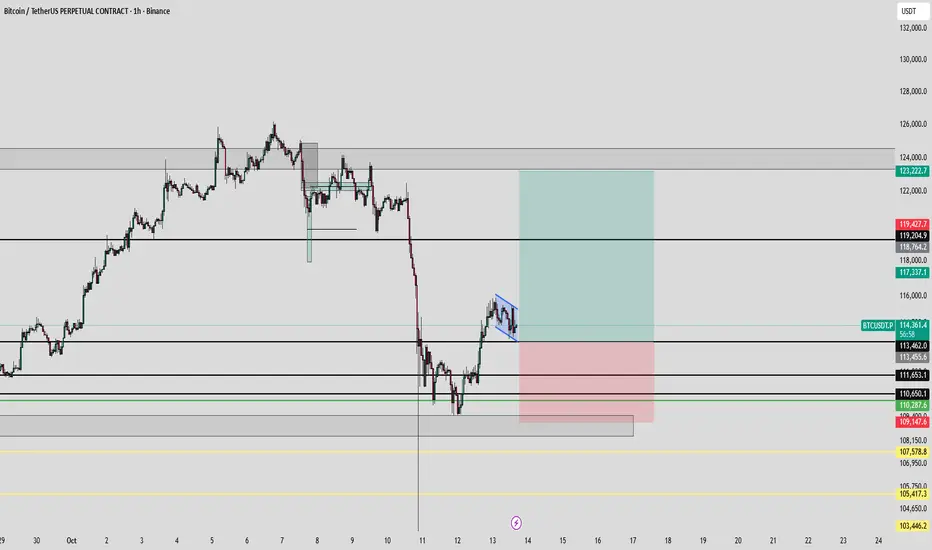
BTC LONG SETUP 1HAfter a sharp drop, BTC has formed a clear reversal pattern around the demand zone (110–111k).
Currently, price is consolidating in a bullish flag structure right above support — indicating potential continuation to the upside.
🎯 Targets: 117.3k – 119.4k – 123.2k
🛑 Invalidation: Below 110k zone
💡 As long as this structure holds, expecting bullish continuation towards the upper supply region.
#Bitcoin #BTCUSDT #PriceAction #CryptoTrading #TradingSetup #LongSetup #TechnicalAnalysis
BTCUSDTThis breakout will push BTCUSD back up to 122k. But don't bet all your capital because of that. The market can be volatile, always manage your risk.

Bitcoin Still Has Strong Support Zones — Don’t Lose Hope YetDuring the recent drop from $121,000, Bitcoin didn’t find any strong support levels to hold the price. As I’ve mentioned before, a healthy uptrend must include corrections — otherwise, when correction finally comes, it tends to be deep and aggressive.
That said, there’s still room for further downside, but this time, we have several key support zones that won’t be easily broken:
$108,551 – $109,227
$107,045 – $107,419
$104,783 – $105,395
The reason I’m highlighting these areas is to remind you that each of these zones could act as a potential reversal point, providing buyers with a chance to support the market. So, the situation is not hopeless — the market can still recover from these levels.
If you decide to take a short position, make sure to take profit quickly, close your position, or at least set it to breakeven, since we’re approaching strong demand zones.
As for long positions, I believe it’s still too early — I prefer to wait and see how Bitcoin builds its next price structure before entering.
If Bitcoin dominance starts showing green candles, altcoins might perform better for short trades.

BTC at the China's Mercy$19,000,000,000 liquidated from the crypto market last Friday Oct.10,2025 at the closing of the NYSE Session as Trump's threatens to impose new 100% Tariffs for China. This event recorded the biggest liquidation in Crypto History.
China also warns the US government of countermeasures if Trump doesn’t walk back tariff threat that will be effective Nov.1,2025.
BTC declines to $104,782 as a reaction to fear. Now the scenario is at China's Mercy if they will continue the tariff war between the US or make a truce.
Interest rates announcement gains has been wiped out by this bold declaration of added tariffs.
Upcoming rate cuts can move the BTC to $115K but another fall can happen this week if the tension grows expecting at $100k .
This is not the 1st time Trump has moved the market for Tariff war declaration for China and other countries. Tariffs has been Trump's weapon against China and his main way to raise US revenues.
The Trade war between two countries has massive economic impact on stocks, crypto and other investment vehicles as seen on the market's Fear index.
Can Trump really stand against China?

Bitcoin 130,000 – Correction AheadBitcoin
Around the $130,000 level, there is a possibility of a deep correction toward the $74,000 zone.
Do not panic, and do not get carried away by emotions.
This is the market — it plays with your psychology.
The market is geometric. BYBIT:BTCUSDT

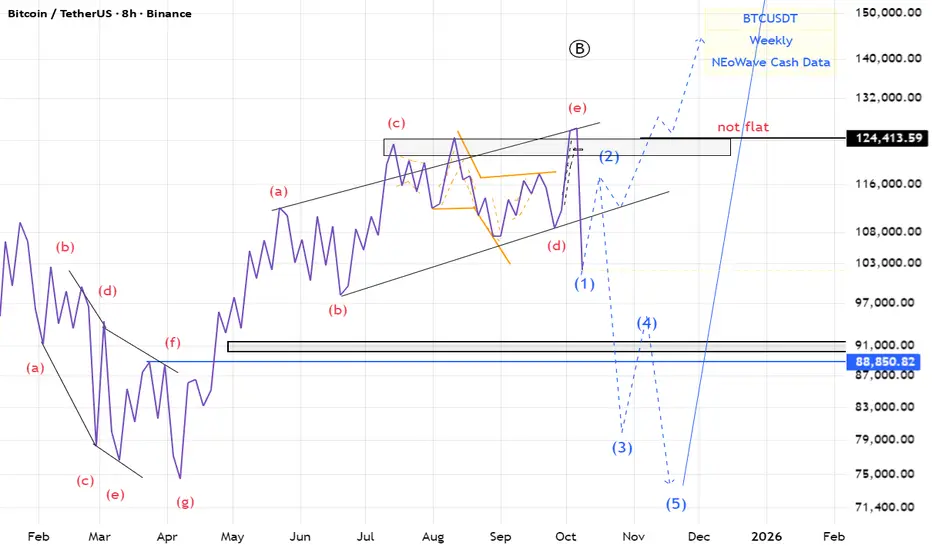
BTC(based on NEo wave)there is a good possibility for the irregular flat.
I think 2-3 month we will see the red market
BTC/USDT – Downtrend ContinuesBitcoin is facing downward pressure after the escalation of US-China trade tensions. Although President Trump made more conciliatory remarks, which helped ease short-term concerns, the global economic uncertainty remains a major factor driving BTC/USDT into a downtrend.
On the chart, BTC/USDT is moving within a clear downtrend channel. Despite a slight recovery, the price is currently fluctuating around $113,129 and could continue to adjust towards the 106,500 USD and 101,800 USD targets in the near term.
With ongoing macroeconomic instability and no strong signs of recovery, Bitcoin may continue to decline in the short term.

BTCUSDT: Trend in 4-H time frameBitcoin has dropped to around $102,300. The key support level and the 50 MV in weekly time frame are both located near $99,700. It’s important to note that there’s a $3,000 price gap, which makes a retest of that zone quite possible.
Looking at Bitcoin’s current setup, there’s also a chance it could retest the 200 MV in daily time frame, situated near $106,800.
A major resistance level can be found around $115,800, and price action around that zone should be watched closely.
Overall, market conditions remain uncertain and unsettled, making it difficult to define a clear trend for Bitcoin or the broader market. That said, the overall trend remains bearish, with potential downside targets across different timeframes around $91700, $81200, $75100, and $70300. Reactions at these levels are to be expected — but if this downward trajectory continues, altcoins are likely to suffer more severely, possibly testing even lower price levels.
The color levels are very accurate levels of support and resistance in different time frames.
A strong move requires a correction to major support and we have to wait for their reaction in these areas.
So, Please pay special attention to the two accurate trends, colored levels, and you must know that SETUP is very sensitive.
BEST,
MT

Btcusdt I think btc re tests 120k every altcoin accumulation shoot up rsi os oversold on small timeframes i think btc will recover

BTC short We have a strong MSB at 1/4h with IMB in the high zone and short reactions on imbalances, a good chance for a possible short reaction from this zone
A strong OB with imbalance and the zone above is defended as a possible manipulation of a bigger short, regardless this is a chance for a smaller but safer R, although nothing is certain with BTC . . .

BTC Head & Shoulders Wave – Short Setup Loading🏄♂️ 📉
📊 Current Setup
BTC just played out a clean head & shoulders pattern right at the $125K resistance zone 😤. After that last push up, price snapped the mid-term bullish trendline with a heavy bearish hit — and that drop nailed the H&S target perfectly, showing real momentum from sellers 🔥.
Now we’re chillin’ inside a lower-low consolidation zone, and bears still look like they’ve got fuel in the tank.
🚦 Scenarios
👉 If BTC pulls back toward the $123,456 zone, I’m watchin’ close — if the structure lines up, that’s a sweet short setup waiting to be surfed 🏄♂️💥.
👉 A clean rejection there could send us down for another solid leg, while a breakout reclaim above $125K would start to weaken the bearish case.
🧭 My Take
Momentum’s clearly shifted — bulls are on the ropes, and the trendline break confirmed it. I’m stayin’ patient for that retracement entry, ready to catch the next wave down 📉🤙.
💬 What do you think about this scenario? Only share your idea if you’ve got another opinion — otherwise just hit that button 👍

BTC Bear Flag10/11/25 15minBTC just dropped significantly and is now in a channel on the 15 minute chart.

[SeoVereign] BITCOIN BEARISH Outlook – October 05, 2025Hello everyone.
I hope you are all having a peaceful day.
Today, I am writing to share my Bitcoin short position view as of October 5th.
The first basis is the 1.902 CRAB pattern. In a traditional Crab pattern, the 1.618 extension of the XA leg is regarded as the main PRZ (Potential Reversal Zone), but in practice, it is often observed that additional extension values such as 1.902XA are formed. This zone is an area where the price, after an excessive extension, tends to reverse sharply, and it is one of the regions within harmonic patterns where strong volatility and reversal signals frequently appear. Currently, Bitcoin is encountering resistance around this 1.902XA level, which increases the probability of a short-term bearish reversal.
The second basis is that wave N and wave M are forming a 1:1 length ratio. In other words, both waves are proceeding with equal length, which resembles the AB=CD structure—a fundamental form of harmonic patterns. Such wave symmetry indicates that the market is moving in a consistent rhythm, and when two waves complete with the same length, that point often acts as a reversal signal.
Accordingly, the average target price is set around 119,168 USDT.
As the chart continues to develop, I will provide updates to this idea to inform you about my position management.
Thank you for reading.

Forecast for BTCUSDT 13th October 2026 (Updated)Forecast for BTC for the next 4 weeks. Weekend/Monday pump to ~$120k followed by a decline to to ~$105k. Then market forms a bottoming before all time highs to ~$150k-$170k-$200k

BTCUSDT 1DOk guys, let’s take a look at what’s happening on Bitcoin’s daily chart. We currently have a resistance zone and a support zone, and #BTC is moving between them.
Since Bitcoin is trading below the Ichimoku cloud and the SMA50, while both MACD and RSI are showing bearish signals — combined with the market fear caused by Trump-related news — there’s a chance BTC might retest the support zone around $108,377 ~ $107,146. This area aligns with the daily SMA200, where #Bitcoin could potentially bounce.
For a bullish scenario, Bitcoin needs to break above the resistance zone around $123,306 ~ $124,658. As long as it remains below this area, the market is considered to be in a bearish phase.
Additionally, due to market manipulation and both real and fake news, #BTC could briefly dip to the weekly support zone around $102,620 ~ $101,109, or even make a short-lived shadow below $100,000. As long as Bitcoin doesn’t close a weekly candle below $100,000, the market can still be considered safe and capable of reversing upward.
So, pay close attention to the support and resistance zones marked on the chart.
Important Recommendations:
1- Avoid opening any long or short positions for now.
2- In the spot market, don’t go hunting for coins or tokens just because they look cheap — sometimes the “bottom” you’re buying might actually be the top!
3- Be patient and let the market find its direction and stabilize. Sometimes, waiting and watching is the biggest profit.
4- If you’re an experienced trader, you can buy strong coins with a small portion of your capital while keeping most of your funds in stablecoins to enter at the right moment.
We hope this overview answers the questions many of you have sent us in private messages.
Stay safe! Don’t let fear take over — and don’t act emotionally!
