Bitcoin Resistance Zone Battle – ATH or Fakeout?Bitcoin ( BINANCE:BTCUSDT ) has shown strong momentum over the past 5 days , liquidating many traders in both Long and Short positions .
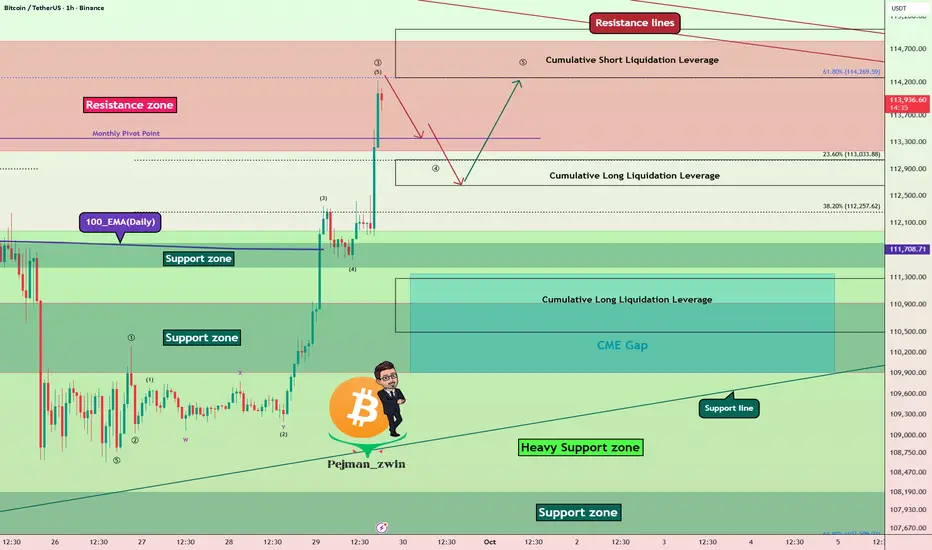
Bitcoin has now entered the Resistance zone($114,820-$113,170) and is moving near the Cumulative Short Liquidation Leverage($115,000-$114,272) and Resistance lines .
From an Elliott Wave Theory perspective, given Bitcoin’s strong bullish momentum over the past 24 hours, it appears to be completing Wave 3. This Wave 3 seems to be of the extended type.
I expect Bitcoin , after a correction , to make another attempt toward the Resistance zone($114,820-$113,170) and potentially test the Resistance lines .
Do you think this bullish move could lead to a new all-time high (ATH) for Bitcoin?
Cumulative Long Liquidation Leverage($113,037-$112,650) + Near Monthly Pivot Point($113,356): An area where Bitcoin could start rising again (if there is a correction, of course).
Cumulative Long Liquidation Leverage: $111,100-$110,500
CME Gap: $111,355-$109,915
Note: Also, Bitcoin approaching the 61.8% golden Fibonacci level could lead to a Bitcoin correction.
Please respect each other's ideas and express them politely if you agree or disagree.
Bitcoin Analysis (BTCUSDT), 1-hour time frame.
Be sure to follow the updated ideas.
Do not forget to put a Stop loss for your positions (For every position you want to open).
Please follow your strategy and updates; this is just my Idea, and I will gladly see your ideas in this post.
Please do not forget the ✅' like'✅ button 🙏😊 & Share it with your friends; thanks, and Trade safe.
BTCDOWNUSDT trade ideas
BTC/USDT: Bullish Surge to 136K?BINANCE:BTCUSDT is gearing up for a bullish move on the daily chart , with an entry either from the current level or a pullback to the specified trendline .
The target at 136000 aligns with the next major resistance, signaling strong upside potential. Set a stop loss on a daily close below 108500 to manage risk effectively.
A break above 118000 with solid volume could trigger this surge, driven by market sentiment and BTC dominance. Watch key news! 💡
📝 Trade Plan:
✅ Entry: From current price or on a pullback to the trendline
❌ Stop Loss: Daily close below 108,500 to manage risk
🎯 Target: 136,000 (next major resistance)
Ready for this lift-off? Drop your take below! 👇

DeGRAM | BTCUSD seeks to the $118k level📊 Technical Analysis
● BTC/USD bounced from the demand zone near 111K and reclaimed 114K resistance, signaling a structural shift toward bullish momentum.
● Current price action shows potential continuation with targets around 118K–124K if higher lows sustain above 112K.
💡 Fundamental Analysis
● Optimism in crypto markets is supported by rising institutional inflows and growing expectations of U.S. rate cuts, boosting risk assets.
✨ Summary
BTC/USD holds above 114K, with upside targets at 118K and 124K. Support rests at 112K for medium-term bullish continuation.
-------------------
Share your opinion in the comments and support the idea with a like. Thanks for your support!

Bitcoin : Stay heavy on positionsBitcoin : Stay heavy on positions (2x~3x)
Maintaining the same outlook as before.
** This analysis is based solely on the quantification of crowd psychology.
It does not incorporate price action, trading volume, or macroeconomic indicators.

$BTC to $150KLast quarter is extremely bullish for BTC. It seems that it's going through a pattern after $150K it'll drop and that will be the last drop you'll see in a while, it won't be going down $100K until maybe 2027, 2026 is primed for BTC to go beyond $200K with a personal target of $260-70K a BTC.

Bitcoin - Key support $105 - 107k Buyers Should step inBitcoin - Key support $105 - 107k Buyers Should step in or up trend is over
best confirmation for me Open interest absorption

Very important Bitcoin will soon reach the 41k areaVery important Bitcoin will soon reach the 41k area

DeGRAM | BTCUSD seeks to reach the resistance line📊 Technical Analysis
● BTC/USD broke above key resistance at 122,000, confirming a strong bullish continuation. The breakout from the descending channel and the retest of the former resistance as support signal sustained buying interest.
● The next technical target lies near 126,700, with potential extension toward the 130,000 zone if momentum remains intact.
💡 Fundamental Analysis
● Optimism around Bitcoin ETF inflows and growing institutional accumulation continue to support bullish sentiment, while easing U.S. yields enhance risk appetite.
✨ Summary
● Momentum favors continuation above 122,000 toward 126,700–130,000. Pullbacks to the support zone could offer renewed buying opportunities.
-------------------
Share your opinion in the comments and support the idea with a like. Thanks for your support!

BTC/USDT | BTC Uptober Begins – Massive Rally Loading!By analyzing the Bitcoin chart on the 4-hour timeframe, we can see that the price moved exactly as expected — it hit the $118,000 target and even rallied up to $123,900 . After reaching this key supply zone, which we had marked earlier, BTC faced selling pressure and is now trading around $121,800.
If Bitcoin can hold and stabilize above $120K , we could see a new ATH soon ! “Uptober” has just begun, and it looks like we’re in for a strong bullish month. The next upside targets are $125K, $132K, and $138K.
Please support me with your likes and comments to motivate me to share more analysis with you and share your opinion about the possible trend of this chart with me !
Best Regards , Arman Shaban

BTC to new ATH. Next reversal pullback at $132K-$135K$BTC. Congrats new ATH after ATH. Price heading to 132-135K zone.
I put resistance/reversal zone on the chart. Based on two different Fibonacci projections on different weekly swings.
Lets see how accurately it works. On backtesting it has been amazingly accurate. Especially when price going to discovery mode.

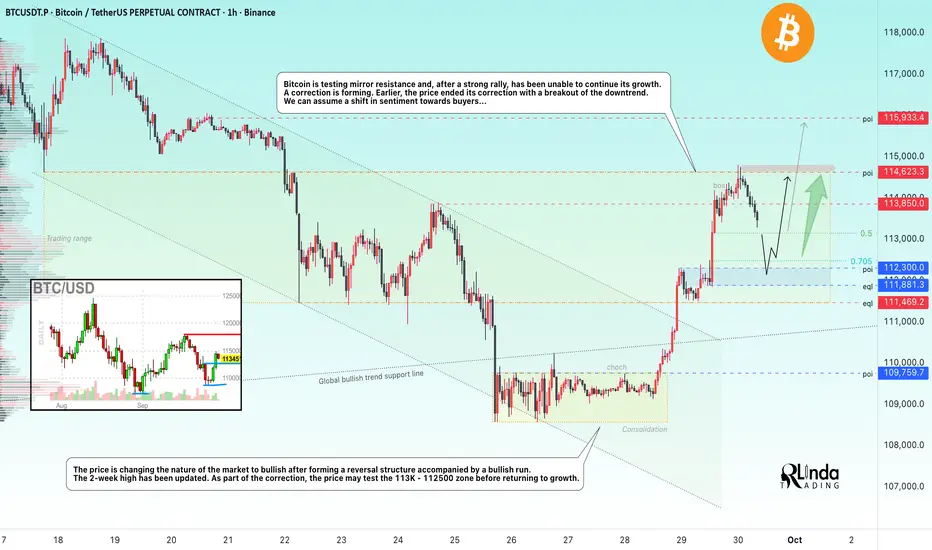
BITCOIN → Correction before the breakout of 114.5KBINANCE:BTCUSDT , after the end of the correction, is forming a 3.5% rally and testing the important milestone of 114,600. It was not possible to break through the level without consolidation and at such a high speed. How long will the correction last?
Bitcoin is testing mirror resistance and, after a strong rally, was unable to continue its growth. The reason for the halt is a huge liquidity pool above 114,600. A pullback is forming. Earlier, the price ended a 3-week correction by breaking through the downward resistance. We can assume a change in sentiment towards the buyer...
Technically, the price is changing the nature of the market to bullish after the formation of a reversal structure accompanied by a bullish run. The 2-week high has been updated.
Resistance levels: 113850, 114620, 115900
Support levels: 113100, 112300, 111800
As part of the correction, the price may test the 113K - 112500 zone before returning to growth. If the market holds the price above 112K - 113K, it will confirm the bullish sentiment, and the positive fundamental background will support further growth.
Best regards, R. Linda!
BITCOIN BITCOIN ,THE CURRENT structure shows no slowing down by buyers, if they break 124k they will head straight into 135k-145k zone .my goal is to see what buyer will do on the supply roof of the bullish channel.
layer by layer

Bitcoin bounce from Support, Bullish Momentum IntactBitcoin continues to show bullish momentum. A recent bounce from support shows the buyers are in charge. Let's take a 1:1 trade here.
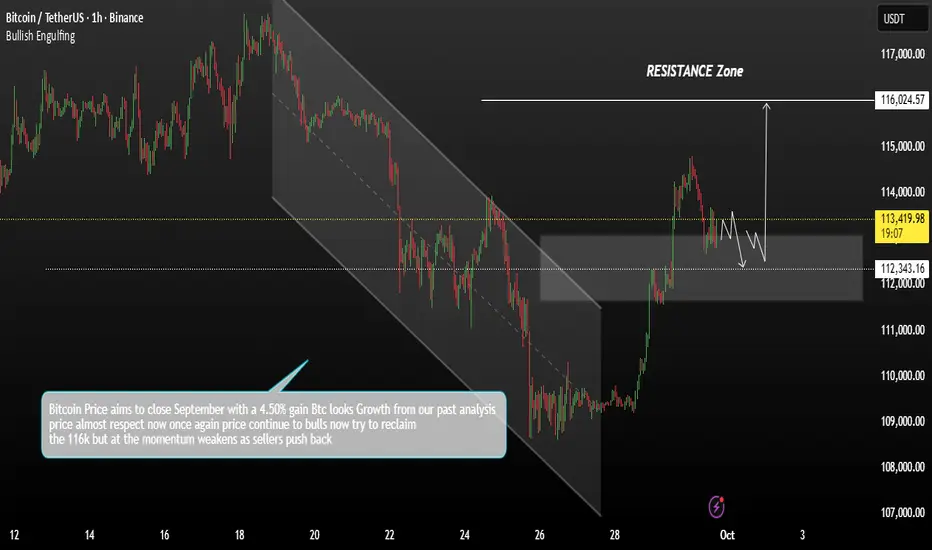
Bitcoin formation of a bullish reversal pattern.Bitcoin price is aiming to close September with a 4.50% monthly gain, signaling the potential end of the recent correction phase and the formation of a bullish reversal pattern.
Technical Analysis:
BTC is currently testing a key mirror resistance level after a strong rally. Despite the recent upward momentum, the price has so far struggled to extend its growth beyond this zone.
If Bitcoin manages to break above the critical 114,000 resistance, the market structure could shift to a bullish reversal, confirming the end of the corrective phase. In such a scenario, the next resistance level to watch would be around 116,000, where further bullish momentum could push the price higher.
You may find more details in the chart.
Trade wisely best of Luck.
Ps; Support with like and comments for better analysis Thanks
BTC new ATH, decision making levelsToday BTC achieved ATH 125,819k.
From the day start bounce from the support zone.
Today BTC went up around 2.6 % .
At the top ATH we have LQ + Res + VAH, at this point we are in Supply zone, but BTC not reacting much.
BTC going uptrend channel, that indicates possible uptrend even higher because there is more liquidation in po levels + Stocks +- 1% .
USA economics dont show weakness and BTC traders are still hyped about new highs.

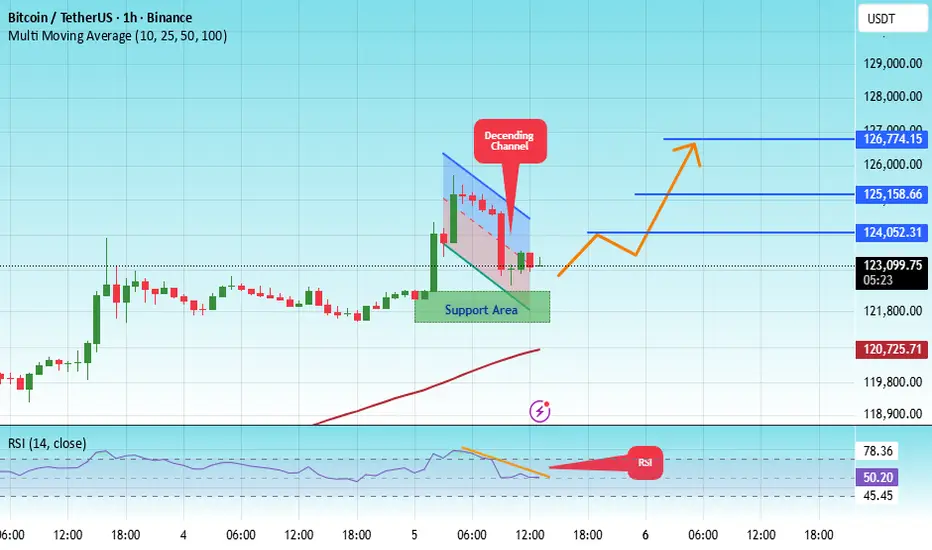
#BTC/USDT Let Bitcoin make a new ATH#BTC
The price is moving within a descending channel on the 1-hour frame, adhering well to it, and is heading for a strong breakout and retest.
We have a bearish trend on the RSI indicator that is about to be broken and retested, which supports the upward move.
There is a major support area in green at 121900, which represents a strong support point.
We are heading for consolidation above the 100 moving average.
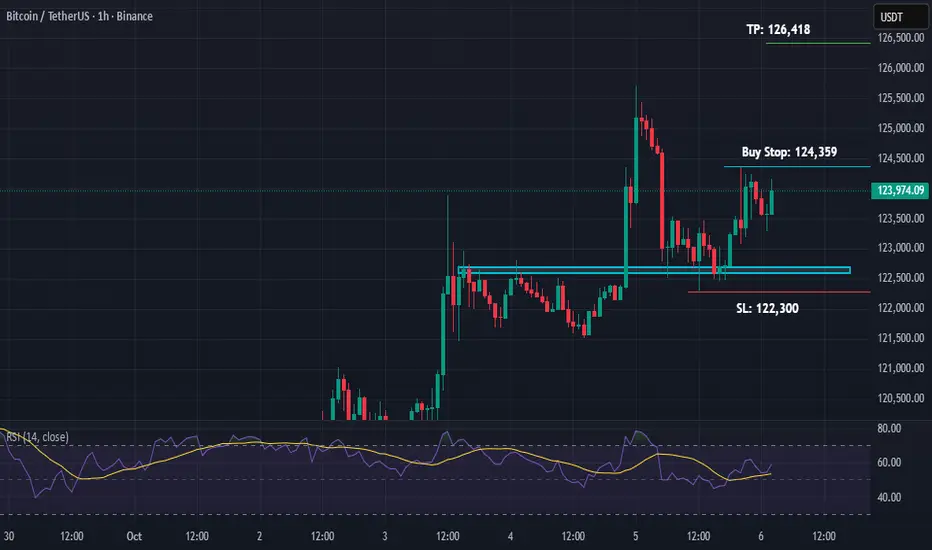
Entry price: 123300.
First target: 124050.
Second target: 125160.
Third target: 126774.
Don't forget a simple matter: capital management.
When you reach the first target, save some money and then change your stop-loss order to an entry order.
For inquiries, please leave a comment.
Thank you.
BTC market snapshotWe’ve reached a new high, and there’s still some room to grow — maybe up to 130K — but I’m maintaining a bearish bias and skipping long entries.
😱 Monthly timeframe divergence is getting stronger, signaling that the overall momentum is fading and the market is overheated.
😱 A rising wedge has formed — a classic trend reversal pattern.
😱 Recent data shows that smart money is selling while retail is buying (judging by gold charts, big players seem to be positioning there in anticipation of a dump).
😱 Social media sentiment is overheated, full of euphoria and belief in endless growth.
😱 The real chaos in the U.S. hasn’t even started yet — the economy is in trouble.
😱 There’s a strong imbalance in open interest.

BTCUSDT: Potential Reversal at Key Support👋Hello everyone, what do you think about the trend of BINANCE:BTCUSDT ?
Bitcoin is currently undergoing a short-term correction after forming a peak above $114,500. The price is now heading toward a key support zone around $110,000, which is also seen as an important confluence zone.
If Bitcoin stabilizes here and confirms the support level, we could see another potential bounce, pushing it back towards previous resistance levels. Pay attention to the possibility of a price reversal from this support zone, as it might create a buying opportunity.
What do you think about BTCUSDT? Let me know your thoughts in the comments below!
Good luck!

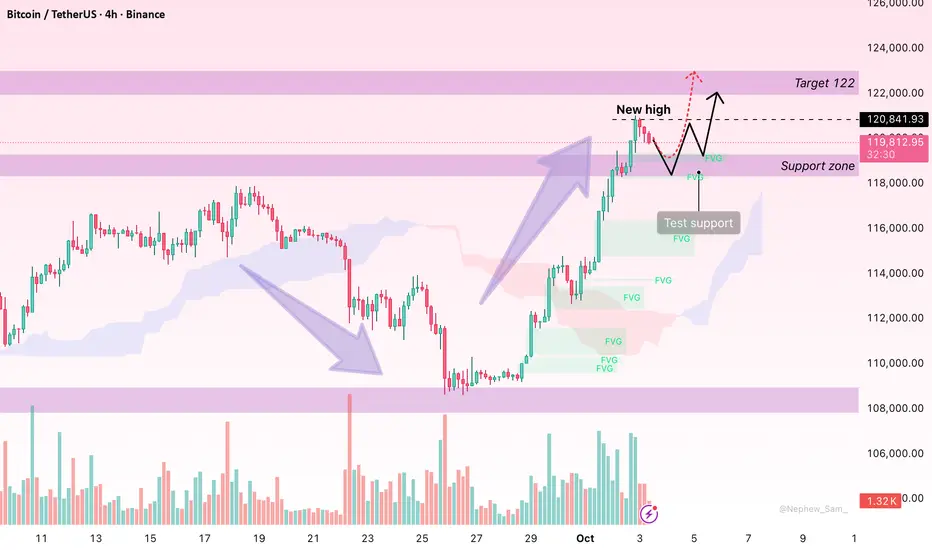
Bitcoin: Mild Pullback Before Eyeing Fresh HighsHello everyone, Bitcoin continues to capture attention after reaching a peak of 120,324 USD before easing slightly to around 119,793 USD. This pullback is viewed as a technical pause within a broader uptrend rather than a sign of reversal.
From a technical perspective, BTC remains above the Ichimoku cloud and is supported by FVG zones around 119,000–118,500 USD. Trading volume surged at the 120,000 USD level, highlighting strong institutional buying and reinforcing the bullish outlook.
On the news front, the US dollar is weakening due to the risk of a government shutdown, while capital inflows from ETFs and major institutions continue to flow into the market. Combined with the current low interest rate environment, Bitcoin increasingly stands out as an attractive safe-haven asset.
In the near term, Bitcoin is expected to hold support at 119,000–118,500 USD and rebound towards 122,000 USD, with extended targets at 125,000 USD and even 128,000 USD if momentum remains strong.
Only a break below 118,500 USD would open the door for a deeper correction towards 117,800–116,500 USD before recovery attempts resume.
What’s your view? Will BTC/USDT hold the line and move on to conquer 125,000 USD?
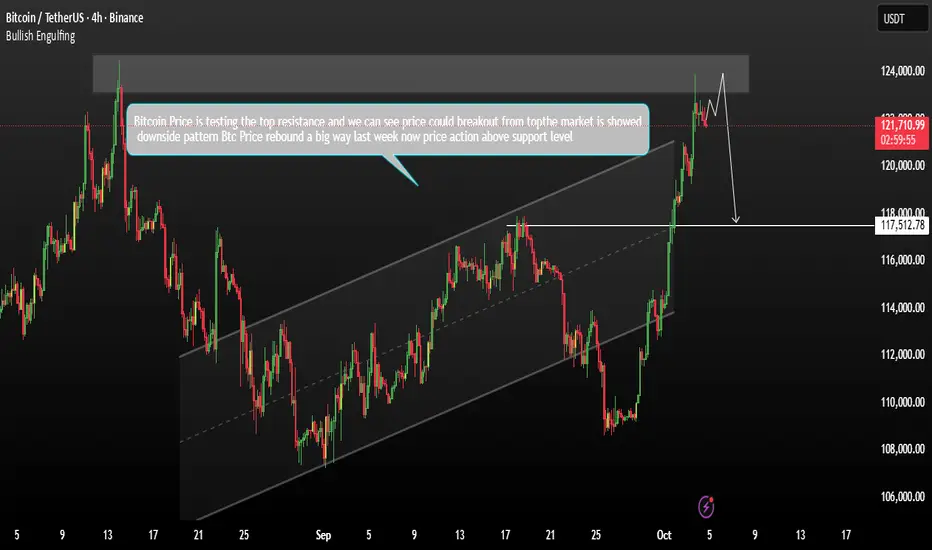
Bitcoin Showed Breakout zone from top SideBitcoin’s price is currently testing a new all-time-high zone and encountering strong resistance around 123,000. A false breakout has formed at this level, and the market has entered a phase of local consolidation.
Price action is now moving aggressively toward testing the uptrend support zone. While a retest of 123,000 cannot be completely ruled out, technical signals from Friday’s sell-off — including profit-taking and a long upper shadow on the daily candlestick — suggest that a medium-term correction is likely.
I expect Bitcoin to retrace toward the local break-even / imbalance zone near 117,500 before attempting another move to the upside.
You may find more details in the chart.
Trade wisely best of Luck Buddies.
Ps; Support with like and comments for better analysis Thanks for Supporting.
Bitcoin - October 4th '25This is what I see.
Includes:
50% rule implementation
Sentiment Evaluation (Personal)
Candle Patterning Evaluation (Personal)
FVG Structure
Local Support
Price Percentage Change
Enjoy!
Mr. Storm

Bitcoin: Healthy Corrections vs. Overextended RalliesIn my view, a truly healthy trend must include both upward moves and corrections. When Bitcoin rises too quickly without proper pullbacks, it often leads to sudden selling pressure.
For the update to my previous analysis, the new key support has formed at 119,613. If this level breaks, the next major support zone lies between 114,145 and 115,723.
⚠️ Keep in mind: this does not guarantee that Bitcoin will only find support in that zone—it could bounce earlier. However, this is the most important area to watch.
To maintain the overall bullish structure, Bitcoin must hold above 112,817.
On the other hand, if the price doesn’t fall below 119,613, it could signal strong buying power in the market. In that case, a period of consolidation (range-building) could provide the base for the next rally.
📈 A long setup above 122,799 would look attractive—but not at this moment. Waiting for confirmation is key.

Wait for 118k , then buy again (130k incoming )In my previous idea , when BTC was 113k , i published an Idea that BTC will hit 130k and people told me you are wrong . Now im telling you wait for 118k (wave 4) then buy again.
Analyzing Elliott's wave theory telling us that btc need some corrections and this is why price is started to fall.
