Forecast for BTCUSDT 13th October 2026 (Updated)Forecast for BTC for the next 4 weeks. Weekend/Monday pump to ~$120k followed by a decline to to ~$105k. Then market forms a bottoming before all time highs to ~$150k-$170k-$200k
BTCDOWNUSDT trade ideas

BTC Short Term OverviewBased on structure and Daily TF view BTC has more probability to retest 109K before than 118K, in fact I dont even expect 117.3K but a sweep and rejection around there is a high supply zone for now, not only a resistance zone (previous July daily box range low) but we have an 4H Bear gap + Prev Month High, golden supply zone for shorts
Based on this type of 4H PA I expect at minimum the 50% of the wick on the 4H liquidity candle to be fill, around there we have the Daily/Weekly MSB and support zone within 109 and 107 so could see a consolidation before going lower if so, in fact we can consider the whole 4H candle to be a range for now, the open of that candle has liquidity and supply so Im expecting to respect it
*Key zones here is to fill the CME Gap (111K-110K GAP on BTC1!), totally expecting it to be filled
Bullish panoramas starts at a reclaim and Hold of 118K

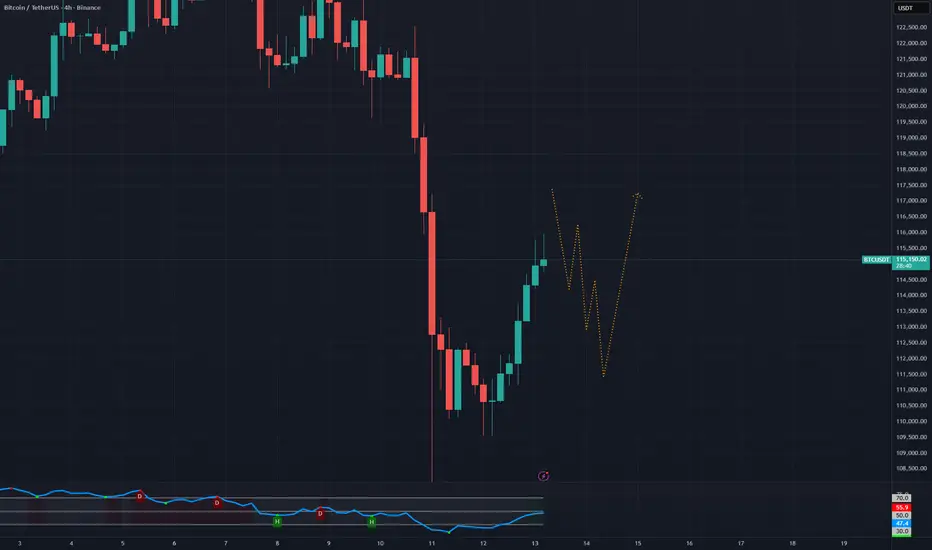
BTC Weekly Outlook (Oct 13 → Oct 20)After that brutal dump on Oct 10, BTC has been slowly reclaiming key levels — showing a short-term optimism across the market. It’s clear that many traders are buying the dip, thinking the crash was just a massive long squeeze after an overheated rally.
But personally, I don’t think it was just a long squeeze. It felt like a broader reaction to Trump’s sudden policy shift — something the market simply couldn’t price in fast enough. Both equities and crypto got hit hard by that shock, especially since everything had only recently stabilized after months of inconsistent policy moves under Trump’s return.
Looking at BTC, ETH, and internal money flow across the crypto market, I think we’re likely to see another short-term correction coming soon. Here’s why:
Profit-taking after the bounce:
The market just recovered from a deep dip — many short-term traders will likely take profits early, especially since the last BTC collapse still left a scar on most of them.
Stalled inflows:
The recent bounce didn’t come with major inflows. There’s been some recovery, but overall volume and liquidity seem to be slowing down.
Smart money behavior:
This bounce looks heavily driven by institutional/smart money. These players don’t gamble — they’ll wait to see how the market reacts next. If BTC drops again, expect them to pull back temporarily or rotate funds into BTC from alts (e.g., ETH).
Heavy resistance ahead:
BTC faces a major resistance zone at $116.8k – $117.5k. Breaking through that level will require a strong, high-volume push — not something easy to achieve right now.
Still, the weekly (W) timeframe remains healthy — momentum is intact, and overall this could still be viewed as a normal correction inside a larger bullish structure.
My take for the week (Oct 13 → Oct 20)
Price will likely attempt to push into the resistance zone above, but I expect at least one rejection bounce before any real breakout.
If that push fails, BTC might retest market sentiment around $114k, or in a more bearish case, down to $112k – $111.8k.
So this week, keep an eye on how price reacts near the upper resistance.
If we see a strong rejection, it’s worth considering short opportunities toward the lower zone — but be flexible with exits depending on how price reacts.
During the first half of the week, expect some choppy, whipsaw moves as bulls and bears fight for control.
After Oct 16, we’ll likely get a clearer short-term trend direction for the following week.
BTC short TermDear Traders,
i expect to reach 119,200 it can go more up little bit but a second dump can be cooking
im publishing this idea bcz a lot of ppl lost money and most of you follow the wrong ppl
market is green yes but fully manipulated

Bitcoin prediction.... Before bitcoin goes to higher levels price needs to retrace and we might start to see that from here on out...

BTC📊 BTCUSDT 4H Analysis – Key Reversal Zones
Bitcoin has shown a sharp recovery after a strong bearish impulse, bouncing from lower demand zones. The current move suggests a possible short-term corrective rally before facing significant resistance levels.
Potential Reversal Zones:
🔹 115,803.24 – First reaction area / potential intraday resistance.
🔹 117,494.52 – 118,572.76 – Key resistance range; watch for rejection signals here.
🔹 121,238.05 – Major resistance zone where strong selling pressure could appear.
If BTC continues to hold above 113,000, a push toward 118K remains likely. However, failure to sustain above current support could lead to a deeper retracement toward lower liquidity zones around 108K – 106K.
📈 Bias: Short-term bullish correction within a larger bearish trend.
🕓 Timeframe: 4H

Breakout Or Breakdown?Price has recently shown signs of bullish intent after a clear CHoCH (Change of Character), breaking above previous lower highs. This shift suggests potential accumulation following the BOS (Break of Structure) to the downside earlier.
Key Levels:
Resistance (R) Zone: Currently testing this supply area. A strong close above could confirm continuation.
Support Zone: Below, previous demand and BOS zone, likely to act as support if price rejects.
Bullish Scenario:
A clean breakout and retest of the resistance zone could open up a push towards higher targets, confirming bullish momentum.
Bearish Scenario:
If price rejects strongly from resistance, we may see a return to the lower support zone and potentially break it to reach the lower target.
Watch for confirmation before entering, and manage risk accordingly.

Interesting fact almost every huge wick #BTC on Binance Futures Interesting fact almost every huge wick #BTC on Binance Futures is retested
Double top in 15 min failed higher high , sell under the necklinDouble top in 15 min failed higher high , sell under the neckline

BTC 1D AnalysisBitcoin is still at the support of Up trendline on daily timeframe. Hopes are still alive.
Also we can say it is on the support zone. If you wish to take trade on any side please confirm it on 4H once.

btc idea We had a great run since Nov 2022 when wave 2 bottomed. Wave 3 delivered a massive rally, peaking near 109k.
Since then, I’ve been tracking wave 4:
Wave A bottomed ~75k
Wave B rallied us to the 124k rejection right at the 0.618 fib
This rally wasn’t impulsive but corrective (classic Wave B overshoot).
⚠️ If BTC loses 110k on 1D, the probability for a sharp Wave C massively increases → target 66-68k.
From there, Wave 5 could unfold with a brand new rally. 🚀

rsi and mfi divergence on weakly chart I see a positive divergence on the weekly Bitcoin chart and from my point of view this has happened at the perfect time
The market is filled with panic and fear, and we have already fallen enough
And always when fears and panic increase, the rising wave comes

Forecast for BTCUSDT 12th October 2026 (Updated)Forecast for BTC for the next 4 weeks. Weekend/Monday pump to ~$115k followed by a decline to to ~$107k followed by a bullish counter-trend pump to ~$120k.
Counter-trend pump then gets exhausted then back down to ~$102k-103k for a bottoming before all time highs to ~$150k-$170k-$200k

Crystal ball into BitcoinI'm predicting not only the price but also the date Bitcoin is going to reach 100,000
Bitcoin will reach $100,000 exactly 5 weeks from now on around 20th of November.
Look at the chart. It is respecting the trend line and also the first time cycle which I have drawn. It has happened twice before and the next predicted date is 25th of November.

BTCUSDT up to 17400-17800 as response to last declineI am waiting an incline to 117400-117800 as response to last decline within 5 days. But after that will be whatching the the finacial and the political environment with my finger on the key. BTC will have to do ıts best till the end of October (Last rocket to 135000 -14000 etc) and the beginning of November especially in November I am vaiting a deep correction to 93000 BTC

Btc ABCD harmonic 50-200Posted yesterday about a bullish shark harmonic I was looking at, as someone who is interested in harmonics I've been widening my search for other harmonics on the chart and have now come up with a bearish ABCD.
When I say bearish, the D point is around the $144,xxx area, my theory being that the bullish shark harmonic closes the CME gap which is the golden pocket of the ABCD.
This isn't financial advice, this is just my thoughts........

Inside the descending channelIt is starting to look better again for BTCUSD. A break through the upper side of this channel will be bullish.

BTC likely scenario is to re-test the 120K USD BTC will likely restest the upper trend line (~120k) while ETH will make a new All time High in
coming 2/3 weeks.
NOTE: the longer BTC hang 110k range the stronger will be the ALT season.
Scenario1:
BTC will likely establish itself above 120k (for 2 week) we will se a three week ALT season.
Scenario2:
If BTC get rejected at 120k ETH will consolidate at 4000-5000 range while other ALT have to wait for ALT season or ALT will rise for momentarily only.
BTC: 145,000-170000$ would be a good exit
ETH: 8000-14000$
ADA: 7-13$
NOTE: MISAKENLY wrote 20k on chart, Correction it is 120k

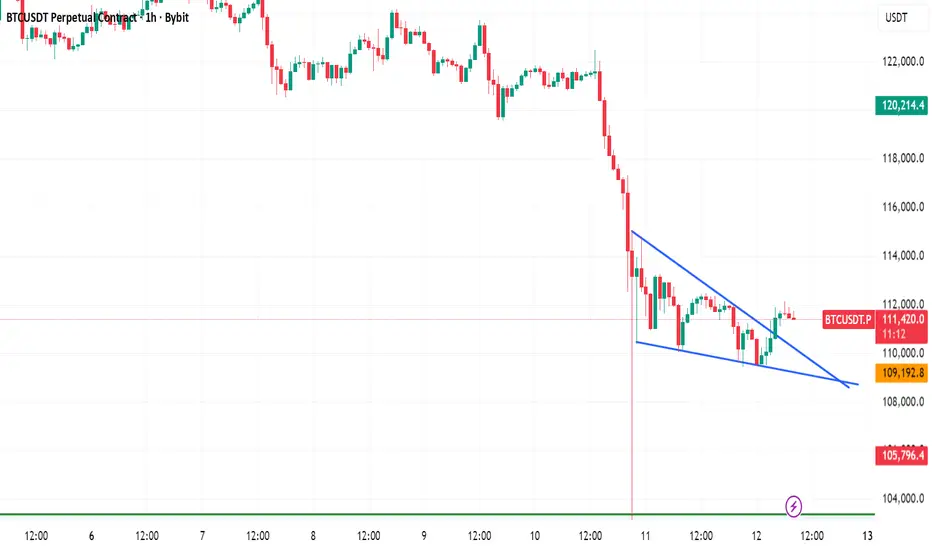
BTC analysis#BTC After the recent significant price drop, a falling wedge pattern has formed on lower time frames, which has now been broken. We could see some upward movement if the price stays above the $111,000 level. However, the market remains uncertain, and there could be a major decline if the price closes below the $110,000 level.
Btc after the crashEvery time Btc price taps this ancient uptrend it gets messed up - This time it's prevented the candles from hitting the top of the channel in blue - Its hard to say what will happen now after the flash crash, it seems major hands took profit and this may be a warning - If things can flip bullish again i could see Eth getting a short run to 5.2k area and the small alts pump, after seeing Zec and Dash move so well, even during the crash, it feels like theres still life in the market and hopefully now the big alts have moved the small alts will get the action next -
For this to happen Btc price has to stall around here, get above support and crab sideways giving the alts room -
Ultimately I think its possible Btc top price is already in, the candles should still rally and hit the top of the 5th arc again though - Most important thing is they mustn't loose ascending support of the Gann 1x1 fib ray in red, failing that would see the price bounce down the fibs eventually seeking the red Gann 8x1 fib at the bottom of the chart -
Required to turn me bullish would be Btc candles breaking thru the 5th arc and heading for the 200% fib or even better breaking the ancient uptrend, if that were to happen it would likely send the price parabolic

Forecast for BTCUSDT 12th October 2026 (Updated)Forecast for BTC for the next 4 weeks. Weekend/Monday pump to ~$115k followed by a decline to to ~$107k followed by a bullish counter-trend pump to ~$120k.
Counter-trend pump then gets exhausted then back down to ~$102k-103k for a bottoming before all time highs to ~$150k-$170k-$200k

BTCUSDT
📉 Bitcoin Analysis – Bearish Focus
English:
Bitcoin is approaching a critical support level at $100,000. If this level fails to hold, the market may face a strong corrective move. Potential downside targets are:
$65,000 – first major support
$45,000 – secondary support
$10,000 – worst-case scenario if panic selling accelerates
Volume and momentum indicators suggest increasing pressure on the bulls. Traders should be cautious and consider risk management strategies, especially if $100K support is broken.
Key Points:
$100K is a crucial psychological and technical support
Breaking this level may trigger rapid liquidation
Watch for confirmation before taking long positions
---
فارسی (ترجمه):
بیتکوین در حال نزدیک شدن به سطح حمایت کلیدی ۱۰۰,۰۰۰ دلار است. اگر این حمایت حفظ نشود، بازار ممکن است با یک حرکت اصلاحی شدید مواجه شود. اهداف نزولی احتمالی:
۶۵,۰۰۰ دلار – اولین حمایت مهم
۴۵,۰۰۰ دلار – حمایت ثانویه
۱۰,۰۰۰ دلار – سناریوی بدبینانه در صورت تشدید فروش هیجانی
شاخصهای حجم و مومنتوم نشاندهنده افزایش فشار روی خریداران هستند. معاملهگران باید محتاط باشند و استراتژی مدیریت ریسک داشته باشند، مخصوصاً اگر حمایت ۱۰۰K شکسته شود.
نکات کلیدی:
۱۰۰K یک حمایت روانی و تکنیکال حیاتی است
شکست این سطح ممکن است منجر به لیکویید شدن سریع پوزیشنها شود
قبل از ورود به پوزیشنهای لانگ، منتظر تأیید باشید

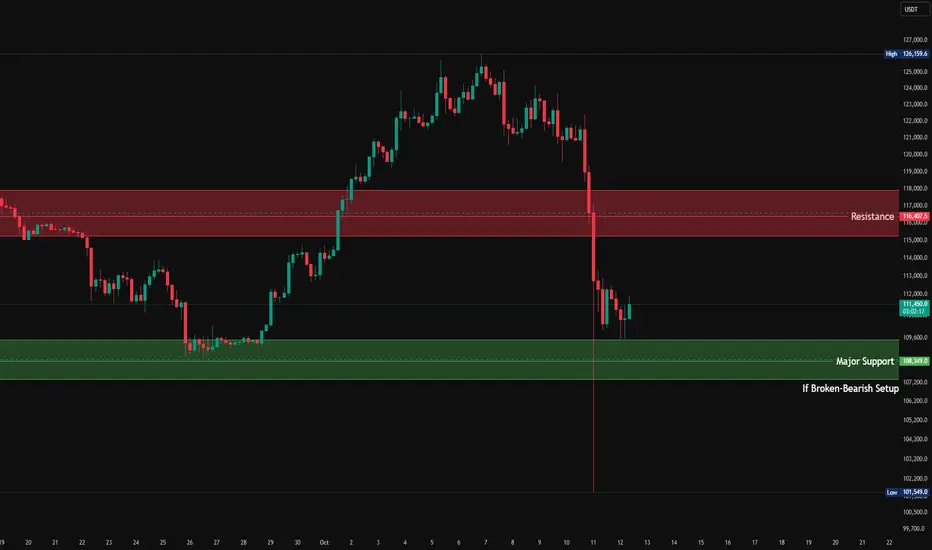
BTC Price Overview from 19Oct till 26Oct or Oct MonthCOINBASE:BTCUSD CRYPTO:BTCUSD KRAKEN:BTCUSD GEMINI:BTCUSD BINANCE:BTCUSD BINANCE:BTCUSDT.P BYBIT:BTCUSDT.P BYBIT:BTCUSD.P OKX:BTCUSDT.P MEXC:BTCUSDT.P BITGET:BTCUSDT.P BINANCE:BTCUSD.P DELTAIN:BTCUSD.P BINGX:BTCUSDT.P BITMEX:BTCUSD.P DERIBIT:BTCUSD.P KRAKEN:BTCUSD.P COINBASE:BTCUSDC.P
COINBASE:USDTUSD KRAKEN:USDTUSD
🧭 General Overview
Timeframe: 4H
Asset: USDT-BTC
Current Price: ≈ 111,300 USDT
Major Resistance Zone: 116,000–116,400 USDT
Major Support Zone: 108,000–108,350 USDT
Recent High: 126,159 USDT
Recent Low: 101,549 USDT
Price recently rejected from the resistance zone after a strong breakdown, suggesting momentum has turned bearish in the short term.
🧩 Structure & Key Zones
1️⃣ Resistance Zone: 116,000–116,400 USDT
This zone acted as previous support that broke down sharply.
On retest, it now serves as major supply/resistance.
A strong bearish candle initiated from this zone, showing seller dominance.
📉 Expect:
Sellers to re-enter aggressively if price tests this level again.
A lower high formation below 116K = confirmation of short-term bearish bias.
2️⃣ Support Zone: 108,000–108,350 USDT
This is a major demand area, visible from the past bounce.
Price has wicked into it but hasn’t closed below yet — buyers are still defending.
⚠️ If this zone breaks (close below 108K):
Opens room for a deeper correction toward:
106,200 → 103,000 → 101,500 (recent swing low)
📅 Next Week’s Outlook
🔹 Bullish Scenario (Short-Term Relief Rally)
If price holds above 108K and breaks above 112K, we could see:
Short-term bounce toward 114.5K–116K (Resistance Retest)
Watch for rejection candles or weakening momentum there.
Suitable for short-term scalp longs, but risky for swing trades due to strong overhead supply.
🔹 Bearish Scenario (Primary Bias)
Given:
Strong downtrend continuation
Failed recovery attempts
Rejection from prior demand turned supply zone (116K)
If 108K fails, expect:
Acceleration to 105K–102K
Possible overshoot wicks below 101.5K before consolidation or reversal attempt.
Bearish targets for next week (if breakdown occurs):
TP1 → 106,200
TP2 → 103,000
TP3 → 101,500
🕐 Short-Term Perspective (Next 24–72 Hours)
Price is currently consolidating sideways between 111K–108K.
Watch for a range break:
Above 112K → short-term bullish relief
Below 108K → confirmation of bearish continuation
Volume and candle body analysis suggest that sellers are stronger, but buyers are still defending 108K strongly.
🔍 Key Takeaways
The trend is bearish, but we’re at critical support.
Watch 108K closely — it’s the line between correction & collapse.
Any bounce toward 114–116K is likely a sell opportunity.
A breakdown below 108K opens path toward the 100–102K zone.