BTCUSDT.P 4H Binance - Little update on pullback ideasBTC 4H update. Hate to be a party booper but BTC could make some sweeps lower. TDI X in the middle with lower BB still bullish so I think this pullback is short lived. Price breakdown and tested pink POC level and failed to claim back.
Probably heading for next support level of 0.382 fib and SR flip zone. Below that zone is safe and secure fib zone with added support on the edge of 8H FVG, expecting the sweep penetrating it close to 50 % level of that FVG. Hopefully last frontier for pivot reversal to new price discoveries like a USS Enterprise with warp speed in to deep space nine.
There is that weekly open FVG which is haunting with 8H FVG so lets see does market maker accountants balance the sheets. It could mean decent 10-20% pullback on ALTS.
That tiny pullback would mean again chaos and panic in social media. I think those are the over leveraged casino players, not us of course.
Trade ideas

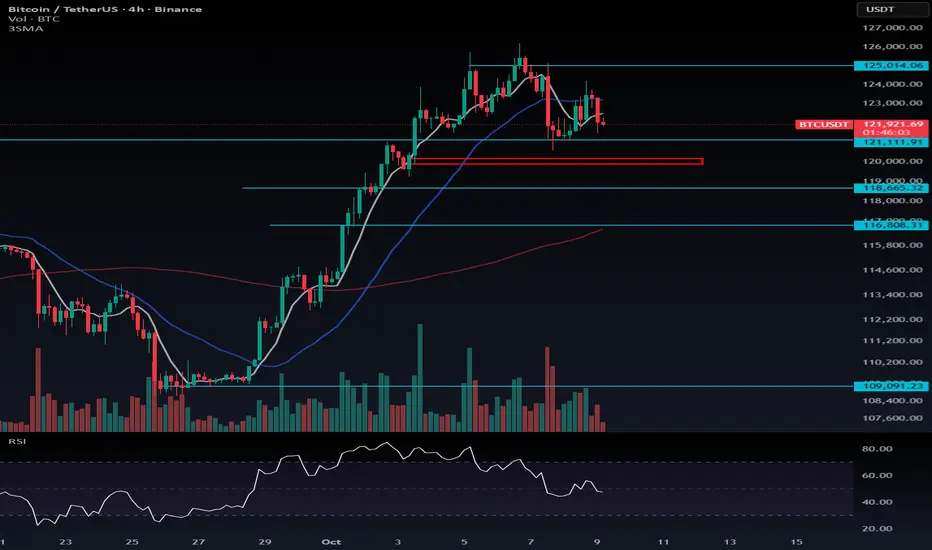
Bitcoin Liquidity Sweep and Potential Fakeout ScenarioThere’s a liquidity zone around $120,509, and once this level is taken out, the price could drop toward the $119,898–$120,150 range.
If Bitcoin sweeps that liquidity and then bounces back above, it would confirm the fakeout scenario I mentioned earlier — a bullish signal suggesting the continuation of the uptrend.
However, if BTC fails to recover after the sweep, the corrective move could extend further down toward the $118,665 support zone.
📉 Short Setup:
You can consider short positions if $120,111 breaks, but in my opinion, it’s better to enter slightly before the breakout, as the move could be sharp and quick.
📈 Long Setup:
The next strong long opportunity remains above $125,000.
If BTC Dominance starts printing green candles, it’s better to focus your short trades on altcoins, as they may show higher volatility and downside potential.
Exchange Rate StrategiesIntroduction
Exchange rates play a central role in international economics, influencing trade balances, capital flows, inflation, and monetary policy. The exchange rate refers to the price of one currency in terms of another — a measure of how much one nation’s money is worth compared to another’s. It affects every aspect of an open economy: from exporters and importers to investors, policymakers, and consumers. Therefore, the management of exchange rates — known as exchange rate strategies — is one of the most crucial components of economic policy.
Countries adopt various exchange rate strategies depending on their economic goals, structural conditions, and level of integration with the global economy. Some nations prefer fixed exchange rates to maintain stability, while others choose floating systems to allow market forces to determine currency values. Between these two extremes lie hybrid or managed systems designed to balance stability and flexibility.
This essay explores the different exchange rate strategies, their mechanisms, advantages and disadvantages, the rationale behind policy choices, and their implications for economic performance and global financial stability. It also examines the evolution of exchange rate regimes in both developed and developing economies, including contemporary challenges like currency wars, speculative attacks, and digital currency impacts.
1. Understanding Exchange Rates
1.1 Definition and Importance
An exchange rate determines how much one currency can be exchanged for another. For example, if 1 U.S. dollar equals 83 Indian rupees, the exchange rate is 1 USD = ₹83. Exchange rates affect:
Trade Competitiveness: A stronger domestic currency makes exports more expensive and imports cheaper.
Inflation: A depreciating currency raises import prices, leading to inflationary pressures.
Investment Decisions: Investors seek markets with stable currencies and predictable returns.
Monetary Policy Transmission: Exchange rates influence interest rates, money supply, and economic growth.
1.2 Determinants of Exchange Rates
Key factors influencing exchange rate movements include:
Interest Rate Differentials – Higher interest rates attract foreign capital, leading to currency appreciation.
Inflation Rates – Countries with lower inflation typically experience currency appreciation.
Current Account Balances – Persistent deficits weaken a currency, while surpluses strengthen it.
Political Stability and Economic Performance – Confidence in governance and growth prospects attracts investment.
Speculation – Traders’ expectations can drive short-term currency fluctuations.
2. Types of Exchange Rate Strategies
Exchange rate strategies can be broadly divided into three categories: fixed, floating, and hybrid (intermediate) regimes.
2.1 Fixed Exchange Rate Strategy
Mechanism
Under a fixed exchange rate system, a country’s currency value is tied (“pegged”) to another major currency such as the U.S. dollar or a basket of currencies. The central bank intervenes in the foreign exchange market to maintain the target rate.
Examples
The Hong Kong dollar is pegged to the U.S. dollar at around HK$7.8 = US$1.
The Gulf Cooperation Council (GCC) countries peg their currencies to the dollar to stabilize oil revenues.
Advantages
Stability and Predictability: Businesses can plan international transactions without fear of volatile currency swings.
Inflation Control: Pegging to a stable currency can help import monetary discipline.
Investor Confidence: Predictable exchange rates attract foreign investors.
Disadvantages
Loss of Monetary Independence: Domestic monetary policy is constrained to maintain the peg.
Speculative Attacks: Fixed regimes are vulnerable if markets perceive the peg as unsustainable.
External Shocks: The economy becomes sensitive to fluctuations in the anchor currency.
Case Study: The Bretton Woods System
After World War II, the Bretton Woods Agreement (1944) established a system of fixed exchange rates where the U.S. dollar was pegged to gold, and other currencies were pegged to the dollar. It created post-war economic stability but collapsed in 1971 when the U.S. suspended the dollar’s convertibility into gold due to inflationary pressures and trade imbalances.
2.2 Floating Exchange Rate Strategy
Mechanism
In a floating exchange rate system, currency values are determined by market forces — the supply and demand for currencies in foreign exchange markets. Central banks do not fix or peg the rate, though they may occasionally intervene to curb volatility.
Examples
The U.S. dollar, euro, Japanese yen, and British pound are under floating regimes.
Advantages
Monetary Policy Independence: Central banks can adjust interest rates freely to target inflation or growth.
Automatic Adjustment: Trade imbalances adjust naturally through currency movements.
Resilience to External Shocks: The exchange rate acts as a buffer against global volatility.
Disadvantages
Volatility: Exchange rates may fluctuate widely, affecting trade and investment.
Uncertainty: Businesses face exchange risk, increasing hedging costs.
Speculative Flows: Short-term capital movements can destabilize markets.
Case Study: The U.S. Dollar System
Since the 1970s, the U.S. has maintained a floating exchange rate. This system allows the Federal Reserve to pursue independent monetary policies but sometimes results in large currency fluctuations affecting trade competitiveness.
2.3 Managed Floating (Hybrid) Strategy
Mechanism
A managed float or dirty float combines market determination with occasional government intervention. Central banks may buy or sell currencies to smooth excessive volatility or maintain competitiveness without a strict target.
Examples
India, China, and Singapore follow managed floating regimes.
The People’s Bank of China allows the yuan to move within a set band around a reference rate.
Advantages
Flexibility with Stability: Allows adjustment to shocks while avoiding extreme volatility.
Competitiveness: Authorities can influence the exchange rate to support exports.
Policy Balance: Combines elements of autonomy and stability.
Disadvantages
Lack of Transparency: Market participants may find policy motives unclear.
Limited Discipline: Interventions can delay necessary adjustments.
Potential for Manipulation: Other countries may accuse managed regimes of currency manipulation.
3. Factors Influencing Exchange Rate Strategy Choice
Countries choose their exchange rate strategies based on multiple economic and political factors.
Economic Structure:
Open economies dependent on exports (e.g., Singapore) may prefer stable or managed rates.
Large economies (e.g., the U.S., Japan) favor floating rates.
Inflation History:
Nations with a history of high inflation may peg to a stable currency to build credibility.
Financial Market Development:
Advanced markets can handle floating rates, while emerging markets may need managed systems.
Capital Mobility:
With free capital flows, maintaining a fixed rate becomes challenging (as per the “impossible trinity” principle).
Political Considerations:
Governments may prefer stable exchange rates for political stability and investor confidence.
4. The Impossible Trinity (Trilemma)
A central theory in exchange rate economics is the impossible trinity, or Mundell-Fleming trilemma, which states that a country cannot simultaneously achieve:
A fixed exchange rate,
Free capital mobility, and
Independent monetary policy.
A nation can only choose two out of three. For instance:
A fixed rate + free capital flow requires surrendering monetary policy (e.g., Hong Kong).
A floating rate + free capital flow allows monetary independence (e.g., the U.S.).
A fixed rate + monetary independence requires capital controls (e.g., China).
This trade-off explains why exchange rate strategies differ globally.
5. Exchange Rate Policy Tools
Central banks employ several instruments to implement their chosen strategies:
Foreign Exchange Intervention:
Buying or selling foreign currencies to influence the rate.
Interest Rate Policy:
Adjusting domestic interest rates to attract or repel capital flows.
Capital Controls:
Restricting cross-border capital movements to maintain stability.
Foreign Reserve Management:
Accumulating reserves to defend against volatility or speculative attacks.
Communication and Forward Guidance:
Managing market expectations through official statements.
6. Exchange Rate Strategies in Practice
6.1 Developed Economies
The U.S., UK, Eurozone, and Japan largely follow floating regimes.
The European Central Bank (ECB) manages a shared currency (the euro), emphasizing stability within the Eurozone.
Japan’s frequent interventions (e.g., yen weakening) show that even floating systems are occasionally managed.
6.2 Emerging Economies
China employs a managed float tied loosely to a basket of currencies.
India follows a flexible inflation-targeting framework with periodic interventions to avoid sharp rupee movements.
Brazil, South Africa, and Indonesia adopt hybrid systems balancing stability and autonomy.
6.3 Dollarization and Currency Boards
Some nations abandon independent currency management altogether:
Ecuador, El Salvador, and Panama use the U.S. dollar.
Hong Kong operates a currency board, fully backing its money supply with foreign reserves.
These strategies provide credibility and stability but at the cost of policy flexibility.
7. Challenges in Managing Exchange Rate Strategies
Global Capital Flows: Sudden inflows or outflows can disrupt stability.
Speculative Attacks: Overvalued pegs attract speculative pressure (e.g., 1997 Asian Financial Crisis).
Currency Wars: Competitive devaluations can trigger trade tensions.
External Shocks: Commodity price swings and geopolitical crises impact currency performance.
Digital Currencies and Crypto-assets: The rise of cryptocurrencies challenges traditional exchange rate control mechanisms.
8. Case Studies of Exchange Rate Strategy Outcomes
8.1 The Asian Financial Crisis (1997)
Many East Asian economies maintained fixed or semi-fixed exchange rates pegged to the U.S. dollar. When investors lost confidence due to large current account deficits and excessive short-term debt, massive capital flight occurred. Countries like Thailand, Indonesia, and South Korea were forced to devalue their currencies, leading to deep recessions. The crisis highlighted the risks of rigid exchange rate commitments amid open capital markets.
8.2 China’s Managed Exchange Rate System
China’s exchange rate policy has evolved from a strict peg to a managed float. By maintaining a relatively undervalued yuan for years, China boosted exports and industrial growth. However, global criticism of “currency manipulation” led to gradual liberalization. Today, the yuan’s value is guided by a reference rate within a limited daily band, reflecting both market forces and state control.
8.3 The Eurozone Experience
The Eurozone represents a unique fixed exchange rate system — a monetary union. Member states share a common currency and monetary policy but retain independent fiscal policies. This setup offers stability but can cause imbalances, as seen in the European debt crisis (2010–2012), where weaker economies like Greece couldn’t devalue their currencies to restore competitiveness.
9. Modern Developments in Exchange Rate Management
9.1 Floating with Inflation Targeting
Many central banks now combine floating exchange rates with inflation targeting. For instance, the Reserve Bank of India (RBI) targets inflation around 4%, using exchange rate flexibility as a stabilizer.
9.2 Role of Derivatives and Hedging
The growth of financial markets has introduced instruments like futures, forwards, and swaps to manage currency risk. Corporates and investors use these tools to hedge against volatility, complementing official exchange rate policies.
9.3 Central Bank Digital Currencies (CBDCs)
The introduction of digital currencies may reshape exchange rate dynamics by altering cross-border payments, capital mobility, and monetary control mechanisms. Central banks worldwide, including the RBI and PBOC, are exploring digital currency frameworks.
10. Conclusion
Exchange rate strategies lie at the heart of global financial stability and economic performance. The choice of an exchange rate regime reflects a delicate balance between stability, flexibility, and sovereignty. While fixed systems offer predictability and control, they expose economies to speculative pressures and loss of autonomy. Floating regimes allow market efficiency and independent policy-making but come with volatility and uncertainty. Managed floats, the most common modern arrangement, attempt to blend the best of both worlds.
In the era of globalization, where capital flows and digital finance transcend borders, no exchange rate strategy remains permanently optimal. Countries must adapt dynamically, ensuring that their policies support long-term growth, competitiveness, and resilience against global shocks. The evolution of exchange rate strategies — from Bretton Woods to blockchain — illustrates the ongoing quest for balance between economic discipline and financial freedom in an interconnected world.
DXY, EUR/USD, GBP/USD, and Bitcoin Daily Analysis for 08/10/2025DXY has shown a relative short term retracement which will affect the price delivery for EU, GBP and btc click to find out our next bias

BTCSmaller time frame looks scary but when you zoom out looks like we are holding just fine.and with gold (potentially peaking ) the rotation is near.

BITCOINCRYPTOCAP:BTC is currently trading in a rising wedge, a classic bearish reversal pattern. Not too concerned though, as Bitcoin has historically invalidated multiple rising wedges before. Target sits around $169K if momentum continues to hold strong.

BTCUSDT.P 1H update about the dip - expecting more downsideCRYPTOCAP:BTC update. Super convinced that more pullback is coded.
We get confirmation soon in few hours if 4H or 8H FVGs acts as resistance. Expecting more likely to make another sweep in to 8H FVG below.
We are talking a very small dip but it will again destroy and shake most of the ALTS positions. Again and again. I can't keep up the count for the last 2 months.
For degens, this is good buy the dip opportunity. Too risky for me. Stay SAFU!

Very important Bitcoin will soon reach the 41k areaVery important Bitcoin will soon reach the 41k area

BTCUSDT StructureBUCUSDT has continued its valid upward move. The price successfully broke above the descending trendline and reclaimed a key resistance zone, indicating bullish momentum.
Currently, the price is encountering resistance near the 120 level, which is acting as a short-term barrier. A minor pullback toward the recently broken structure is expected. If this area holds as support, the price is likely to resume its upward trend, potentially breaking the previous high.
As long as the price remains above the key support level, we can expect the next major resistance to be around the 120K level.

Emerging Markets Exploding1. Understanding Emerging Markets: The Powerhouses in the Making
Emerging markets are economies that are transitioning from developing to developed status. They are characterized by:
Rapid GDP growth
Expanding industrial and service sectors
Rising foreign investments
Improving infrastructure and governance
The International Monetary Fund (IMF) identifies more than 20 major emerging economies, including India, China, Brazil, Mexico, Turkey, Indonesia, Thailand, South Africa, and Malaysia. Collectively, these countries represent over 50% of global GDP (PPP terms) and are home to nearly 85% of the world’s population.
Their growth trajectory is remarkable — between 2000 and 2024, emerging markets contributed over 70% of global economic expansion. This dominance is set to deepen in the coming decades.
2. The Core Engines Driving the Explosion
a. Demographic Dividend
One of the most powerful growth levers is the young and expanding population.
India, for example, has a median age of just 28, compared to 39 in the U.S. and 48 in Japan.
Africa’s population is expected to double by 2050, creating a vast labor pool and consumer base.
This youth-driven energy fuels entrepreneurship, consumption, and technological adoption — key catalysts for explosive economic growth.
b. Digital Transformation
The digital revolution is democratizing opportunities. From mobile banking in Kenya to digital ID systems in India, technology is bypassing traditional infrastructure limitations.
India’s UPI system handles more than 12 billion monthly transactions, revolutionizing financial inclusion.
Indonesia’s e-commerce sector is expected to cross $100 billion by 2025.
Emerging markets are becoming testbeds for innovation — and often exporting those innovations globally.
c. Industrial Shift and Supply Chain Realignment
Global companies are diversifying away from China, giving rise to the “China+1 strategy.” Nations like Vietnam, Mexico, and India are absorbing this manufacturing shift.
This has led to massive infrastructure development and FDI inflows.
Vietnam’s exports surged by over 250% in a decade, largely due to electronics manufacturing.
India’s “Make in India” initiative has attracted global giants like Apple, Samsung, and Tesla.
d. Financial Market Maturity
Emerging nations have reformed capital markets, improved transparency, and opened doors for global investors.
The MSCI Emerging Markets Index now captures some of the most dynamic companies globally — including Taiwan Semiconductor, Infosys, and Tencent.
Private equity and venture capital flows into emerging markets have more than tripled since 2010, showing growing global confidence.
3. Regional Growth Hotspots: The Epicenters of the Boom
a. Asia – The Economic Supercontinent
Asia remains the beating heart of the emerging market explosion.
India is now the fastest-growing major economy, expanding at over 7% annually.
Vietnam, Indonesia, and Bangladesh are rapidly industrializing.
China, despite maturing, continues to play a vital role in regional supply chains.
These nations are integrating trade through platforms like RCEP (Regional Comprehensive Economic Partnership), forming the largest free-trade bloc in the world.
b. Africa – The Next Billion Consumers
Africa is the world’s youngest continent, brimming with untapped potential.
With 1.5 billion people, it’s expected to add another billion by 2050.
The African Continental Free Trade Area (AfCFTA) is unlocking intra-African commerce.
Nations like Nigeria, Kenya, and Egypt are emerging as fintech and startup powerhouses.
Africa’s future lies in transforming its natural resource wealth into manufacturing and service-sector growth.
c. Latin America – Resources and Reform
Latin America’s story is evolving beyond commodities.
Brazil and Mexico are expanding tech and renewable energy sectors.
Chile and Argentina are becoming critical in the global lithium race, vital for EV batteries.
While political volatility remains a concern, institutional reforms and trade partnerships are gradually stabilizing the region.
4. Investment Flows and Opportunities
Global investors are reallocating capital to capture emerging market potential.
According to the World Bank, FDI into emerging economies crossed $1.2 trillion in 2024, with a strong tilt toward manufacturing, clean energy, and technology.
Top sectors attracting global investors:
Renewable Energy: Solar, wind, and hydro projects across Asia and Africa.
Technology and AI: Startups leveraging AI for finance, healthcare, and logistics.
Consumer Markets: Expanding middle-class populations driving demand for goods and services.
Infrastructure: Roads, ports, data centers, and smart cities reshaping economic connectivity.
For investors, the long-term opportunity lies not just in growth rates but in structural transformation — the shift from low-income to middle-income economies.
5. Challenges Amid the Explosion
Despite the optimism, emerging markets face significant hurdles that could slow or disrupt progress:
a. Political Instability and Governance
Frequent policy changes, corruption, and weak institutions can deter long-term investment.
Examples include currency crises, sudden taxation shifts, and populist economic policies.
b. Debt Burdens and Currency Volatility
Many emerging markets borrowed heavily during low-interest eras. Rising global rates have increased debt servicing costs.
Currencies like the Turkish lira and Argentine peso have seen steep devaluations, testing investor confidence.
c. Income Inequality
Rapid growth often benefits urban elites while rural and informal sectors lag behind. Social inequality can spark unrest, threatening stability.
d. Environmental Pressure
Industrial growth comes with rising pollution and resource depletion. Balancing economic expansion with sustainability is crucial for long-term resilience.
6. The Role of Technology and Innovation
Technology isn’t just enabling growth — it’s redefining it.
Fintech: Africa’s M-Pesa and India’s Paytm have revolutionized mobile banking.
EdTech & HealthTech: Startups are providing education and healthcare to millions without traditional infrastructure.
AI & Automation: Emerging economies are building data-driven ecosystems to boost productivity.
By leapfrogging legacy systems, emerging markets are crafting new economic models — decentralized, digital-first, and inclusive.
7. The Global Impact: Power Shift in Progress
The explosion of emerging markets is transforming global power structures.
Trade Power: South-South trade (emerging nations trading among themselves) now accounts for over 30% of global commerce.
Financial Power: The BRICS nations (Brazil, Russia, India, China, South Africa — now joined by others) are building alternative financial frameworks like the New Development Bank.
Geopolitical Power: Emerging markets are asserting influence in global forums like the G20, WTO, and UN.
This shift marks the beginning of a multi-polar economic order — one not dominated by the West, but shared among diverse, dynamic nations.
8. The Road Ahead: Forecasts for 2030 and Beyond
Experts predict that by 2035, emerging markets will account for nearly two-thirds of global GDP.
India is projected to become the third-largest economy after the U.S. and China.
Africa’s GDP could double within 15 years.
Southeast Asia’s digital economy is expected to cross $1 trillion by 2030.
However, sustainable progress depends on:
Strengthening governance and institutions.
Deepening regional integration.
Investing in education, infrastructure, and innovation.
Emerging markets are no longer “the future” — they are the present and the driving force of the next global economic chapter.
Conclusion: The Rise of the New Titans
The explosion of emerging markets is reshaping the architecture of the global economy. These nations are not merely catching up — they’re creating their own pathways, driven by demographic strength, digital disruption, and resource innovation.
While challenges remain, the momentum is undeniable. The next century will not be defined by a handful of Western economies but by a mosaic of emerging powers across Asia, Africa, and Latin America.
For investors, policymakers, and entrepreneurs, this is a historic inflection point — one that demands vision, agility, and a willingness to engage with the new frontiers of growth.
In every sense, emerging markets are exploding — and the world will never be the same again.
The Great Global Currency ResetChapter 1: The Roots of a Reset — How We Got Here
To understand why a global reset is even on the table, we must trace the evolution of the international monetary system.
1. The Bretton Woods System (1944–1971)
After World War II, world leaders met in Bretton Woods, New Hampshire, to establish a new financial order. The U.S. dollar was pegged to gold at $35 per ounce, and other currencies were pegged to the dollar. This made the dollar the world’s reserve currency, giving the U.S. unmatched power in global trade and finance.
However, as U.S. spending soared during the Vietnam War and its trade deficits widened, confidence in the dollar weakened. In 1971, President Richard Nixon ended the dollar’s convertibility to gold — a move that became known as the “Nixon Shock.” The world entered a fiat currency era, where money was backed not by gold, but by government promise.
2. The Petrodollar Era (1973–Present)
To maintain global dollar demand, the U.S. struck a strategic deal with Saudi Arabia: oil would be sold exclusively in dollars. This gave birth to the petrodollar system, ensuring that every country trading oil needed U.S. dollars. For decades, this reinforced America’s economic dominance and kept global capital flowing toward its markets.
3. Mounting Pressures: Debt, Inequality, and Inflation
By the 21st century, cracks began to appear. Massive global debt, quantitative easing, and geopolitical rivalries challenged the system. Countries like China and Russia began pushing back against U.S. financial dominance. The 2008 financial crisis and the COVID-19 pandemic further accelerated the loss of trust in fiat money, as central banks printed trillions of dollars to keep economies alive.
Chapter 2: The Signs of an Impending Reset
The global currency system doesn’t collapse overnight — it erodes slowly, then all at once. Several indicators suggest that a transformation is underway.
1. De-dollarization
Nations worldwide are gradually reducing their dependence on the U.S. dollar. The BRICS nations (Brazil, Russia, India, China, and South Africa) are developing trade agreements using local currencies or gold-backed settlements. Even oil-rich countries are exploring alternative payment systems — a direct challenge to the petrodollar system.
2. Central Bank Digital Currencies (CBDCs)
Central banks across the world — from China’s digital yuan to India’s digital rupee and the EU’s digital euro — are testing state-backed digital currencies. CBDCs could redefine cross-border trade, bypass traditional banking systems, and reshape global payment infrastructure. The IMF and World Bank have already initiated research on global interoperability of these currencies — a hint of a unified reset in motion.
3. The Gold Revival
For centuries, gold symbolized wealth stability. In recent years, central banks, especially in emerging economies, have been aggressively accumulating gold reserves. This trend signals a loss of faith in the dollar and fiat-based systems, raising speculation that gold may again anchor a future global monetary framework.
4. The Rise of Multipolar Economies
The geopolitical landscape is changing. The unipolar world order — dominated by the U.S. — is being replaced by multipolar powers like China, India, and the EU. These nations are demanding greater control over global trade, finance, and currency standards. The World Bank, IMF, and WTO — institutions rooted in post-WWII U.S. dominance — are being questioned for their relevance in this new era.
Chapter 3: What a Global Currency Reset Might Look Like
A true Global Currency Reset could take several forms. Here are the three most discussed possibilities:
1. A Gold-Backed Basket Currency
In this scenario, global powers could agree to back their currencies with a mix of assets — gold, commodities, and perhaps digital reserves. The IMF’s Special Drawing Rights (SDR) could be expanded to act as a global unit of account, replacing the dollar in international trade settlements.
2. A Digital Reserve System
As blockchain and CBDCs mature, the world could transition to a global digital currency — possibly managed by the IMF or a new international body. This would make cross-border trade instant, transparent, and less dependent on traditional banking. Such a reset would redefine privacy, monetary policy, and financial control.
3. Regional Currency Blocs
The world could fragment into currency blocs:
BRICS Bloc – Using a gold or commodity-backed unit.
Western Bloc (US/EU) – Relying on digital fiat like eUSD or eEuro.
Emerging Market Bloc – Focused on regional trade networks.
This would create a decentralized, multi-currency global economy, balancing power among regions.
Chapter 4: The Economic Earthquake — Effects of the Reset
The aftermath of a currency reset would ripple through every level of society — from governments and corporations to ordinary citizens.
1. National Economies
Countries with massive debt (like the U.S. and Japan) could face intense restructuring. Debt may be partially wiped out or converted into new currency terms. Nations rich in commodities or gold could gain significant influence.
Emerging markets might experience a boom, as the reset could rebalance trade fairness and reduce dependence on Western financial systems.
2. Stock Markets and Investments
A currency reset could trigger volatility in global markets. Traditional safe-haven assets (gold, silver, real estate) might soar, while overvalued equity markets could experience corrections. Investors would need to adapt rapidly to a new valuation standard.
3. Ordinary Citizens
For the common person, the impact would depend on location and asset holdings. Savings in fiat currencies could lose value overnight if devaluations occur. However, those holding real assets — land, metals, or crypto — might benefit. The transition to a digital money system could also bring stricter financial surveillance and reduced privacy.
Chapter 5: The Power Shift — Winners and Losers
Winners
BRICS Nations: Their push for a new financial order could finally weaken dollar dependency and give them equal footing in trade negotiations.
Gold and Commodity Holders: Tangible assets will regain global trust.
Digital Innovators: Blockchain-based finance companies could dominate the next phase of monetary evolution.
Losers
Dollar-Dependent Economies: Countries holding large dollar reserves might see losses if the greenback’s value falls.
Debt-Ridden Governments: Massive debts may need restructuring or default.
Privacy Advocates: A fully digital, trackable monetary system could limit financial freedom.
Chapter 6: Is It Already Happening?
While there’s no official declaration of a “Global Currency Reset,” subtle signals suggest the groundwork is being laid.
The IMF’s 2023 Annual Meetings hinted at the need for a new “global financial architecture.”
BRICS 2024 Summit discussed the creation of a unified payment system and possible gold-backed trade settlement.
Major economies are reducing U.S. Treasury holdings and buying record amounts of gold.
Even the U.S. Federal Reserve and European Central Bank are testing digital payment infrastructures — a quiet preparation for global transition.
Chapter 7: The Philosophical Question — Can Money Be Reset Without Resetting Society?
At its core, money is trust — trust in governments, systems, and each other. A global currency reset is not merely about numbers and exchange rates; it’s about reshaping that trust. It raises deep questions:
Who should control global money — governments or technology?
Can digital systems coexist with privacy and democracy?
Will economic equality finally improve, or will power concentrate further?
The answers will define not only global economics but the very fabric of modern civilization.
Conclusion: The Dawn of a New Monetary Age
The Global Currency Reset is more than an economic event — it’s a generational transformation. The current financial order, built in the shadow of World War II, is crumbling under modern realities: digitalization, geopolitical fragmentation, and debt excess. What emerges next could either bring balance and fairness or deepen control and inequality.
The coming decade will reveal whether humanity steps into a cooperative financial system — rooted in transparency, equity, and technology — or stumbles into a new era of economic dominance under digital surveillance.
Either way, the reset is no longer a question of if — but when. The world’s money machine is being rewritten, and those who understand its code will shape the next century of global power.
Buy BTC Well, since i see alot of panic on twitter and on social media, also i started to panic as well. So i thought maybe i should provide an update to my self and for everyone.
The chart screams bullish, This is no where near bearish.
if BTC dipps below 98k and stays there under 98k then i will be the first one to tell you to panic the fuck out. Otherwise, chill, relax and buy at those two areas.
Later everyone.

BTC 4 days up...4 hours downBTC volatility is off the rails. Took a bit of nudging to get up to these levels, and few short hours to be at the same spot! Take a closer look at the technicals, seems the drop was very purposeful and aggressive. IMHO there's a lot more TO GIVE here. Meaning, do not be surprised if this crosses 120k, then 110k and even 100k. Everything is super inflated and profit takers will shred BTC to pieces. Ultra signals helped here....
Best of luck

Round 2 to ATH on BTCLast trade was perfect and hit TP after a few hours of holding. Im looking to take this to ATH again.

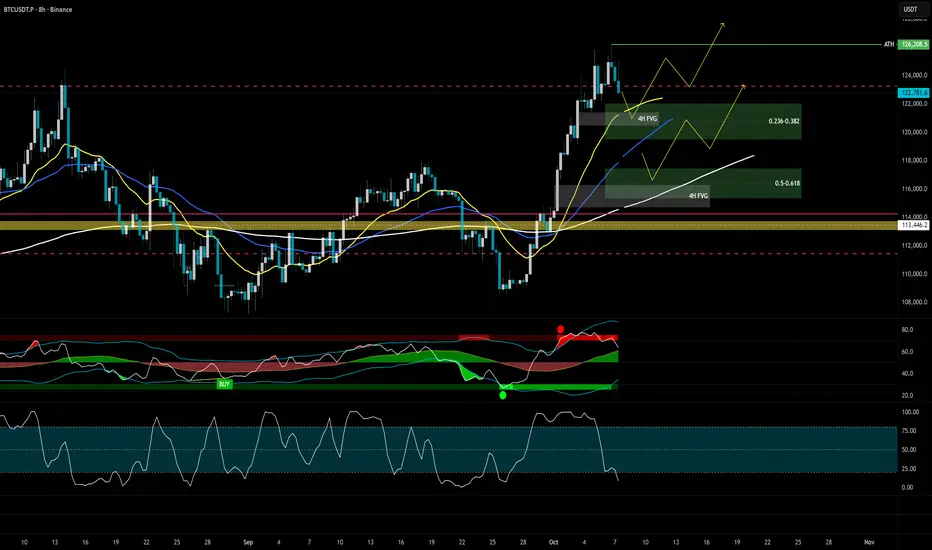
BTC 8H chart - bullish fibonacci pullback zones for resersalCRYPTOCAP:BTC 8H. Not worried about the pullback. Expecting it to hold bullish fibonacci pullback zones.
I have high probability two scenarios in mind approx. 4-8% pullback.
Notice lower oscillator indicator, Stoch RSI on 8H already starting to build momentum at the bottom zone.
Might take couple of days to consolidate in those levels.
Bitcoin Crushes $125K – New ATH Unlocked: Bull Run Just Started?Yo traders, Skeptic from Skeptic Lab! 🩵 Bitcoin just smashed a new ATH—your next move could set the 3-month path! In this video, we dive deep into the daily/4h analysis: from the long squeeze bounce at key support to the parabolic breakout and resistance crush. We hunt fresh long triggers (1h resistance break), skip shorts for now (bias bullish), and I share my take on your positions—hold profits if you're green (target $130K?), partial close if not. HWC/MWC/LWC all uptrend—momentum's building! Don't FOMO; money management saves the day. Like, comment your coin focus, follow for more.

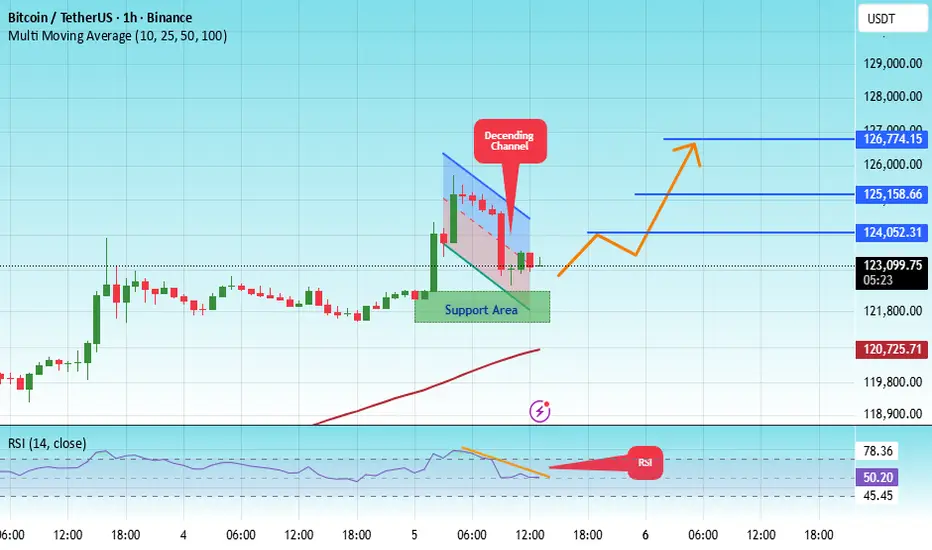
#BTC/USDT Let Bitcoin make a new ATH#BTC
The price is moving within a descending channel on the 1-hour frame, adhering well to it, and is heading for a strong breakout and retest.
We have a bearish trend on the RSI indicator that is about to be broken and retested, which supports the upward move.
There is a major support area in green at 121900, which represents a strong support point.
We are heading for consolidation above the 100 moving average.
Entry price: 123300.
First target: 124050.
Second target: 125160.
Third target: 126774.
Don't forget a simple matter: capital management.
When you reach the first target, save some money and then change your stop-loss order to an entry order.
For inquiries, please leave a comment.
Thank you.
122k$ Head And Shoulders formation on BTC chartBTC will gonna drop to 122k$ from 124k$ due to Head And Shoulders formation on BTC chart.

Inverted H&S and Break Above a Descending Trend Line Inverted H&S and Break Above a Descending Trend Line/Pennant on the 30min and 1hr charts

BTC Long at 111,800 - Excellent Risk/RewardAccount Performance: 208% profit, since 12 September 2025. We are turning $10 into $10k through professional trading techniques.
Previous TP from short position at 112,200. Switch to long position at 111,800 for the same position size.
S/L - 111,300
Entry - 111,800
T/P - 117,200
Keep moving your SL up the ascending support.
Remember, trading technique is more important than trade direction.

Global Arbitrage Opportunities: Across World ExchangesIntroduction: The Art of Earning from Market Inefficiencies
In the world of finance and trading, arbitrage is often considered the holy grail of risk-free profit-making. It is the art of exploiting price differences of the same asset across different markets or exchanges. Though it sounds simple, global arbitrage requires deep market knowledge, speed, technology, and capital efficiency. As world exchanges become increasingly connected through technology and globalization, arbitrage has evolved from manual calculations to high-frequency trading algorithms that identify even millisecond differences.
In 2025, as global markets face volatility, digitalization, and decentralization, arbitrage remains a powerful strategy for both institutional and individual investors. This article explores how arbitrage works across world exchanges, the types of arbitrage that exist, key global examples, and how traders can spot opportunities amid market inefficiencies.
1. Understanding Arbitrage in Global Markets
Arbitrage occurs when an asset—such as a stock, commodity, currency, or cryptocurrency—is priced differently across two or more markets. Traders simultaneously buy the asset where it’s undervalued and sell it where it’s overvalued, profiting from the price difference.
For example, suppose Apple Inc. (AAPL) trades at $180 on the NASDAQ and $181 on the London Stock Exchange (LSE). A trader could buy Apple shares on NASDAQ and sell them simultaneously on LSE, pocketing the $1 difference per share, excluding transaction costs.
This principle applies across stocks, commodities, currencies, derivatives, and digital assets—making global arbitrage a multidimensional opportunity.
2. The Foundation of Arbitrage: Market Inefficiency
The core of arbitrage lies in the concept of market inefficiency. In an ideal, perfectly efficient market, asset prices should reflect all available information simultaneously. However, due to differences in time zones, regulations, liquidity, exchange rates, and information flow, inefficiencies persist even today.
These inefficiencies give rise to price gaps that can be exploited for profit. High-frequency traders, hedge funds, and institutional investors deploy advanced algorithms that scan global markets in microseconds to identify such discrepancies.
Even with today’s high level of automation, inefficiencies cannot be completely eliminated—creating continuous arbitrage potential worldwide.
3. Major Types of Global Arbitrage Opportunities
Let’s explore the most common and profitable forms of arbitrage that occur across world exchanges:
a. Spatial Arbitrage (Inter-Exchange Arbitrage)
This is the most classic form—buying an asset in one market and selling it in another where the price differs.
Example: Buying gold futures on the London Metal Exchange (LME) and selling them at a higher price on COMEX (New York).
b. Triangular Arbitrage
A strategy used in foreign exchange (forex) markets, where discrepancies between three currency pairs allow traders to profit.
Example: Using USD, EUR, and GBP pairs to exploit minor rate mismatches across exchanges.
c. Statistical Arbitrage
This involves using quantitative models to identify mispriced securities based on historical correlations.
Example: If two global steel companies usually move in tandem, but one lags temporarily, a trader can long one and short the other expecting reversion.
d. Cross-Border Index Arbitrage
Global index futures—like the S&P 500, Nikkei 225, or FTSE 100—often trade differently on international exchanges. Traders exploit these pricing gaps between index futures and their underlying baskets.
e. Commodity Arbitrage
Differences in oil, gold, copper, or agricultural commodity prices across world exchanges (MCX India, CME US, LME UK) often create arbitrage windows due to supply-chain disruptions or currency fluctuations.
f. Crypto Arbitrage
With 24/7 trading and hundreds of exchanges, cryptocurrencies offer one of the richest fields for arbitrage. For instance, Bitcoin might trade at $62,300 on Binance and $62,450 on Coinbase, allowing instant profit.
g. Interest Rate Arbitrage (Covered Interest Arbitrage)
This involves borrowing in a low-interest-rate currency and investing in a higher-yielding currency, hedging the exchange rate risk through forward contracts.
4. Global Markets Where Arbitrage Flourishes
1. United States (NYSE, NASDAQ, CME)
The U.S. markets are highly liquid, making arbitrage opportunities smaller but more frequent.
Example: Arbitrage between S&P 500 futures on CME and ETFs like SPY on NYSE.
2. United Kingdom (LSE)
London’s time zone overlap with both Asia and the U.S. makes it ideal for intercontinental arbitrage. Traders exploit pricing differences in dual-listed companies such as Unilever or HSBC.
3. India (NSE, BSE, MCX)
The Indian exchanges often see arbitrage between cash and futures markets, and also between NSE and BSE due to liquidity differences.
Example: Buying Reliance shares on NSE and selling on BSE if there’s a small price gap.
4. Japan (TSE) and Hong Kong (HKEX)
Arbitrage between Japanese ADRs (listed in the U.S.) and their domestic listings is common. Similarly, the Shanghai-Hong Kong Stock Connect allows price discrepancies between mainland and Hong Kong shares (A-shares and H-shares).
5. Europe (Euronext, Deutsche Börse)
European markets see cross-border arbitrage due to multiple exchanges trading the same blue-chip stocks. For example, Shell Plc trades across several European exchanges.
6. Crypto Exchanges (Binance, Kraken, Coinbase, OKX)
Crypto exchanges are globally fragmented and unregulated compared to traditional markets. This creates consistent arbitrage windows—especially between fiat-to-crypto pairs.
5. Tools and Technology Driving Modern Arbitrage
Global arbitrage today is a technology-driven discipline. Traditional traders are being replaced or assisted by algorithms, bots, and AI-powered systems. Here’s what drives modern arbitrage:
a. Algorithmic Trading
High-frequency algorithms detect and execute trades within microseconds. These algorithms continuously compare prices across exchanges.
b. Cross-Exchange APIs
APIs allow traders to fetch real-time prices and execute simultaneous buy/sell orders across global platforms.
c. Artificial Intelligence & Machine Learning
AI models analyze historical correlations, volatility patterns, and market inefficiencies to predict potential arbitrage zones.
d. Blockchain & Smart Contracts
In crypto markets, smart contracts automate arbitrage transactions—reducing latency and ensuring immediate execution.
e. Cloud-Based Trading Infrastructure
Cloud servers ensure that traders are geographically closer (co-located) to global exchanges, minimizing network delays.
6. Challenges and Risks in Global Arbitrage
While arbitrage is theoretically risk-free, in practice, execution, regulation, and timing risks can eat into profits. Key challenges include:
1. Transaction Costs
Brokerage, taxes, and exchange fees can eliminate small price differences, making trades unprofitable.
2. Execution Delays
Even a few milliseconds of lag between buying and selling can result in losses if prices move unfavorably.
3. Liquidity Risk
Low-volume assets may not allow traders to exit quickly, causing slippage.
4. Exchange Rate Fluctuations
In cross-border trades, currency volatility can erode arbitrage gains.
5. Regulatory Barriers
Some countries restrict cross-border trading or capital movement, making arbitrage legally complex.
6. Competition
Institutional traders and high-frequency funds dominate arbitrage, leaving minimal room for manual traders.
7. Technology Failures
Glitches, internet outages, or API failures can disrupt trades and cause heavy losses.
7. Case Studies: Real-World Arbitrage Scenarios
Case 1: Gold Arbitrage Between London and New York
When gold prices on the London Bullion Market Association (LBMA) were slightly lower than those on the COMEX, traders shipped gold physically or used futures contracts to arbitrage the difference—making steady profits before logistical costs reduced margins.
Case 2: A-Share and H-Share Arbitrage (China)
Companies listed both on the Shanghai Stock Exchange (A-shares) and the Hong Kong Stock Exchange (H-shares) often show price gaps due to investor access restrictions. Institutional traders exploit this through arbitrage using the Stock Connect link.
Case 3: Bitcoin Arbitrage in 2021-2022
During crypto bull markets, Bitcoin often traded at a “premium” in South Korea (the “Kimchi Premium”) compared to global averages. Arbitrageurs moved BTC from U.S. or Japanese exchanges to Korean exchanges for instant gains.
Case 4: ETF and Futures Arbitrage
During high volatility, index futures may deviate from their underlying ETF prices. Arbitrageurs buy the cheaper and sell the expensive instrument until prices converge.
8. The Future of Global Arbitrage: Trends for 2025 and Beyond
As the financial world moves deeper into digitalization, arbitrage is becoming more complex, global, and data-driven. Some emerging trends include:
1. AI-Enhanced Arbitrage
AI algorithms now learn from historical inefficiencies and predict arbitrage windows across correlated assets.
2. Tokenized Assets
With real-world assets being tokenized on blockchain, arbitrage between traditional and digital markets will rise.
3. Multi-Asset Arbitrage
Cross-market opportunities involving stocks, commodities, forex, and crypto will create new strategies.
4. Decentralized Exchanges (DEXs)
On-chain arbitrage between DEXs and centralized exchanges (CEXs) will continue to expand, especially in DeFi ecosystems.
5. Regulatory Harmonization
Efforts by global regulators to integrate financial systems (e.g., Basel norms, MiFID II) may reduce inefficiencies but also make legal cross-border arbitrage safer.
6. Quantum Computing
Quantum algorithms could soon revolutionize arbitrage by processing millions of correlations simultaneously—making inefficiencies vanish almost instantly.
9. How Individual Traders Can Find Arbitrage Opportunities
While institutional players dominate, retail traders can still benefit by focusing on specific niches:
Track price spreads between NSE and BSE for dual-listed stocks.
Monitor crypto exchanges for real-time differences using bots.
Use broker data APIs to automate alerts for arbitrage opportunities.
Combine forex and commodity arbitrage strategies using multi-asset platforms.
Participate in ETF arbitrage where price gaps persist during volatile periods.
With proper tools, discipline, and low transaction costs, individual traders can still find small but consistent profits.
10. Conclusion: Arbitrage—The Silent Engine of Global Market Efficiency
Arbitrage is not just about profit—it plays a vital role in maintaining market balance and price efficiency. By exploiting inefficiencies, arbitrageurs help ensure that identical assets trade at consistent prices worldwide.
In 2025, global arbitrage has evolved into a sophisticated, technology-powered discipline spanning traditional finance, commodities, and digital assets. Despite tighter spreads and fierce competition, opportunities persist for those who understand global linkages, act swiftly, and leverage automation.
In essence, arbitrage is where intelligence meets precision—a strategy that proves markets may be efficient, but never perfectly so.
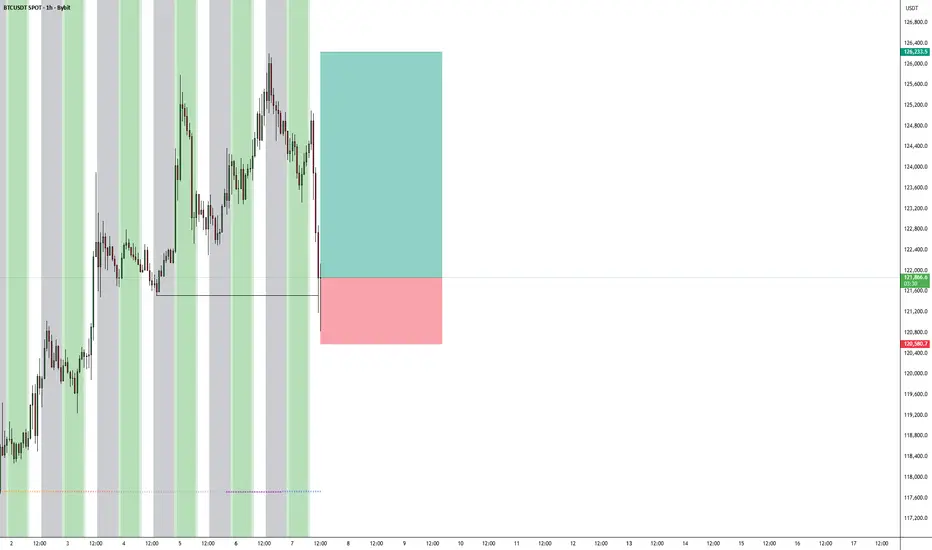
Btcusdt - At Crtitical Decision Point, Breakout Or Breakdown Bitcoin is currently sitting at a critical decision point near the 124,120 level after a Break of Structure (BOS) to the downside, following a Change of Character (ChoCH) at the top.
Key Technical Zones:
Support Zone: Price is testing a marked support area, which has previously acted as a demand zone. This zone could trigger a bullish reaction.
Strong Low: If this level breaks, bearish momentum could accelerate.
Weak High: May be targeted if price finds support and reverses.
Decision Point: The current price level acts as a pivot, determining whether the market will:
Bounce and aim for the upper target near 126,013, or
Break down towards the lower target below 121,000.
Scenarios:
Bullish Scenario:
If price holds the support zone and breaks recent BOS highs, the market may rally toward the 126K target.
Bearish Scenario:
A breakdown below the support and the strong low could trigger a move toward the 121K area.
Conclusion:
Monitor the support zone closely. A strong bullish reaction could confirm a long setup toward 126K, while a clean break below the strong low confirms further downside.
