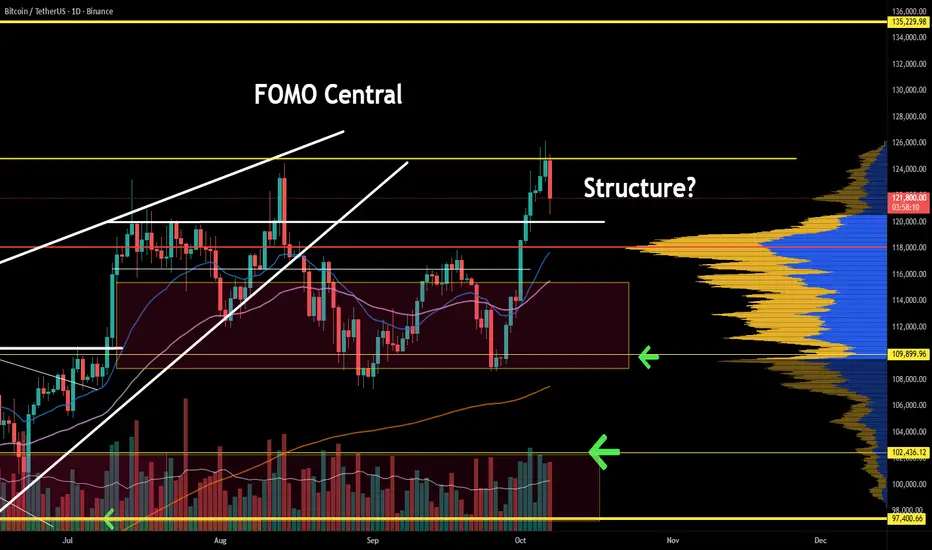
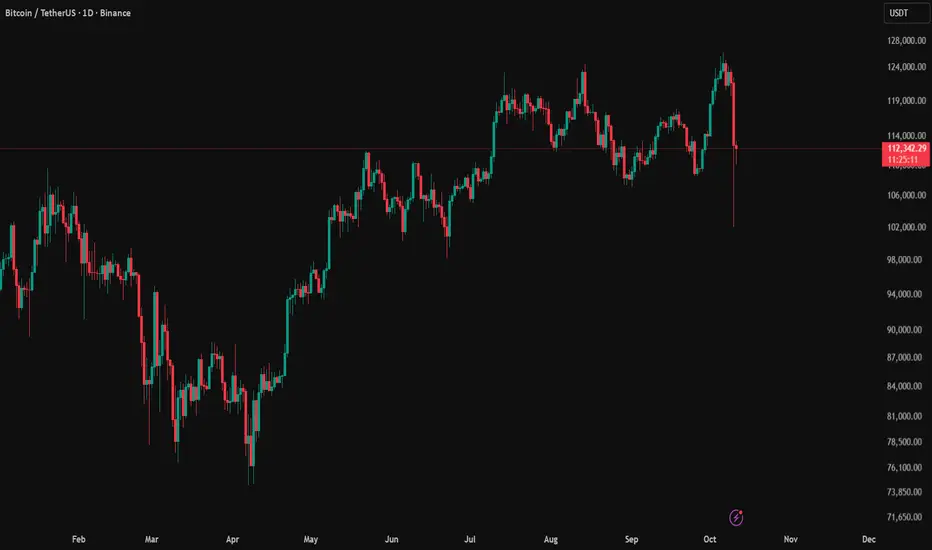
Bitcoin — worst-case scenario. Possibility...Profit-taking has begun around the $125,000 zone, as visible from the descending channel connecting the last three all-time highs. Should the market face another correction, a move toward $109,000 is plausible — not a guaranteed outcome, but a potential support level based on current structure. Traders preparing for worst-case scenarios may consider this as a reference point. With the upcoming FED meeting, the $109K region could serve as a liquidity zone capable of fueling a short-term rebound.
Reminder: This is not a prediction — just a worst-case scenario. Of course, if Trump keeps his mouth shut, a rebound toward 138,000 is also possible.
BTCDOWNUSDT trade ideas

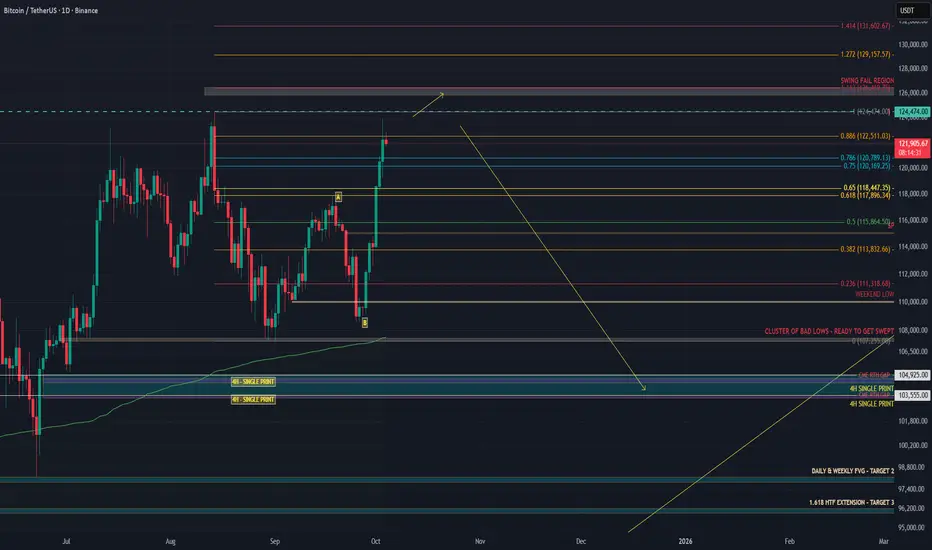
BITCOIN’S FINAL TRAP – THE SENTIMENT SWITCH IS COMING FASTIn my last BTC post I said a dump was likely based on data, and that thesis still stands. If anything, it’s even stronger now. .
On 13 August, CME made a high at 123,590.
That high was weak, no excess, flat TPO top, unfinished auction.
Binance topped at 124,474, Coinbase at 124,522.
CME opened with a gap down, leaving that poor high unrepaired with unfinished business and clean liquidity sitting above.
From 26 September, BTC started grinding up.
I expected a run of the 18 September high and a reversal around 118–119K, but price extended the move to the 1.618 extension. See my last analysis.
Structure was weak, spot CVD flat, futures CVD ripping, open interest climbing.
That shows perps were driving it, not real spot demand.
This week CME finally cleaned it up.
CME ripped through 125,025, taking out the August high at 123,590.
That level matched the old highs on Binance and Coinbase almost perfectly.
CME swept the old poor high left behind by spot and perps, completing the auction.
This is typical CME behavior, it hunts untested reference points during RTH and often reverses right after.
Flow data confirms the setup:
Spot CVD down means real buyers not following.
Stablecoin CVD pushing up means overleveraged longs chasing.
Coin-margined CVD rolling means profit taking or hedge flow.
Open interest flat at the top means trapped longs with no squeeze left.
The move looks like a leveraged markup driven by perps, cleaned up by CME liquidity, and now hanging on air.
CME repaired the August inefficiency, swept the prior spot high, and left another weak high with no excess, a textbook sign of distribution.
There’s still a chance we see one more SFP around 126K before momentum flips, but unless spot demand picks up aggressively, that should be the final liquidity grab.
My targets are 104K and 99K if 104K fails to hold, with potential for an even deeper drop beyond that level.
BTC/USDT Short Set-up High-frequency test strategy
#1
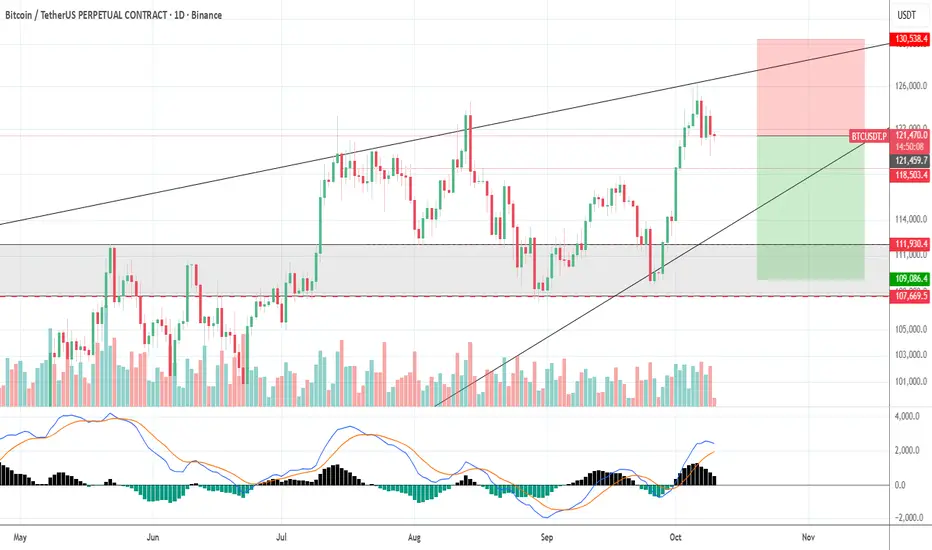
BTC/USDT Short Set-up
— Retest of the all-time high, two reversal signals on higher timeframes, higher timeframe divergence still unplayed, declining volume
— Entry: $121,500 (market sell)
— Stop: $130,600 (7.5%)
— Target: $109000
Risk per trade: 0.5% of total balance
Position size: 7% of total balance, 10x leverage
RR 1:1.36
BTC 4HNow that people are feeling fear, I'm preparing my long positions. I can smell the scent of fear.💩💩💩💩💩💩

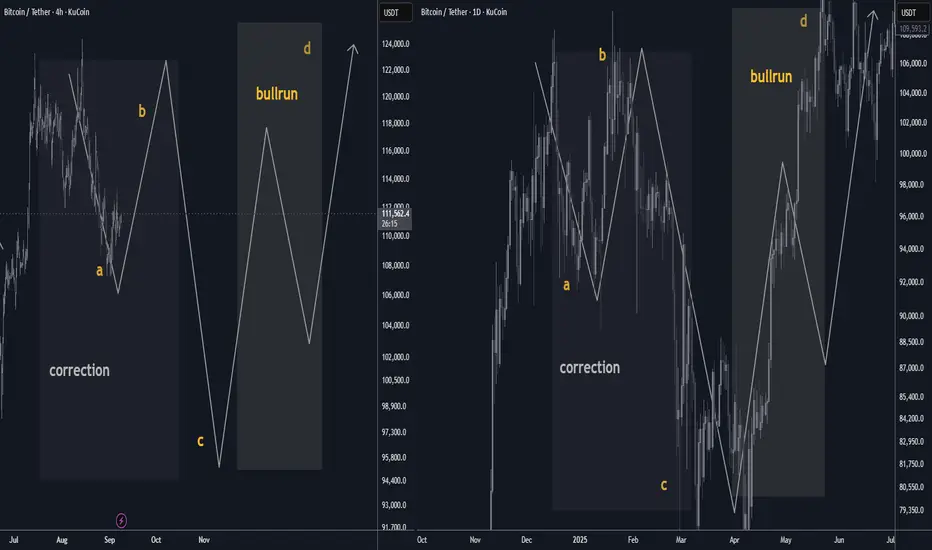
Bitcoin September 2025 Outlook: a/b/c price fractal structureBTC enters September post-ATH with a seasonal headwind. Base case: a ~10% A-leg dip toward $108k, a B-bounce into ~$122k, then a C-flush near ~$94k—echoing April’s ABC rhythm. Once complete, the uptrend should re-assert into year-end. 📉🔁📈 #Bitcoin #Seasonality #Crypto
🟠 Bitcoin September Outlook: Seasonality vs. Structure
After a fresh ATH, September’s historical bias skews mildly red. Base case is a ~10% A-leg dip that develops into an A/B/C correction before trend continuation. Think controlled pullback → consolidation → next markup. 📉➡️🔁➡️📈
________________________________________
🗓️ Seasonality Snapshot (2015–2024)
• Mean (10-yr): −2.55% · Median: −4.52%
• Red months: 6/10
• Worst September: 2019 (−13.88%)
• Best September: 2024 (+7.39%)
• Last 3 yrs avg: +2.8% (2024 +7.39%, 2023 +3.99%, 2022 −3.09%)
• Last 5 yrs avg (2020–2024): −1.3%
Read: September has tended to be weak, but the last two years printed green. Seasonality is a headwind—not a handbrake. 🌬️
________________________________________
🧩 Structure Thesis (Fractal Analog)
You’re looking for a repeat of April 2025’s A/B/C rhythm—scaled up:
• April 2025 reference: A ≈ $92k → B ≈ $106k → C ≈ $80k
• Now (projected):
o A ≈ $108k (≈ 10% pullback from recent highs) 📉
o B ≈ $122k (relief rally / lower high) 🔁
o C ≈ $94k (final flush into demand, completing the correction) 🧱
Interpretation: A measured September fade aligns with the A-leg. A reflexive B-bounce can follow as funding resets and late longs get cleaned up, with a C-leg completing the pattern before the next expansion. 🚀
________________________________________
📊 How Seasonality Supports the Call
• Typical drag: Median −4.5% and multiple red Septembers justify a down-bias.
• Volatility window: The historical 21-point spread (best +7.39% vs worst −13.88%) means a 10% dip sits well within normal bounds.
• Cycle context: With a new ATH just printed, a shallow corrective phase is constructive—not bearish regime change.
________________________________________
🧭 Levels & Triggers
• Bias line: Momentum cools into $108k → watch for seller absorption and open interest reset.
• Relief cap: $122k acts as B-rally resistance; sustained closes above $122k would invalidate the ABC idea and argue for immediate continuation. ✅
• Completion zone: $94k (C) is the buy-the-dip completion area; clean breaks below raise risk of a deeper time correction rather than a swift V-reversal. ⚠️
________________________________________
🧪 What to Monitor (Confirmation/Invalidation)
• Liquidity & OI: De-leveraging into A, controlled OI rebuild into B, washout into C.
• Spot-ETF flows / stablecoin issuance: Weakening into A, stabilizing by late month supports B→C rhythm.
• Funding/basis: Overheated → normalize during A; negative spikes near C often mark capitulation.
• Breadth (alts): Underperform into A/C; broad risk-on breadth usually returns post-C.
________________________________________
📝 Base Case Path (Textbook)
September: drift to $108k (A) → bounce toward $122k (B) → final tag of ~$94k (C) → reset + markup into Q4.
(If price reclaims and holds above $122k early, treat that as trend continuation—not a correction.)
________________________________________
🔒 Risk Notes
• Seasonality is a tendency, not a rule. Macro catalysts (CPI, policy, liquidity) can dominate calendar effects.
• This is market commentary, not financial advice. Manage risk and invalidation levels. 🛡️

BTC ready for longsWe scrapped the last trade because the 1 hour did not close in our favor but I believe the HTF is now ready.

Descriptions about the market! Read the caption!Given Mr. Trump's remarks and the unprecedented crash in cryptocurrencies, I must say this individual significantly harms markets, especially investors. Imposing a 100% tariff on Chinese goods essentially means "we want no trade with you," which is fundamentally unfeasible. The United States and China will undoubtedly negotiate. However, our main focus here is the financial market collapse. This decline isn’t merely about falling prices—it goes beyond that. The core issue is the loss of market trust and credibility. Once confidence is broken, it is difficult to restore and may take a long time.
In any case, I felt it was my duty to bring this up and remind you to stay composed. Never forget to use stop-losses in your trades and practice proper capital management.
If needed, you can always message me on this platform for advice.
NOTE: This post is This post is educational.
Lingrid | BTCUSDT Sharp Drop Creates Buying OpportunityThe price perfectly fulfilled my previous idea . BINANCE:BTCUSDT rebounded sharply from the 102,100 support level after a flash crash, signaling renewed demand near structural lows. Price action remains inside a wide consolidation range, with the 119,500 target acting as a key resistance level. A sustained price movement above the trendline could confirm recovery momentum toward ATH at 125,000. The flash crash likely shook out weak hands before market stabilization and potential re-accumulation.
⚠️ Risks:
Another liquidity flush below 108,000 could trigger panic selling.
Broader risk-off sentiment across crypto could delay recovery.
Failure to reclaim 119,500 may reinforce short-term bearish pressure.
If this idea resonates with you or you have your own opinion, traders, hit the comments. I’m excited to read your thoughts!

Simple is good. Now take profits with this Sucker’s Rally.Simple is good. The DCA box worked out perfectly — people were too bullish at the top and too bearish at the bottom.
The question is: “Is this enough?”
I don’t think so. Because normally, after moves this catastrophic, people don’t rush to long immediately. But this time, it’s like the whole market adopted a “buy the dip” attitude overnight.
That’s why I think levels below 100k still scare most people — which makes them interesting. A 98–99k liquidity wick would make perfect sense… but not yet.
LTF view: Watch the 116–119k area.
If delta shows increasing shorts, don’t short — wait higher.
But if people forget what just happened and start heavily longing again, it’s probably another short setup in this sucker’s rally.

Bitcoin STRONG Weekly Bounce - What's Next?Hello BTC Watchers 📈
📢 Bitcoin was trading right on top of a crucial support zone. But the price has successfully bounced in the weekly and made a strong comeback from the support zone.
The weekly moving averages
The daily moving averages
This is telling for a number of reasons. In the weekly we see a strong bounce above the moving averages as well as in the daily, and in the daily we had just bounced back from a correction which took us to the 100d MA (which is the general zone for a correction, or at least a wick towards that area. This indicate that in the short and longer term, the chart is looking up and bulls are in control.
What are you thoughts, new ATH or just a fakeout?

BTC Prime Levels These are my Prime Levels, key price zones where BTC reacts the most.
How I Trade Them:
Close Above a Level : I buy - price showing strength.
Close Below a Level : I sell - price showing weakness.
Rejection at a Level : I trade the bounce - moving opposite of the rejection.
The idea is simple, let price decide.
I don’t predict i just react to how BTC behaves around these Prime Levels.
You can scalp on 5 min tf or day trade them on any tf, depending on your style.
BTCUSD NEXT POSSIBLE MOVE Bitcoin is holding strong near a key support zone, showing signs of buyer accumulation. If the price continues to respect this area, a bullish move can be expected in the coming sessions.
Structure remains bullish above support, indicating that buyers may soon regain control.

BTC Next Leg Down?Price closed. below the important level of $123,742. I am expecting the newly created supply to send price down lower.

BTC vs. The Broader Market: A Dangerous Powerful Wave is Coming Today, we're taking a deep dive into the two most important charts in the crypto space: Bitcoin (BTC/USDT) and the Total Crypto Market Cap (TOTAL). Using an Elliott Wave framework on the weekly timeframe, we can see a clear bullish structure taking shape. However, some underlying weaknesses in key indicators warrant a cautious approach. Let's break it down.
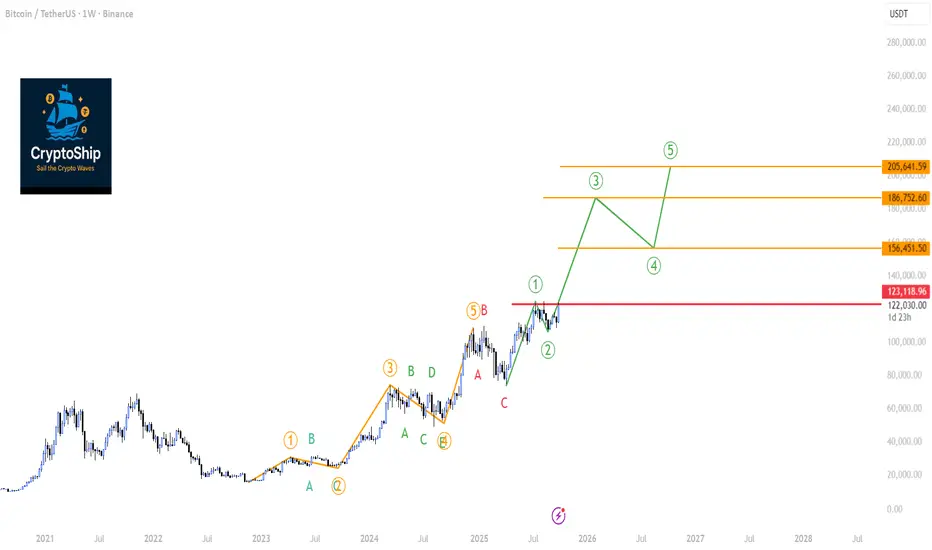
1. Bitcoin (BTC/USDT): The Path to a new All-time high Hinges on a Key Level
As we can see on the weekly chart, Bitcoin appears to have completed a major five-wave impulse cycle which topped out around the $108,000 mark. This was followed by a necessary ABC corrective phase.
The exciting part is what comes next. We are potentially witnessing the beginning of a brand new five-wave impulse.
Wave (1): Appears to have started from the $74,000 low and peaked near $124,000.
Wave (2): A healthy correction followed, finding support around $107,000.
If this count is valid, we are now in the early stages of Wave (3), which is typically the most powerful and extended wave in an impulse sequence.
The Critical Condition:
For this bullish count to remain the primary scenario, the current weekly candle must NOT close below $123,000. A weekly close below this crucial level would risk invalidating the start of this new impulse, suggesting that we may still be within a more complex corrective structure (such as a regular flat correction Check the article).
Also during wave (3) the Weekly RSI must go beyond "80" showing strong momentum ( if it fails to do so then it's a caution signal to be strongly considered because a reversal could happen at any time!)
Indicator Analysis:
Bearish Divergences: We must note the lingering bearish divergences on both the RSI and MACD. These signals are suspicious and suggest that momentum is not fully confirming the recent price highs. They need to be monitored closely.
Volatility Coiling: The Bollinger Band Width Percentile (BBWP) is showing significant contraction. This coiling of the bands indicates that weekly volatility is decreasing, which often precedes a massive price expansion in the coming weeks or months, However the lack of BBWP exhaustion (spectrum crossing 90%) remains a bullish sign combined with the contraction
Trend Strength: The ADX is rising on the weekly chart, confirming that a strong trend is in progress.
Volume: On-Balance Volume (OBV) and general volume profiles appear adequate for now.
2. Total Crypto Market Cap (TOTAL): The Broader Market Picture
The Total Crypto Market Cap chart tells a very similar story, reinforcing our Bitcoin analysis. The bullish phase began in sync with BTC back in November 2022.
The current Elliott Wave structure for the entire market is as follows:
Wave (1): Completed in March 2024.
Wave (2): Corrected into May 2024.
Wave (3): Finshed on March 2024
Wave (5): Finshed on December 2024
Currently the Total market cap chart is closely alligned with BTC chart which confrims the BTC leadership is intact. The current Elliot count of TOTAL market cap indicated wave (1) started April 2025 but curretly wave 2 showing caution signals
A Significant Red Flag - The Volume Divergence:
While the price structure remains bullish, there's a concerning signal under the hood. On the weekly RSI, we see a double bottom pattern, which is typically bullish. However, looking at the On-Balance Volume (OBV) during the same period, the OBV printed a lower low.
This is a classic bearish divergence between price/momentum and volume. It indicates that the recent push higher is not being supported by genuine, strong volume, suggesting conviction is weak.
Alternative Scenario:
If this volume weakness persists, we might see Wave (2) extenstion to around $3.23 Trillion. This would lead to a deeper Wave (2) correction, From that support, Wave 3 could launch that would still likely reach our ultimate ATH.
Conclusion: Bullish Outlook with a Note of Caution
Bringing both analyses together, the macro view for the crypto market remains decisively bullish. The Elliott Wave structures on both BTC and the TOTAL chart point towards significantly higher valuation, the lack of BBWP exhaustion on weekly charts of BTC & Total market cap remains a strong bullish indication combined with the BBWP expansion.
However, the market is showing signs of fatigue. The bearish divergences on Bitcoin's indicators and the critical volume divergence on the TOTAL chart cannot be ignored. This suggests that while the overall destination is uptrend, the journey might include a corrective dip before the next explosive leg higher.
Key Takeaways:
Overall Bias: Bullish.
Key Level for BTC: Watch the weekly close relative to $123,000. This is our line in the sand for the current impulsive structure.
Key Concern: The lack of strong volume confirming the market's recent move up warrants caution.
Volatility: Brace for a significant expansion in price movement. The compressed BBWP on both charts suggests a major move is brewing.
Stay vigilant and manage your risk accordingly. The next few weekly closes will be critical in determining whether we blast off directly or take a detour first.
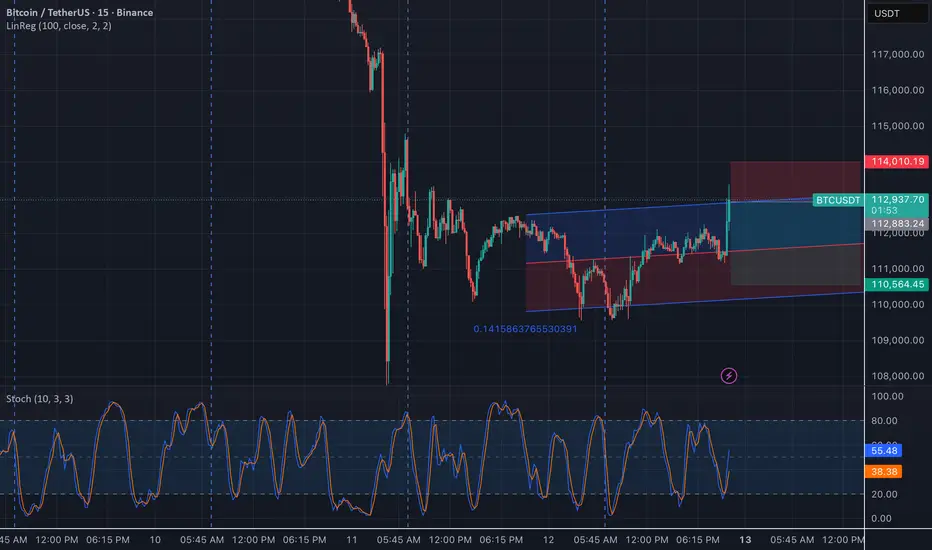
BTCUSDT — Bullish Rebound Within Regression Channel (15m AnalysiBitcoin is showing a potential bullish rebound inside the linear regression channel after a sharp drop.
Price is currently testing the midline resistance area around $112,800, supported by a strong bounce from the lower boundary near $110,500.
The Stochastic Oscillator has crossed upward from the oversold zone, signaling short-term bullish momentum.
If the price breaks above the upper channel, next resistance could be seen near $114,000.
Failure to hold above $111,800 may invalidate the bullish setup and retest the lower boundary.
🔹 Tools used: Linear Regression (100), Stochastic (10,3,3)
🔹 Timeframe: 15m
🔹 Exchange: Binance
#BTCUSDT #Bitcoin #TechnicalAnalysis #TradingView #CryptoAnalysis #Scalping #DayTrading
Btcusdt This disgraced will go down to 115k 114k no reason why it keeps going up . Gold and stocks index hitting all time high every other day , this will end up very bad soon

Where is BTC heading In my previous analysis on #btc I predicted exactly what happened today on the market, and as things look #btc is heading to the $114,000 zone to mitigate all the imbalance left behind in the bullish move. Check my chart for more details on the position to enter the market.

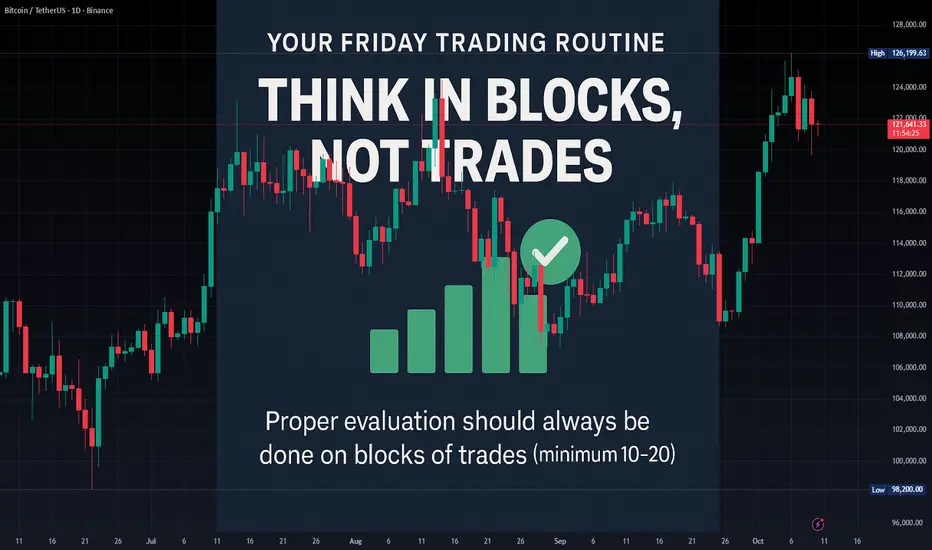
The Process Notebook #1 — The Successful Trader’s RoutineThe Successful Friday's Trader Routine: Evaluate but Think in Blocks, Not Trades
Another trading week is about to end. For most traders, Friday means checking wins and losses. For professional traders, it means evaluating the system.
💡 Remember: a single trade means nothing.
Proper evaluation, to avoid emotional bias caused by variance, should always be done on blocks of trades (minimum 10–20).
But here’s the real twist: If you’re judging your system only by Win Rate (WR) or Reward-to-Risk (RR)… you’re missing the real picture.
A robust trading system needs to be monitored through a small set of key metrics that reflect not just how much you earn, but how consistent and reliable your edge truly is.
Here’s the minimum you should be tracking 👇
📈 Return Metrics (How much your system makes)
Expectancy (average return per trade): quantifies the true profitability of your edge.
CAGR (Compound Annual Growth Rate): shows long-term compounding efficiency.
Payoff Ratio (avg win / avg loss): evaluates quality of your wins vs. losses.
📉 V olatility & Risk Metrics (How stable your system is)
Standard Deviation of Returns: measures the variability of your outcomes.
Max Drawdown: identifies the deepest pain your account can face.
Recovery Factor (Net Profit / Max DD): shows resilience and system efficiency.
⚙️ Consistency Metrics (How repeatable your process is)
Sharpe Ratio: return per unit of volatility — higher = more efficient risk use.
Win/Loss Streak Distribution: reveals your emotional endurance threshold.
Trade Frequency Stability: checks if your system behaves consistently over time.
🧠 Why this matters
When you evaluate your trading in blocks (using statistics, not emotions), you detach from the noise and connect with your system’s real performance.
You stop judging yourself trade by trade… and start thinking like a risk
manager.
How do you evaluate your system — by emotion or by metrics?
Why crypto bounced before SPY after Trump tanked the market!Bounce reasons:
- Falling wedge
- Double bottom
- Failed double top providing liquidity
- Very undersold
My chart might look a bit messy but this is my interpretation of what happened - Lmk what you think!

Bitcoin Fake Breakout and Potential Long SetupAfter the fake breakout at $120,836, Bitcoin is showing early signs of recovery. A risky long position can be considered if $121,692 breaks, with a stop loss just below $120,836.
If BTC falls back below $120,836, a short position can also be taken — but remember to take quick profits or move to breakeven, as this setup goes against the main bullish trend.
For the long setup, it’s reasonable to keep the position open and accept the stop-loss risk, since there’s strong upside potential if momentum confirms.
Also, if the RSI on the 1-hour chart breaks above 50, it would serve as a confirmation for the long trade.

BTC HTFOn the higher timeframes, I believe we still have reasons to remain bullish. Monday will be an important day since the markets haven’t yet had the chance to react to Friday’s events. We made a fakeout of the anchored VWAP from the last bottom, the wick bounced off the annual VWAP, and we also have an SFP in play.

Bitcoin getting rejected at all time highBTC is preparing for another BOS; however, it seems that big players want to suppress the price. Momentum remains bullish, and so does the trend, but more importantly, the sentiment is still bullish. A bearish response that fails to produce a lower low is an opportunity to accumulate.