Btc geometric downsideUsing tools forgotten about by most, and by finding appropriate anchor points, we can get great pointers to future price moves.
I think btc goes much lower than most imagine. Could be a painful couple of weeks.
BTCDOWNUSDT trade ideas

Bitcoin - Will the parallel channel hold?Introduction
The Bitcoin market is currently showing an interesting structure that offers both bullish and bearish possibilities. By analyzing the liquidity dynamics, the channel formation, and key areas of interest highlighted on the chart, we can gain a better understanding of the potential scenarios that may play out in the short to medium term. This analysis focuses on the recent liquidity sweep, the behavior within the rising channel, and the critical zones that could act as decision points for price movement.
Liquidity sweep above the highs
Recently, the market performed a liquidity sweep above the previous highs. This type of price action typically occurs when liquidity pools are triggered, trapping breakout traders and providing institutional players with favorable entries in the opposite direction. The sweep has set the stage for the next move, and it becomes crucial to see whether price sustains above this level or rejects it decisively.
Rising channel
Price is currently trading within a rising channel, which often acts as a short-term bullish structure but can also precede reversals if broken to the downside. The channel is providing clear levels of support and resistance, with the midline serving as a short-term equilibrium point. As long as price remains inside this channel, traders should expect oscillations between its boundaries, but any break below it could trigger a stronger move toward lower support zones.
Bearish scenario
In the event that price fails to hold within the channel, the bearish scenario points toward a retest of the lower fair value gap (FVG) around the 113,000 level. This would align with a deeper correction, offering the market a chance to rebalance inefficiencies left behind during the recent bullish rally. A sustained breakdown from the channel could accelerate selling pressure, with liquidity below key lows acting as a magnet for price.
Bullish scenario
On the other hand, if price manages to respect the rising channel and reclaim the liquidity sweep level, the bullish scenario would see a continuation toward the higher 4-hour fair value gap around 119,000–120,000. This area is a major point of interest, as it represents an unfilled imbalance that could attract buyers if momentum continues. Holding above the midline of the channel would strengthen the bullish outlook and could even lead to a retest of previous highs.
Final thoughts
Overall, the market is at a decisive stage where both bullish and bearish outcomes remain valid. The liquidity sweep has created a reaction point, and the rising channel offers a clear framework for monitoring price behavior. Traders should remain flexible and prepared for either outcome, watching closely for confirmations such as a clean break of the channel or a strong reclaim of resistance levels. Ultimately, the reaction around the current structure will determine whether Bitcoin continues higher toward the upper fair value gap or corrects lower into the demand zone below.
-------------------------
Thanks for your support. If you enjoyed this analysis, make sure to follow me so you don't miss the next one. And if you found it helpful, feel free to drop a like 👍 and leave a comment 💬, I’d love to hear your thoughts!

BTC: Correction or the Calm Before the Storm? AI Breakdown What's up, crypto crew! 🚀 NeuralTraderingPro, back in the hot seat to help you navigate through the fog of market uncertainty. It's Saturday, September 20th, and we're seeing last week's bullish fire cool down into a more cautious stance. So let's break it down: is this a healthy breather before the next leg up, or the start of a deeper correction?
📜 FORECAST REVIEW: THE MARKET PUMPED THE BRAKES
My last analysis on September 18th hit the nail on the head. I pointed out that massive wall of resistance around the $117,750 - $118,000 zone. My primary call was that a clean break above that level would pave the way to $122,500. But the bears held the line! 🛡️ The bulls got rejected, and the price pulled back, confirming my alternative correction scenario. The market sliced through our first support at $116,800 (the previous `down1` level) and is now battling it out in the key $115,800 zone (the previous `down2`). The market chose caution, and we have to adapt.
📊 THE CURRENT SITUATION: CHARTS AND INDICATORS
Current Price: $115,905.93
📈 Daily Chart (1D): The powerful uptrend is taking a breather. We're seeing two red candles, signaling a correction after the recent run-up. The RSI is cooling off from overbought territory, which is a healthy sign. The price is approaching the 20-day SMA, which should act as a key dynamic support. The MACD shows that bullish momentum is fading. The big picture is still bullish, but in the short term, the bears are in control.
💹 4-Hour Chart (4H): The picture is even clearer here. The price has broken below the 20-period SMA (blue line) and is now testing the 50-period SMA (orange line) for support. This is a clear signal of a short-term sentiment shift from bullish to bearish/corrective. The MACD has dipped into negative territory, and the RSI is below 50, confirming weakness from the buyers on this timeframe.
⏱️ 30-Minute Chart (30m): On the lower timeframe, we're in a clear descending channel. Price is trading below both the 20 and 50 SMAs. The RSI is trying to bounce off the oversold zone, which could spark a small local bounce, but the overall trend here is still down. The MACD is hinting at potential consolidation, but we'll need stronger signals for a full reversal.
📋 ORDER BOOK ANALYSIS: THE BATTLE FOR $115,900
The order book is where the real drama is unfolding:
🔴 Sell Walls (Resistance): Right at the current price of $115,905.93, there is a massive sell order for nearly 13 BTC (worth ~$1.5 million)! This is a huge wall putting heavy pressure on the price and capping any move up. The sellers are completely in the driver's seat right now.
🟢 Buy Walls (Support): The bulls are biding their time. Their main forces are clustered just below the current price. A large cluster of buy orders is stacked in the $115,868 - $115,886 range. This is the first serious line of defense where buyers are ready to step in.
The Takeaway: The sell pressure is immense and immediate. The price is literally hitting a brick wall. If the bulls can't hold the line around ~$115,870, the drop could accelerate.
📰 WEEKLY RECAP & MARKET NEWS
This week has been a rollercoaster! 🎢 It kicked off with a steady climb that turned into a euphoric rally mid-week on the news of the Fed rate cut (as expected). The price shot up to $117,750. However, the euphoria wore off quickly, and the last few days have been all about profit-taking and correction.
Key news and themes on our radar today:
1. 🌐 FOCUS SHIFTS TO ALTCOINS. Chainlink (LINK) is showing incredible strength. Major firm Caliber invested $6.5M into it , and some analysts are calling for a run to $100 . Successful pilot programs with UBS in Hong Kong are also fueling the fire . This could be temporarily pulling liquidity away from Bitcoin, contributing to its current lull.
2. 🧐 LONG-TERM BULLISH SENTIMENT. Despite the correction, the big players are staying optimistic. Michael Saylor recently stated that a "decisive 10-year run" for Bitcoin has begun. The CEO of HashKey also spoke about BTC's potential as a strategic reserve. This provides a solid long-term foundation and should limit how far we fall.
3. 💰 THE FTX PAYOUT IS COMING. At the end of the month, on September 30th, a $1.6 billion payout to FTX creditors is expected. This event could inject massive volatility into the market. If that money gets reinvested, we could see a pump. If it's cashed out to fiat, expect a dump. The market is holding its breath.
4. 🇺🇸 THE ETF SAGA CONTINUES. Grayscale just filed for a spot Dogecoin ETF. This shows that the process of integrating crypto into traditional finance is in full swing, which is a long-term positive for the entire market.
🔮 FORECAST & KEY TARGETS FOR THE WEEK (Sept 21-28)
This correction seems logical and, for now, doesn't threaten the macro bull trend. However, the bears have seized short-term control. The coming week will likely start with a test of key support levels. The outcome of that battle will dictate the market's direction for the next few days.
Probability: Short 📉 (55%) / Long 📈 (45%)
🎯 Key Targets for the Week Ahead:
Upside Targets (If Support Holds):
1. 🐂 $116,800 - The old support level, now the first line of resistance.
2. 🐂🐂 $117,750 - The recent high; a powerful resistance zone.
3. 🐂🐂🐂 $119,500 - A psychological barrier before the assault on $120k.
Downside Targets (If Support Breaks):
1. 🐻 $115,000 - A critical psychological level and a support zone on the daily chart.
2. 🐻🐻 $113,800 - The consolidation zone from early September; the next major support.
3. 🐻🐻🐻 $112,500 - The 50-day SMA area. This is the bulls' last stand before a much deeper drop.
💡 TRADE IDEAS
1. Long Positions (Playing the Bounce)
Long 1 (Conservative): Enter after a clear bounce from the $115,000 support zone with confirmation of buyer strength. Targets: $116,800, $117,750. Stop-loss: $114,400.
Long 2 (Aggressive): Enter after a confirmed break and hold above $116,800. Target: $119,500. Stop-loss: $116,200.
2. Short Positions (Riding the Correction)
Short 1 (Aggressive): Enter on a confirmed break and hold below the $115,800 support zone. Targets: $115,000, $113,800. Stop-loss: $116,300.
Short 2 (Conservative): Short a failed retest of the $117,750 level if the price returns there and shows weakness. Target: $116,800. Stop-loss: $118,300.
🛡️ FINAL THOUGHTS & RECOMMENDATIONS
The market is cooling off after a hot run, and that's perfectly normal. Now is the time for patience and a level head. Don't panic sell, but don't ignore the signs of weakness either. All eyes are on the ~$115,000 support level. If we hold it, the path to recovery opens up. If we break it, expect further correction. And as always, use stop-losses 🛡️—they're your best defense in any market condition!
May your trades be profitable and your analysis sharp! 💰 Don't forget to smash that like button 👍 and subscribe so you don't miss the next breakdown!

Can #BTC continue to rise?📊Can #BTC continue to rise?
🧠From a structural perspective, we are still in a bullish structure and trend. The price is still above the yellow support zone, so the possibility of continued bullish momentum remains high. Avoid chasing shorts near the yellow support zone!
➡️If you want to participate in short trades, we can watch for short trading opportunities after the red target zone is reached. Alternatively, after the price breaks below the inflection point and the yellow support zone, and the yellow support zone turns into the blue resistance zone, look for shorting opportunities near the blue resistance zone.
🤜If you like my analysis, please like 💖 and share 💬
BITGET:BTCUSDT.P

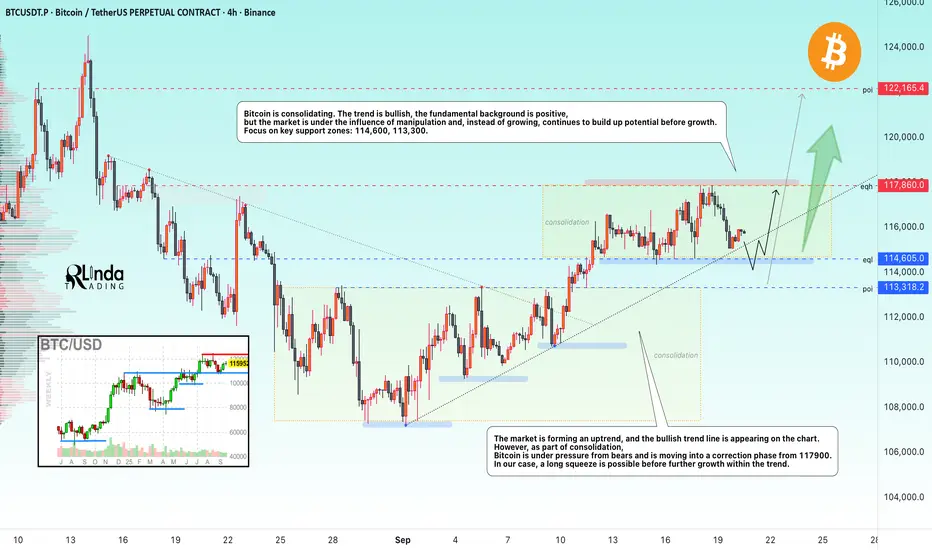
BITCOIN → Manipulation, long squeeze before growth BINANCE:BTCUSDT is in a global bullish trend. The fundamental background, following the start of interest rate cuts, is taking a positive turn, but instead of growth, the market is consolidating...
Bitcoin is showing resilience, trading within the specified trading range (above 114K) amid the Fed's policy easing. For three weeks in a row, growth has been supported by dovish signals from the central bank and growing institutional demand.
Key drivers: The Fed's 25 bps rate cut and forecasts of further easing (to 3.6% by the end of 2025) have strengthened the fundamental backdrop in the cryptocurrency market. Corporate and ETF purchases continue to fuel the bullish trend. Low rates reduce the attractiveness of bonds and increase interest in Bitcoin.
Technically, the market, influenced by manipulation rather than growth, continues to accumulate potential before growth.
Resistance levels: 117860,
Support levels: 114600, 113300
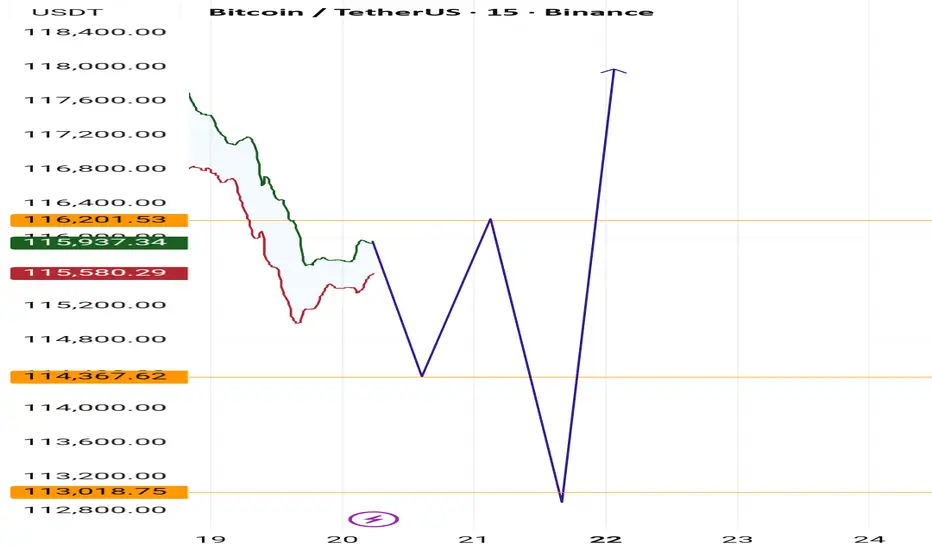
The market is forming an uptrend, with a bullish trend line appearing on the chart. However, as part of consolidation, Bitcoin is under pressure from bears and is moving into a correction phase from 117900. I expect that MM may form a long squeeze in the liquidity zone. That is, a false breakdown of the consolidation support and trend at the same time, and only then return to an upward movement.
Best regards, R. Linda!
Bitcoin Eyes $118K as Fresh Channel Structure FormsBitcoin’s short-term price action shows signs of stabilization after a recent correction. The hourly chart now highlights a fresh channel structure where support and resistance appear well-defined. This new formation could provide a rotational environment for price action before an expansion into higher levels.
Key Technical Points
- Fresh Channel: Support and resistance forming on the hourly timeframe.
- Point of Control: Price attempting to reclaim local POC.
- Upside Target: $118,000 remains the key bullish objective.
The pullback from the highs was not random — it originated at a high-volume resistance level where the point of control was briefly front-run. This rejection triggered a short-term correction before price rebounded at channel support.
Bitcoin is now attempting to reclaim the local point of control. A successful reclaim would validate the channel structure and increase the probability of expansion toward $118,000. Structurally, this suggests that the current correction is merely a rotation within the channel rather than a breakdown of the trend.
What to Expect
As long as the channel remains intact, Bitcoin is poised for rotation higher. A close above the POC could accelerate momentum, pushing BTC toward $118,000.

BTC/USDT – Long Setup After Liquidity Grab (1H Chart)Bitcoin has recently swept liquidity near the 115,046 support zone and is now showing signs of reversal. This setup is based on a potential bullish continuation after the liquidity grab.
Entry (Buy): 115,965.94
Stop Loss (SL): 115,046.66
Take Profit (TP): 117,939.93
📊 Plan:
Price reacted strongly after liquidity sweep below recent lows, indicating buyers stepping in. As long as price holds above the entry zone, the upside target towards 117,939.93 remains valid.
This trade offers a clean risk-to-reward ratio with SL safely below the liquidity sweep and TP at the next resistance zone.
⚠️ This analysis is for educational purposes only, not financial advice.

BTC 4H Analysis - Key Triggers Ahead | Day 43😃 Hey , how's it going ? Come over here — Winter got something for you!
⏰ We’re analyzing BTC on the 4-Hour timeframe.
👀 On the 4H timeframe of Bitcoin, we see that after the recent interest rate cut news, price started moving down. It seems that the potential upside from the news was already priced in by traders. Right now, BTC is trading in a range between resistance at $117,573 and support at $114,828. A breakout of either side could send the price toward the next support or resistance. For now, the market will likely move into a range condition, where the win rate of most setups drops, so it’s better to trade with lower risk.
🧮 Looking at the RSI oscillator, it is near a support zone below the 50 level. The two key levels to watch are 40 and 70. If RSI breaks above or below these zones, Bitcoin could start a new move.
🕯 Currently, the size, volume, and number of red candles are increasing. As BTC approaches support, some buy orders have been triggered. The key question is whether this support zone is strong enough to hold the price until the new week begins. Since the ATH, every correction has faced strong selling pressure from major sellers (maker sellers).
🧠 At this stage, Bitcoin itself may not provide the best setups for positions. However, altcoins that are showing bullish divergence or relative strength against BTC could present better opportunities. We can track these coins on platforms like TradingView or CoinMarketCap, identify their triggers, and look for long entries if the setups are valid.
❤️ Disclaimer : This analysis is purely based on my personal opinion and I only trade if the stated triggers are activated .

Bitcoin roadmapIn general, the current Bitcoin movement path will be between the price range of 103,000 and 119,100. There will be several waves in this path. The most accessible price wave will be reaching 113,000, and the way to reach this price is given in the image shown.

Bitcoin price pathIn general, the current Bitcoin movement path will be between the price range of 103,000 and 119,100. There will be several waves in this path. The most accessible price wave will be reaching 113,000, and the way to reach this price is given in the image shown.

BTC - UPDATE#BITCOIN - Update 🧭
As flagged in my previous weekly outlook, we remain in a very neutral area: $118,000–$112,000.
H4 chart shows what looks like a bearish retest.
Short term, I wouldn’t be surprised to see a move back towards the $112,000 support.📉
Patience is key, waiting for a clearer signal or a break from this range before taking any aggressive positions.

BITCOIN BTC BITCOIN , one more push into supply roof will see the price drop,a brake of the supply roof will be looking long.
#btc #bitcoin

Bitcoin - New rising wedge, you must see! 127k, then drop to 85kI am the first human on the internet to share with you this rising wedge pattern that is currently forming on Bitcoin. As you know, rising wedges are in general bearish patterns, so you can expect a pretty strong downtrend after this pattern is formed. But right now Bitcoin is strong, and I expect a new all-time high in the following weeks.
I know that there are many moon boys in the comment section calling for 300k, 500k, or even 1 million USD per bitcoin until the end of the year or 2026, but this is completely impossible. A much higher chance than that would be that the artificial moon explodes or ugly satanic Saturn explodes. So you can imagine that.
From a technical point of view, the falling wedge is somewhere in the middle of its formation; we don't know when it will end, but I expect this pattern to end sometime in the second half of Q4 2025. My Elliott Wave count suggests that we are in the final Wave (5)(5)(5), which is a pretty rare situation; it happens really only once every few years.
I think the ultimate top on Bitcoin could be around 127,000 USD for this bullish cycle, and I am pretty realistic here. If this falling wedge pattern breaks to the downside, there really isn't any strong support until 85k that can prevent Bitcoin from further falling.
Write a comment with your altcoin + hit the like button, and I will make an analysis for you in response. Trading is not hard if you have a good coach! This is not a trade setup, as there is no stop-loss or profit target. I share my trades privately. Thank you, and I wish you successful trades!

Bitcoin Analysis –> The Critical Resistance ZoneHello guys!
Bitcoin (BTCUSDT) has been moving within a well-defined ascending channel since early September, showing consistent higher lows and higher highs. Currently, price action is approaching a major resistance zone (highlighted in blue), around the $118,000 – $119,500 level.
----------Why the Blue Zone is Critical----------
This area has acted as a historical supply zone, where sellers have previously stepped in to push prices lower. It represents a significant hurdle for the bulls, and the next move from here could determine Bitcoin’s medium-term trajectory.
Bullish Scenario (Red Path):
If BTC breaks above the blue resistance area with strong momentum, it could confirm a breakout continuation. In this case, Bitcoin has the potential to test $120,000+ and eventually aim for new all-time highs (ATHs) within the ascending channel structure.
Bearish Scenario (Blue Path):
If the price fails to clear this resistance, a rejection could send BTC back to retest the channel’s lower boundary near $115,000–$114,500. Holding this support would be crucial to maintain the bullish structure. A breakdown from the channel would signal a potential trend reversal.
Key Levels to Watch
Resistance (Blue Zone): $118,000 – $119,500
Immediate Support: $115,000 – $114,500 (channel bottom)
Upside Target (if breakout succeeds): $124,000 – $125,000
Conclusion
The blue resistance zone is the make-or-break level for Bitcoin right now. A successful breakout could be the start of a new bullish leg toward ATH, while rejection here might trigger a healthy correction within the channel. Traders should closely monitor price action in this area before making directional decisions.

Bitcoin : Stay heavy on positionsBitcoin : Stay heavy on positions (2x~3x)
Maintaining the same outlook as before.
** This analysis is based solely on the quantification of crowd psychology.
It does not incorporate price action, trading volume, or macroeconomic indicators.
