BTC - Short Trade Update All is going to plan here. A good DCA entry for the short would be 116,800 zone
Expecting a drop straight to 35,000 from here.
This will definitely happen. At the risk of sounding insane, I have zero doubts about it.
Good luck to everyone.
- DD
BTCDOWNUSDT trade ideas

BITCOIN SIGNAL: ROUND 2 OF CRASH INCOMING!!!? (watch out) Yello Paradisers! Enjoy the video!
And Paradisers! Keep in mind to trade only with a proper professional trading strategy. Wait for confirmations. Play with tactics. This is the only way you can be long-term profitable.
Remember, don’t trade without confirmations. Wait for them before creating a trade. Be disciplined, patient, and emotionally controlled. Only trade the highest probability setups with the greatest risk to reward ratio. This will ensure that you become a long-term profitable professional trader.
Don't be a gambler. Don't try to get rich quick. Make sure that your trading is professionally based on proper strategies and trade tactics.

BTCUSDT-Point to Strong Bullish Setup at $112K SupportLooking at this weekly BTC chart, you can see Bitcoin has been consistently holding above the 50 EMA, acting as solid support each time it retraces back to it. The key point to note here is how the price has tested this zone multiple times, forming a strong area of confluence. Each time, Bitcoin has successfully bounced, showing a solid structure to keep the uptrend intact.
At this moment, Bitcoin is facing resistance around $126,000, but the market looks strong, especially with the EMA holding as support. If the price breaks this resistance, we could be in for another leg up towards higher targets. The price action here indicates that bulls are in control, and the current setup suggests there's a good chance we might see more upside soon, especially if the zone around $112,000 holds as support.
Keep an eye on the key levels: if BTC holds above the 50 EMA and the confluence zone, the next push could be significant.

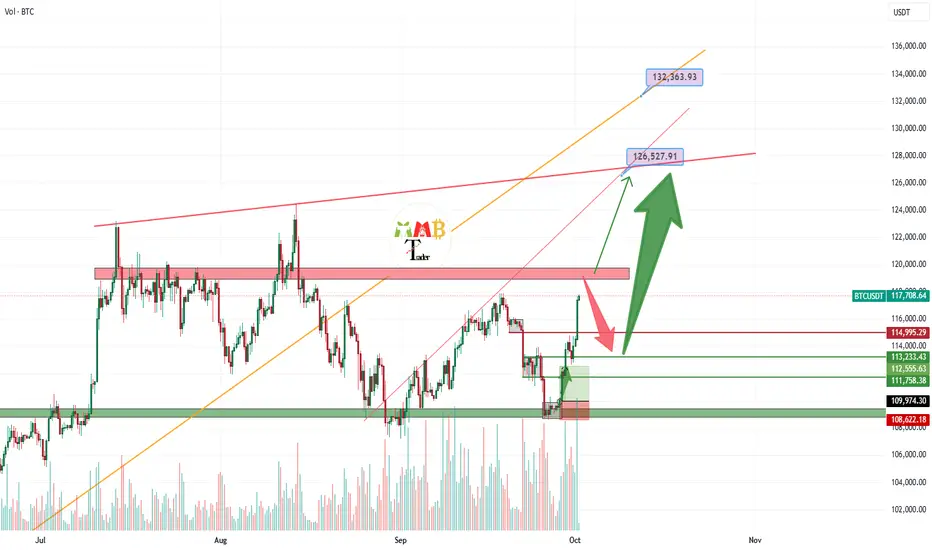
Bitcoin market is again bullish and target is 130K$ if 113K holdThe chart is easy to read the major resistance zone now is ahead and that is 119K$ resistance zone and price can rest there like previous time and we may have short-term fall near that resistance once again but if this time 113K$ to 115K$ hold strong as support then boom next phase pump will pump the price like green arrow to our target which is above 130K$.
also we may have breakout to the upside here without retesting 113K$ and then again we are looking for targets like 126K$ and more because as you can see market and bulls are getting strong once again.
DISCLAIMER: ((trade based on your own decision))
<<press like👍 if you enjoy💚
Bitcoin is at a crossroads — it’s either $128 or $122 and lower.Bitcoin is currently in a sensitive zone, closely watching Japan’s upcoming election — a potential victory by Sanae Takaichi could influence market sentiment. The FED’s meeting on October 29 also stands as a crucial event, though the primary focus is on whether the U.S. government shutdown will persist for too long. Technically, $122K acts as strong support, with $128K as the next key resistance. A healthy correction toward $118K could serve as a base for renewed upside momentum. Meanwhile, SOL, ETC, and LTC have yet to begin their upward moves, suggesting potential lagging rallies once BTC stabilizes.

BITCOIN Is Playing In a Crucial Area 📍 BTC (Higher Timeframe)
📉 Last night, the market witnessed one of the sharpest and most terrifying crashes in crypto history — and as most of you probably know, the fundamental reason behind it was the U.S. imposing a 100% tariff on Chinese products.
👉 In this analysis, we’ll take a comprehensive look at Bitcoin on the higher timeframes, so let’s get started.
📥 As shown in the chart, we’re facing a highly reliable trendline that has been forming since November 2022. Every time the price has touched this line, we’ve seen a strong bullish reversal.
📊 Last night, the price once again reacted to this trendline with a large wick and showed a solid rebound.
👉 In addition to that, there’s also a strong static resistance around the $107,000 level, and currently, the price is consolidating above this zone.
📥 Overall, from a technical perspective, no major structural change has occurred in Bitcoin’s chart, and if the price manages to break above the $123,000 level, it could potentially form a new high around $136,330.

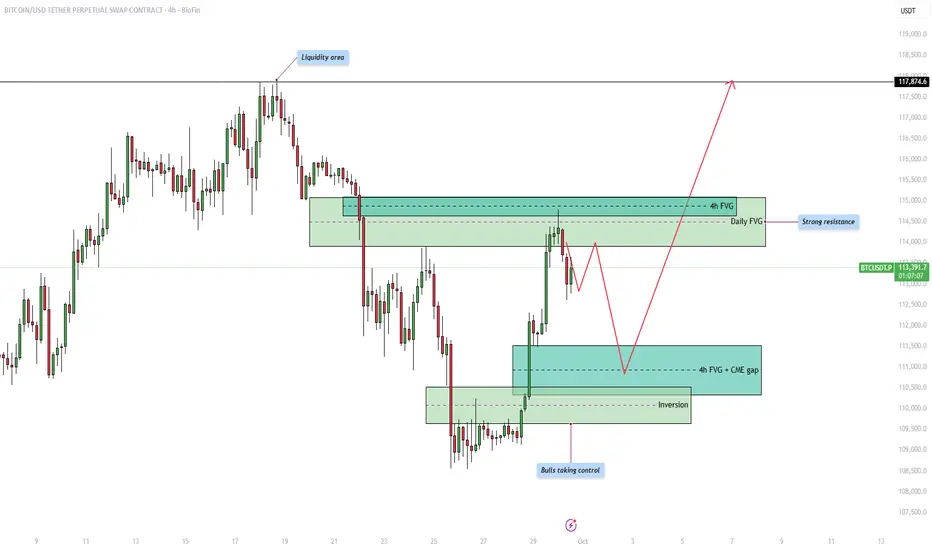
Bitcoin - Shortterm correction in the bullish trend!Introduction
The Bitcoin price action is currently moving within a structured range where both liquidity and fair value gaps (FVGs) are playing an important role in shaping potential market direction. By analyzing the chart, we can identify key areas of liquidity, resistance, and support that traders are likely to pay close attention to in the coming days. Understanding how price reacts around these zones will help anticipate whether bulls can maintain control or if bears will attempt to reclaim lost ground.
Upside liquidity
At the top of the range, we can see a clear liquidity area where price previously reversed. This liquidity pool represents buy-side liquidity, and the market could be drawn towards it as price seeks to sweep the highs. Liquidity is often targeted by the market before making a significant move in the opposite direction, which makes this area important to watch closely.
Resistance from the 4h and daily FVG
Before price can reach higher liquidity levels, it must contend with a strong resistance zone that overlaps with both the 4-hour and the daily fair value gap. This confluence strengthens the resistance, making it more likely that price will struggle to break through immediately. Traders will be watching for signs of rejection within this area, which could cause short-term pullbacks before any potential breakout.
4h FVG and CME gap support
On the downside, the 4-hour fair value gap aligns with the CME gap, providing a strong support level. This zone acts as an attractive area for price to retrace into before continuing higher. It is common for the market to return to such imbalances to fill inefficiencies, so a temporary dip into this support could serve as a healthy retracement before bulls attempt to push price further upward.
Bullish inversion
Another critical development is the inversion zone, where previous resistance has now flipped into support. This shift highlights that bulls are taking control of the market structure, strengthening the overall bullish outlook. As long as this inversion level holds, buyers are likely to defend it aggressively, reducing the probability of a deeper breakdown.
Final thoughts
Overall, the market remains in a bullish posture with upside liquidity acting as a magnet, but significant resistance awaits at the overlapping 4h and daily FVG. Short-term pullbacks into the 4h FVG and CME gap support are likely before the next major move upward. If the bullish inversion continues to hold, we could see a strong push towards the higher liquidity zones, potentially targeting levels beyond 117,000. The coming days will be crucial in determining whether bulls can maintain this control or if resistance proves too strong.
-------------------------
Thanks for your support. If you enjoyed this analysis, make sure to follow me so you don't miss the next one. And if you found it helpful, feel free to drop a like 👍 and leave a comment 💬, I’d love to hear your thoughts!
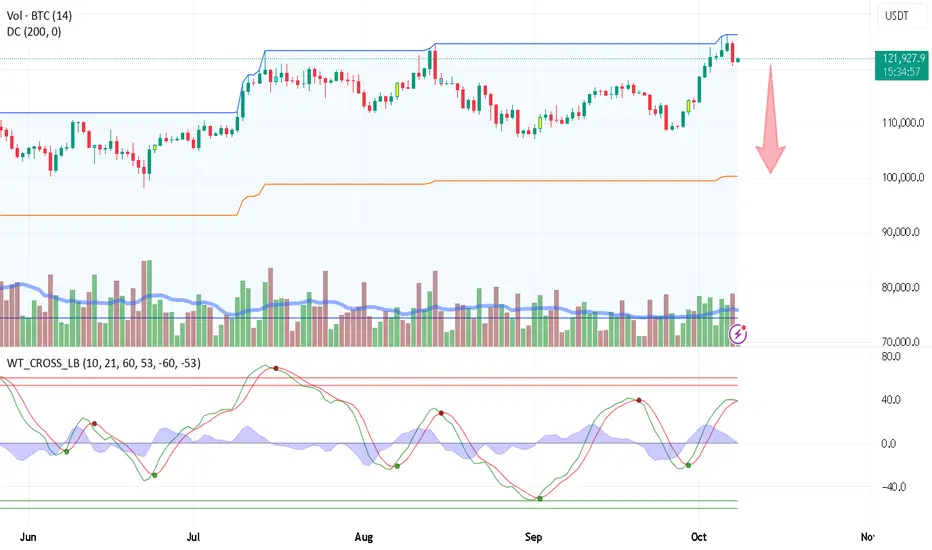
BITCOIN DAILY CHARTThe bitcoin daily loss is part of trading strategy, gains and losses is what comes with trading any instrument.
Macroeconomic Jitters Intensify Crypto Volatility as Global risk sentiment turned sharply negative after the U.S. announced new 100% tariffs on Chinese tech imports, reigniting fears of a prolonged trade conflict.
the current crypto downturn reflects a complex mix of macroeconomic headwinds, leveraged liquidations, and cooling sentiment after record-breaking highs.
key demand floors 107,829-107,500
key demand floor is 100,067 break and close sell into next demand structure.
key demand floor 98,849-98,733
key demand floor 94400-93760
key demand floor @54k-53k zone

Market Crash Was Beyond Our Control — Stay Calm and FocusedSometimes, things happen that are completely out of our control — and the recent market crash was one of them. Everyone’s feeling the pain right now, but it’s important not to lose your composure.
News events don’t define the market’s long-term trend; they only create temporary shocks. Think back to the COVID-19 crash — the market dropped sharply, consolidated for a while, and then began a massive bullish recovery.
If you’ve taken losses, don’t get discouraged. Stay focused and keep monitoring the market, because this is not the time to give up. It’s entirely possible that, just like in 2020, after a brief recovery period, the market will start climbing again.
When fear drives the market down, remember — a single piece of positive news can turn everything around.
⚠️ One key lesson: Always expect the unexpected in high-risk markets.
If you trade futures, make sure to use isolated margin mode to protect your capital and prevent total liquidation.

BTC The Liquidation Before the PumpIn the past 24 hours, the crypto market has experienced a significant wave of liquidations, with estimates ranging from several hundred million to over one billion USD. Bitcoin’s share of these liquidations appears relatively modest—amounting to tens of millions—while the majority of forced exits have occurred in altcoins and leveraged positions.
After briefly dipping toward the $100K level, Bitcoin’s price action formed a substantial downside wick, suggesting an area that sellers may look to retest should further downward pressure persist.
I’m currently watching for a potential scalp short opportunity just below $120K, as overall crypto enthusiasm—particularly in altcoins—appears to be fading. That said, even if the price revisits the $100K zone, I wouldn’t turn excessively bearish. Historically, similar periods of panic have coincided with major market bottoms, such as during the COVID crash, which ultimately preceded a parabolic rally.
Additionally, I’ve identified what may be a complex Elliott Wave structure known as a Triple Combination Correction, consisting of multiple ABC (three-wave zigzag) formations. Elliott characterized these as corrective patterns that often maintain mathematical relationships to preceding waves—relationships that can be measured using a trend-based Fibonacci extension across the three initial pivots. Traders commonly refer to such projections as “measured moves.”
This price behavior also aligns with Wyckoff’s principles of distribution, in which the secondary X-wave represents the UTAD (Upthrust After Distribution) before price retraces toward the origin of the W-wave.
For additional confluence, I’m monitoring key support areas such as the previous low VWAP. For now, however, my primary focus remains on observing the likelihood of a bounce between $98K and $100K, based on the outlined technical structures.

BTC market snapshotBTC — there’s a lot of talk online about a coordinated exchange dump, but I seriously doubt it. Exchanges have been clipping over-leveraged traders for years; why would they need a one-time dump? Traders will just come back anyway.
What I *do* believe in is the coordinated narrative — “HODL forever,” “altseason is starting,” “we’re rich already,” etc. — actively pushed by bot farms on social media, even during dips. That’s often the best strong-buy entry point. Buying *is* necessary, but selectively, and I’m not sure it’s the right moment yet.
From the current levels, there’s a chance for a slight rebound. I’m waiting for the formation of a consolidation range to better understand where to place the stop for my next short.

BTC (SHORT)BINANCE:BTCUSDT
SHORT
Entry 123 900
SL 126 300
T1 117 500
Golden Advices.
********************
* Please calculate your losses before the entry.
* Do not enter any trade you find it not suitable for you.
* No FOMO - No Rush , it is a long journey.

BTC/USD) Bullish trend analysis Read The captionMr SMC Trading point update
---
Technical analysis of BTC/USDT Bullish Reversal Setup (4H Chart)
Technical Overview:
Instrument: Bitcoin / Tether (BTC/USDT)
Timeframe: 4-Hour
Current Price: ~$114,842
Bias: Bullish Continuation
---
Chart Breakdown:
1. Fair Value Gap (FVG) Break & Retest Zone (Yellow Box):
Price has broken above a key FVG zone, suggesting a shift in market structure from bearish to bullish.
The current consolidation above this area indicates that buyers are defending the zone.
2. Structure Shift:
The recent break of lower highs marks an internal bullish market structure shift (MSS).
Pullback to the FVG zone offers a potential entry point for longs.
3. Target Point:
The projected bullish move points toward the $126,088 area, which aligns with a prior supply zone / liquidity pool.
This target represents an approximate +10% upside potential from current levels.
4. Trade Scenario:
Entry Zone: Around $114,000 – $113,500 (retest of FVG).
Target: $126,000 area.
Invalidation: Below $112,000 (if price breaks back inside FVG).
Mr SMC Trading point
---
Trading Insight:
This setup aligns with a Smart Money Concepts (SMC) perspective — price filled imbalance, broke structure, and now may seek higher liquidity zones. A successful retest of the FVG could trigger a strong bullish continuation toward the marked target zone.
---
Please support boost 🚀 this analysis

Where is #BTC support?📊Where is #BTC support?
🧠The market has seen a dramatic scene! The price has recovered, but most people have lost their money! This just goes to show the importance of risk management! I'm glad my expectations have aligned with market developments. Going forward, we'll continue to be bullish and focus on long positions. Long-term short positions should be sought above 132k.
➡️Based on the current structure, aggressive support is around 112,700, and extreme support is around 108,000.
🤜If you like my analysis, please like 💖 and share 💬
BITGET:BTCUSDT.P

BTC WILL NOT BE THERE🪙 CRYPTOCAP:BTC October 10th 😅 Straddle breakevens:
118000 & 127000
🪙 CRYPTOCAP:BTC October 17th 😅 Straddle breakevens:
116000 & 130000
σ Sigma probabilities:
October 10th
| σ | Multiplier × 😅 | Probability
| 1σ | 117000 & 128000 | ≈68%
| 2σ | 112000 & 133000 | ≈95%
October 17th
| σ | Multiplier × 😅 | Probability
| 1σ | 114000 & 131000 | ≈68%
| 2σ | 106000 & 139000 | ≈95%

Warning to all traders!Alright, let’s get real for a moment.
If you’re a trader and you’ve already BUY all your BTC around these levels , I’ve got one thing to say: you might wanna take a step back and think about what trading really means.
Because the essence of trading isn’t just “buy low, sell high.”
It’s about repeating that process — again and again — to stack profits over time. That’s the real game. Consistency beats luck every single time.
Now, let’s talk about this current Bitcoin situation.
BTC sitting around $121,000 — sounds wild, right? It took 15 years to climb to this level. But here’s the harsh truth: for it to go beyond $125K or $200K, there’s just not enough money flow to push it that high right now. Think about the sheer amount of liquidity it takes to move an asset like Bitcoin from $121K to $200K — it’s enormous. That kind of move doesn’t just happen because people on X (Twitter) are hyped. It needs massive capital inflows — and that’s not coming overnight. Maybe in 10 years? Maybe.
So, what’s the smart move here?
If you’re a real trader, your best window isn’t chasing Bitcoin at its all-time highs — it’s waiting for that 40% (60k ~80k~100k )dip.
That’s where you load up. That’s where the real profit is made. The crowd buys the top; the trader buys the blood.
I’m just a simple man with a head on his shoulders.
If I can see this, then believe me — even Michael Saylor can too. So, don’t let the hype blind you. Be careful out there, because the fall is coming, and if you don’t understand the trick — buy low, sell high, repeat — then maybe trading isn’t your game.
Stay smart. Stay patient.
And remember — profit isn’t made in the rush, it’s made in the cycle.
Good luck and good hunt!
BTC ( Long ) or (Spot)BINANCE:BTCUSDT
LONG & SPOT
Entry 117 800
SL 115 000
T1 131 700
Extra Targets 137 000 & 160 000 are optional
Golden Advices.
********************
* Please calculate your losses before the entry.
* Do not enter any trade you find it not suitable for you.
* No FOMO - No Rush , it is a long journey.

BITCOIN COME BACK TO 125.000 Lets Gooo Hey ,
After A Big Crash In Crypto We Follow Now Our Technical Analysis And Market Structure And We Have A Find A Bullish Bitcoin Setup For Longterm Holding
Buy Reason : QM
Buy Zone : 112.937 to 112.091
Target Old High : BSL
Hope You Gpt The Trade And Understand It

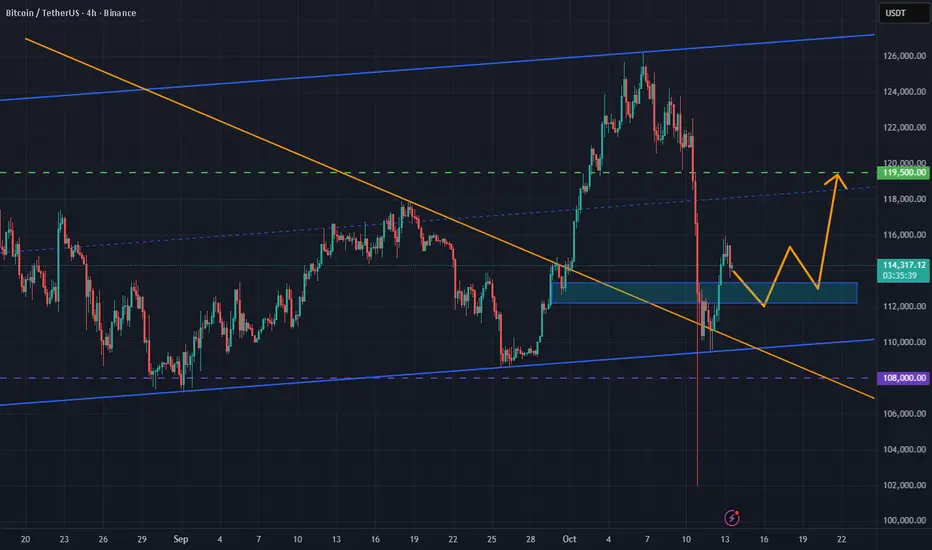
BTC/USDT:Sharp Rebound Signals Recovery Within ConsolidationRageBTC/USDT bounced strongly from the 102,100 support level following a flash crash, indicating renewed buying interest near structural lows. The pair continues to trade within a broad consolidation range, with 119,500 serving as a key resistance target.
A sustained break above the trendline could confirm recovery momentum toward the all-time high at 125,000. The recent flash crash may have cleared out weak hands, paving the way for market stabilization and potential re-accumulation.
BITCOIN IF YOUR CHECK MY LAST POST on bitcoin ,the analysis is 100% correct with little deviation ,the next is to wait for price at 117-116K
#bitcoin #btc #btcusdt

BTC market snapshotIn a few hours, there will be a pre-recorded speech by Jerome Powell, which means some people already know what he’s going to say.
There could be volatility since expectations are high. His speech won’t directly announce the interest rate decision, but even a hint will be enough to trigger panic in the current situation.
I’m holding a short.

BTC Technicals Point to Strong Bullish Setup at $112K SupportLooking at this weekly CRYPTOCAP:BTC chart, you can see Bitcoin has been consistently holding above the 50 EMA, acting as solid support each time it retraces back to it. The key point to note here is how the price has tested this zone multiple times, forming a strong area of confluence. Each time, Bitcoin has successfully bounced, showing a solid structure to keep the uptrend intact.
At this moment, Bitcoin is facing resistance around $126,000, but the market looks strong, especially with the EMA holding as support. If the price breaks this resistance, we could be in for another leg up towards higher targets. The price action here indicates that bulls are in control, and the current setup suggests there's a good chance we might see more upside soon, especially if the zone around $112,000 holds as support.
Keep an eye on the key levels: if BTC holds above the 50 EMA and the confluence zone, the next push could be significant.
DYOR, NFA
#PEACE

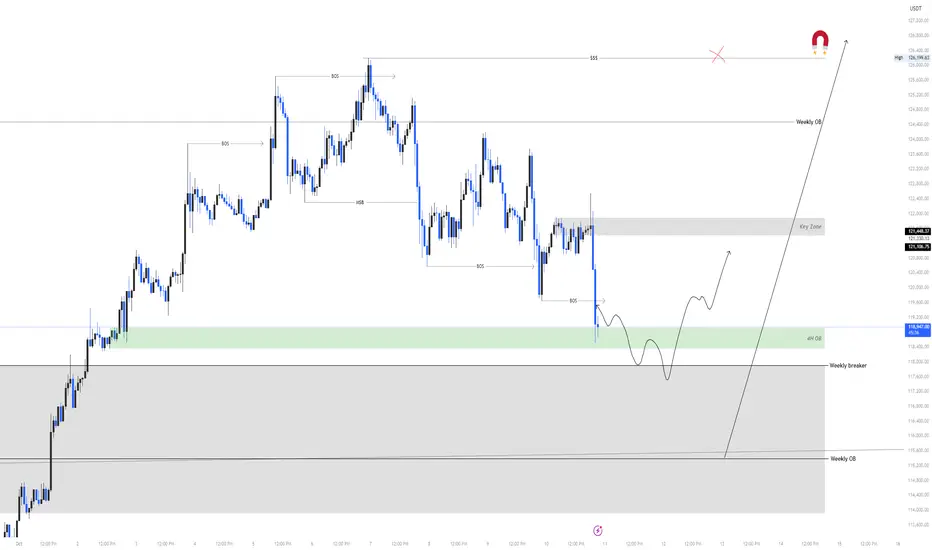
BTC Top Down Analysis! Let's break it out logically. Starting with Weekly TF CRYPTOCAP:BTC swept its ATH and dropped.
Two main reasons:
1- Liquidity grab (took out SLs above ATH)
2- Hit strong Weekly Bearish OB and reversed.
Now Weekly & Daily TFs are still bullish this is just a pullback so no panic scene.
Question is: how far can it go?
CRYPTOCAP:BTC is moving toward Weekly Breaker Block (117.9k) and Weekly Bullish OB (115.3k) right now it’s trading inside a 4H Bullish OB (Green Zone)
I’ll wait for reversal signs (CHOCH or Bullish OB) on STF to buy again. If confirmed I’ll buy with SL below 113.5k - 112.5k zone.
For now, STF is still bearish so I’ll wait I’m already in a CRYPTOCAP:BTC buy from 110k zone.
CRYPTOCAP:BTC is sitting in a 4h demand zone just wait for confirmation.