Positive Market - BTC Continues to Find New ATHBTCUSD Analysis
Bitcoin is currently testing the upper boundary of a long-term ascending channel, where price has previously faced rejection several times (as shown by the red arrows).
The market recently completed a strong rally toward 124K, aligning with the 1.618 Fibonacci extension (123,609) — a significant resistance zone that triggered selling pressure.
Key observations:
• Resistance area: Around 124K–125K, aligning with the upper channel line — potential for short-term correction.
• Support zones: The first support lies near 118,100, followed by 115,000–115,500, both acting as Fibonacci retracement zones.
• Possible scenarios:
1. Price may retrace toward 118K–115K to gather liquidity before another push upward.
2. If the market holds above 123K, a breakout toward 132K–133K could be confirmed.
Overall, momentum remains bullish, but the current zone requires caution — a short-term pullback is likely before the next major move.
BTCDOWNUSDT trade ideas

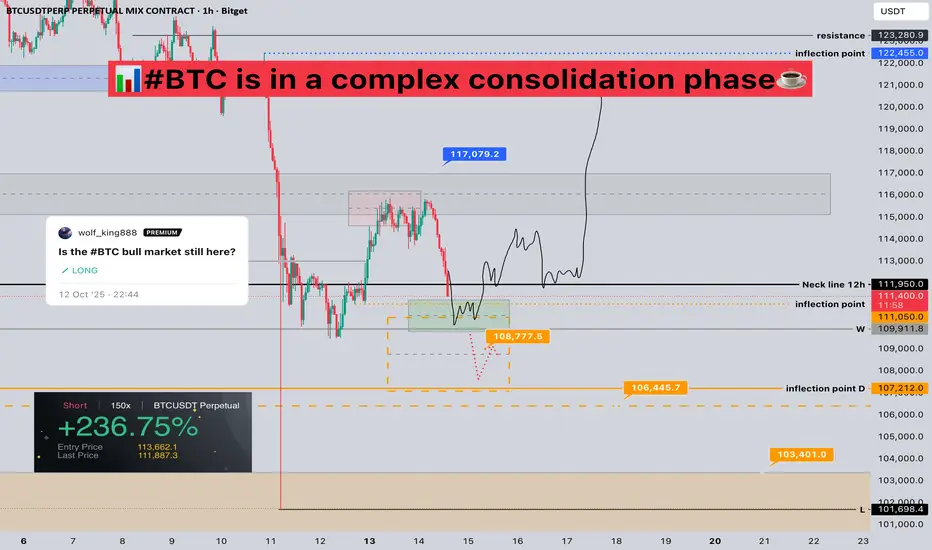
#BTC is in a complex consolidation phase📊#BTC is in a complex consolidation phase☕️
🧠From a structural perspective, we've encountered resistance at the gray resistance band and are now forming a double-top bearish structure. The aggressive support zone is 110,000-111,000, while the extreme support zone is 106,000-108,000.
➡️We've attempted some short trades at the overlapping resistance zone. The market is currently developing as expected. We're currently in a sideways consolidation phase, so we should prioritize range-bound trading!
➡️After most high-leverage positions are liquidated, spot trading opportunities will emerge. Based on previous similar events, it's only a matter of time before we continue to reach new highs. Therefore, the trading range worth participating in is 100,358-107,258, with the target being the ATH.
🤜If you like my analysis, please like 💖 and share 💬
BITGET:BTCUSDT.P
End of Bull run - Phase E We Are Approaching the End of the Bull Run
We can see that we are reaching the final stage of the current bull run, based on several technical and structural signals.
According to Wyckoff analysis, we are now in Phase E, where the distribution process usually begins.
We’ve witnessed massive liquidations right at the top — a classic sign of exhaustion.
I’ve drawn two yellow lines extended to the top of the chart: these represent the distance between the previous bull-run top and the last one.
I’ve copied and projected that same length forward, and once again, the market aligns almost perfectly — the move is complete.
Mathematics don’t lie.
The crypto cycle is driven by math, and this chart clearly illustrates that rhythm.
In my opinion, it may be time to start closing positions after this automatic rally —
(not financial advice, just an educational illustration).
Do your own research, trade responsibly, and keep an eye on the charts.
Happy trading,
Rafjs

BTCUSDT – ABC Correction Hey traders 👋
Bitcoin might be setting up for a strong move downwards after completing what appears to be a 5-wave impulse structure on the higher timeframe.
There’s also a clear RSI bearish divergence, suggesting that bullish momentum is fading and a correction could be near.
I’m currently expecting a medium-term ABC corrective phase, though it’s still uncertain whether it will develop as a classic zig-zag or a flat/flag-type correction.
🎯 Trade Plan (Short Setup)
- Entry Zone: 112,000 – 118,000 USDT
- Stop Loss: above 125,000 USDT
- Take Profit 1: 75,000 USDT
- Take Profit 2: 52,000 USDT
- Final Target (Wave C): around 43,000 USDT
⚡ Notes:
If BTC breaks below the previous wave 4 area with strong momentum, that would add more confirmation to the corrective scenario. However, if the market maintains higher lows, we could still see an extended B-wave or even a continuation of the uptrend.
📘 Reminder:
This is not financial advice — always DYOR and manage your risk properly.

#BTC Update | 12.10.2025🚨 #BTC Update | 12.10.2025 🚨
Bitcoin had a massive drop, making a deep wick near the 100K zone — a true disaster day for many traders with huge liquidations across the market 😬💥
As I mentioned in my previous analysis, once BTC lost the support at Arrow #1 and #2, the bullish momentum weakened, opening the door for a deeper retracement on the weekly timeframe.
📉 The weekly retracement zone was marked around 104,669, and guess what? — on Friday’s wick, price tapped it perfectly. 🎯
Now, the focus shifts to Arrow #3 and #4 — once the price breaks above these levels, we can look to re-enter buy positions confidently. ✅
Remember, on the bigger timeframes, the overall structure remains bullish, so this pullback could just be a healthy correction before the next leg up. 🚀
I expect a strong recovery move after Monday, which could confirm the breakout.
Next up 👉 I’ll post the #BTC.D and #ETH analysis, so stay connected, stay patient, and trade smart! 💪🔥
#Bitcoin #Crypto #Trading #BTCAnalysis #SwingTrade

#BITCOIN ANALYSIS I have been warning you for the last 45 days #BITCOIN ANALYSIS
I have been warning you for the last 45 days that a big dump was coming and now it’s playing out exactly. Bitcoin has already dumped around $20K and is now trading near 112K, right at the major resistance zone that has triggered every big correction since 2018.
A small bounce to 115K–116K is possible, but after that I expect another leg down toward 100K, and potentially lower to 90K.
I’m still holding my 50% short position. If anything changes or I close my position, I’ll update you. Remember I mentioned earlier that if BTC went back to 125K–128K, I would add more shorts and that plan hasn’t changed.
Till Monday, I expect some volatility, but Monday’s price action will give a clearer direction.
🔸 Weekly:
BTC touched the long-term trendline again → clear rejection happened.
👉 Until we get a weekly close above 125K, the risk of a major pullback stays high.
BITSTAMP:BTCUSD
🔸 Daily:
Price is inside the 110K–125K supply zone. Structure is weak.
If price breaks and resists below 110K, then 100K is the next target.
📊 My Trade:
✅ First target 105K hit
Holding 50% shorts, expecting a bounce to 115K, then lower.
📌 Downside Targets: 105K ✅ → 100K → 95K → 90K

What if...?A rising wedge pattern in the final stages makes sense to me. We've been trading up only since 2023 and past cycles always end before everyone keep waiting for the "last leg up" to sell. Why this time should be any different?

BTC/USDT Analysis. Will longs resume?
Hello everyone! This is CryptoRobotics trader-analyst, and here’s the daily market overview.
Yesterday, after we highlighted the absorption pattern on Bitcoin, the price slightly recovered and entered sideways consolidation, holding within the range for nearly a full day. The initial target at $124,000 was reached earlier than expected, but it formed the upper boundary of the current range.
At the moment, Bitcoin continues rotating within this range. The main expectation is a test of the local low and the buying zone at $120,400–$119,400 (selling absorption). If strong buying protection appears there, the potential will be aimed toward the all-time high.
If the reaction is weak or absent, we may see a decline toward ~$116,000.
Buy zones:
$120,400–$119,400 (selling absorption)
$116,700–$115,000 (pushing volumes, strong graphical imbalance)
$112,500–$111,500 (mirror zone, volume anomalies)
$110,000–$108,800 (strong selling absorption)
This publication is not financial advice.

BTC - Bullish BiasThe price aggressively consolidated around this zone, where the bulls are trying their best not to lose control. With Gold making an (ATH), it would be risky to short BTC here, as there is likely some more room for a move up remaining. When you see this type of accumulation wick in an uptrending market, you should know that institutions are accumulating. Although the current market sentiment is very bearish, I like to bet the opposite way. I might be wrong, but we will see. That is why we call trading a game of probability."
Another sure indication is that we are dumping liquidity just before the New York (NY) open, plus the UK session accumulated liquidity. This suggests a kind of lower time-frame bullish scenario for the duration of the NY open.

Bitcoin Cup and Handle Pattern!BTCUSDT technical analysis update
BTC is forming a cup and handle pattern on the weekly chart. The price is currently forming the handle, which could take 1-2 months to complete. Once the price breaks the neckline, we can expect a significant bullish move in BTC.
Regards
Hexa

Forecast for BTCUSDT 9th October 2026 (Updated)Forecast for BTC for the next 4 weeks. Quick decline to $120k followed by a bounce to ~$127k followed by continuation down to ~$104k for a bottoming before new all-time-high towards ~$150k-$170k.

LAST OG CYCLE - 2025 - Oct-Dec - 2026 - Jan-MarchMajor Update
BLITZ BULL -BY OG
OCT - 200K
NOV - 230K
DEC - 250K
AVG - 2025 - 220K BTC
AVG - 2026- Q1 - 275-330K BTC
Enjoy!

BITCOIN BTCUSDT The bitcoin daily loss is part of trading strategy, gains and losses is what comes with trading any instrument.
Macroeconomic Jitters Intensify Crypto Volatility as Global risk sentiment turned sharply negative after the U.S. announced new 100% tariffs on Chinese tech imports, reigniting fears of a prolonged trade conflict.
the current crypto downturn reflects a complex mix of macroeconomic headwinds, leveraged liquidations, and cooling sentiment after record-breaking highs.
key demand floors 107,829-107,500
key demand floor is 100,067 break and close sell into next demand structure.
key demand floor 98,849-98,733
key demand floor 94400-93760
#bitcoin #btc

#BTC/USDT Bullish Momentum: Will It Break Through Resistance?
#BTC
The price is moving in a descending channel on the 1-hour frame and is expected to break and continue upward.
We have a trend to stabilize above the 100 moving average once again.
We have a downtrend on the RSI indicator that supports the upward move with a breakout.
We have a major support area in green that pushed the price higher at 109860.
Entry price: 112045.
First target: 113534.
Second target: 115471.
Third target: 117400.
To manage risk, don't forget stop loss and capital management.
When you reach the first target, save some profits and then change your stop order to an entry order.
For inquiries, please comment.
Thank you.

BTCToday, BINANCE:BTCUSDT.P dropped by around 17%. It may fall further, or it may not — but one thing I know for sure: market panic has always been my most profitable time. When fear dominates and the entire market is crashing, that’s when the best opportunities appear.
If you panic — you’re far from professionalism. If you enter, take your profit, and calmly move on — that’s a sign of skill. In trading, professionalism isn’t optional; without it, you won’t survive — and sometimes that’s quite literal.
So, in times like these — when some made quick profits, others took heavy losses, and only a few truly gained — I’ll share a thought that changed my mindset years ago. After losing a significant amount, I realized that was the true cost of the trading education I once wanted to buy.
Trade with minimal risk and invest the rest in your learning — it’s always the right investment.
And just to be clear — I don’t sell courses, and this message isn’t for profit.
It’s genuine advice. Have a great day.

#BTC 4H Bearish Structure, Cautiously Bullish 📊 #BTC 4H Bearish Structure, Cautiously Bullish ⚠️
🧠From a structural perspective, we've broken below the yellow support zone, which has transformed into the blue resistance zone. This also indicates a bearish structure has emerged on the 4H chart, so caution with bullish sentiment! If price can rebound into the blue resistance zone, we could look for short opportunities.
➡️Interim support is around 118,000, with extreme support around 114,888 (if it reaches this level today, we could try to take some long positions).
🤜If you like my analysis, please like 💖 and share 💬
BITGET:BTCUSDT.P

BTCUSDT — Monthly Peak Confirmed: Distribution Phase BeginsBTCUSDT — Monthly Peak Confirmed: Distribution Phase Begins
Bitcoin has just flashed a Monthly Peak Confirmation, hinting that the market may have entered its distribution zone after a two-year bull run.
1. The Origin of the Wave:
The current bullish wave began on October 1st, 2023, when BTC traded around $34,639.
From that level, price climbed relentlessly until September 1st, 2025, marking a top near $119,000.
Anyone who bought at the wave’s origin would be sitting on more than $90,000 profit per BTC after almost two years.
2. Key Pullback Opportunities:
Throughout the uptrend, BTC offered three clear pullback entries:
June 5th, 2024
August 20th, 2024
April 12th, 2025
Each of these corrections gave profitable continuation entries before the final monthly peak.
3. Current Status (October 14th, 2025):
BTC trades near $115,000, only slightly below the all-time high.
However, the chart structure shows that Monthly Peak = Confirmed, implying the start of an ATH distribution phase — the moment when large holders quietly reduce exposure.
4. Forward Outlook:
We now anticipate a SWING SHORT setup developing on the Monthly timeframe.
Target: $77,000 — a long and deep retracement expected to unfold over several months.
This is not a flash crash scenario but a slow, heavy correction marking the end of the bull cycle and transition into consolidation.
Summary:
Bitcoin has completed its two-year impulse wave from $34K to $119K.
Monthly peak confirmed → distribution started → next macro opportunity lies on the short side.

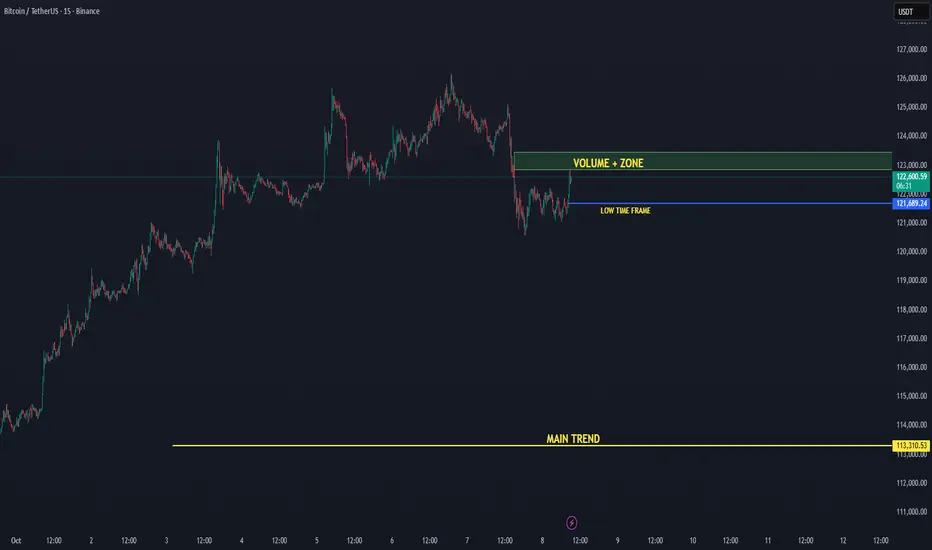
BTC/USDT — Low Time Frame Recovered, Eyes on Volume 08-10-2025Bitcoin has reclaimed its low time frame level near $121.6K, signaling renewed short-term strength. Price is now pushing upward toward the +Volume Zone, an area where increased buying activity could trigger a breakout continuation.
📈 Low Time Frame Reclaimed: BTC has stabilized above the local structure, confirming short-term bullish momentum.
🔊 Volume Zone Target: The next resistance sits around $123K, where increased trading activity could accelerate a move higher.
🟢 Main Trend Active: The primary uptrend remains strong as long as BTC holds above the $113K main trend support.
Technical Levels:
🟢 Main Trend Support: $113K
🟡 Low Time Frame Support: $121.6K
🔊 Volume Zone Resistance: $123K
🎯 Next Target: $125–$126K
Outlook:
Bitcoin is showing healthy recovery momentum, reclaiming short-term structure and heading into the Volume Zone. If it sustains above $121.6K and breaks $123K with volume confirmation, a continuation toward $125K+ becomes likely.
📊 Bias: Bullish continuation
📈 Focus: Volume reaction at $123K
BITCOINTHE ROOF connecting the two most current highs on 3hr close provided a perfect point of entry and the best rejection for the daily candle.the zone of 124,478-125k was rejected.
i dont know if its possible to return to 116-117k zone ,however should price comes to this zone we have a buy floor ,based on the break and retest rule.
break and close 124,478-125k will expose 135k-145k zone depending on the volatility +liquidity in the market.
dont forget that take profit is on the way for earlier investors, dont let them dump this coin on you.
GOODLUCK
#BTC #BITCOIN

Bitcoin Price Prediction: $351,000 Target Hi everyone! 😊
I've shared my Bitcoin analysis with you. Based on the RSI divergence with price, along with the formation of a cup and handle pattern, my final prediction for Bitcoin is reaching the target of 351,000 USDT. 🚀
However, I absolutely do not recommend long positions in futures trades due to the high risk from negative fundamental news. ⚠️
I hope you'll share your thoughts on this analysis! 💬
If you found this analysis interesting, give me some energy by liking it! 👍 Don't forget to share it with others! 🔄
Please note that trading responsibility lies with you, and my analysis is solely a personal opinion. 📝

DeGRAM | BTCUSD defended the $110k level📊 Technical Analysis
● CRYPTOCAP:BTC rebounded sharply from the 108K–109K demand zone, confirming strong buyer defense and maintaining the rising channel structure.
● Daily close above 111.5K turned previous resistance into support, setting the stage for a climb toward 123K as momentum strengthens.
💡 Fundamental Analysis
● Bitcoin sentiment improves as ETF inflows rise and the U.S. CPI outlook supports reduced rate hike expectations, boosting risk assets.
✨ Summary
● Long bias above 111.5K; target 123K. Technical recovery aligns with improving macro backdrop and renewed institutional demand.
-------------------
Share your opinion in the comments and support the idea with a like. Thanks for your support!

RSI Bullish Divergence on Bitcoin, Upward Move Likely to ComeAfter a strong retracement on HTF, Bitcoin has shown Bullish Divergence on RSI on 1H timeframe.
This is a buy opportunity. Let's try to take a 1:1 Buy-Stop trade here. Just don't take leverage. This is a low-risk trade. Let's see how it goes.

Bitcoin looks bullish. Target is 126 500. The market had hunted $19 billion liquidation on October 10th. In particular, the 1 billion liquidation in Bitcoin, which was at prices between 107,000 and 108,000, was never taken. It was clear that it would be bought with a wick. Had the candle closed within this price range, we would have faced a lower bottom. This would have generated bearish momentum in the market. Now, we see hunted liquidation, rising lows, a green candle engulfing the last daily red candle, and the last red candle closing higher than the previous green candle on the weekly chart. In other words, the bullish market structure remains persistent.
Leave comment if you agree or not and write you opinion.
