BTCMINI trade ideas

BTC.D Breakout Validates Bullish DivergenceOver the past few weeks, I’ve repeatedly highlighted the bullish divergence forming on BTC dominance. Now that dominance has started moving upward, we’re witnessing the impact — heavy bleeding across altcoins.
The rising BTC.D structure signals that capital is flowing back into Bitcoin, leaving alts vulnerable to sharp corrections. This trend could extend further if dominance continues to climb, putting additional pressure on weaker altcoin setups.
📊 Key takeaway: Keep monitoring BTC.D closely — as long as it strengthens, altcoins may continue to face significant downside risk.

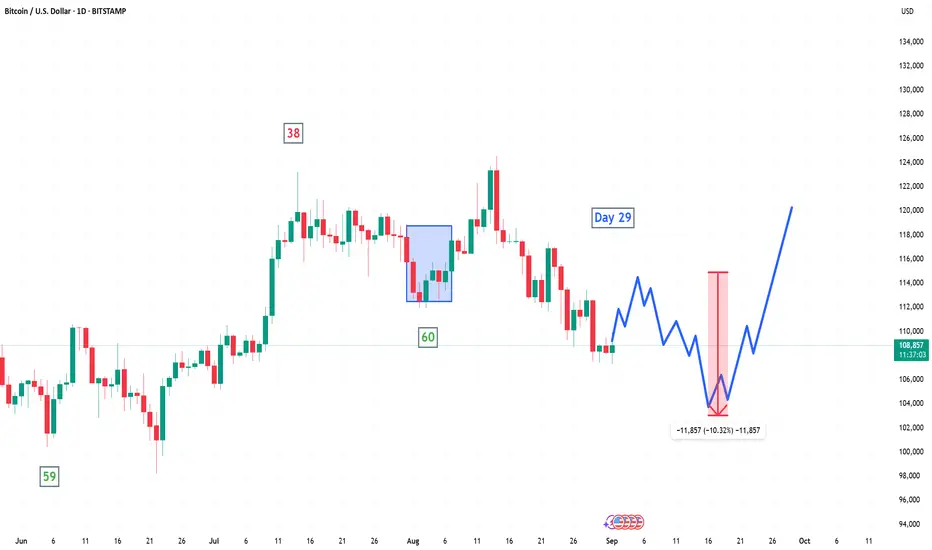
Bitcoin is going below $105kBitcoin is heading into the upcoming 60-day cycle low and is set to test the $105K area.
We might see a short-term pop toward $114K, but that level will act as strong resistance.
[BTC] Keep adding to the Bitcoin longAfter two great entries, I expect the price to reverse again on this level for new ATH with profit target at least at $135.000 but we will hold till a reversal confirmation happen at the "top" (or local top).
Great Trade !

BITCOINBTC is completing side ways correction move, its still not done yet and need some more time.
Disclosure: We are part of Trade Nation's Influencer program and receive a monthly fee for using their TradingView charts in our analysis.

BUY BTCUSDOur bearish channel has been broken which confirms that the buyers are now in control with all the change of the last structure of the market.

BTC/USDReversal/Bounce Setup (at D zone)
Entry: Near 100,500–102,000 (demand zone).
Stop-Loss: Below 98,500–99,000 (clear break of support).
Target 1: 107,000–108,000 (first bounce).
Target 2: 112,000 (C point retest).

BTCUSD 1D Bitcoin making new climbing plansAfter the summer correction Bitcoin is once again showing strength.
The chart is shaping a rising channel and the pullback to the 108500 support worked textbook-style.
Moreover, a breakout above 113000 will open the way directly to 125000.
Volume profile supports the buyers’ side while the price action looks like a healthy pause before the next impulse.
Fundamentally the backdrop stays bullish with institutional flows into ETFs and Fed rate cuts still on the table for year-end.
The irony is that while many were waiting for 94k or lower Bitcoin just secured its rope and started climbing higher.

New Bearmarket ideaHere we a have a deviation of an ascending channel, at these levels the market doesnt look lie itll have a hard sell off just yet and my overall look for bitcoin is about $26k to end this run. this bull market has been a tough pill for me to swallow but hey you live and you learn, its the only way to get better a the craft

BTCUSD PRICE UPDATEPrice is testing and rejecting the 112,312 level one more time.. technically, we can see how price previously tested and strongly rejected that level. Right now it’s reacting at the same zone. We are likely to see another selling pressure off of that level. Also, we can notice how the resistance level shares a nice confluence with a resistance channel trendline. This further shows high selling tendency around that price level.

Rejection from the 112 zone or a breakout of resistance?It’s true that Bitcoin has turned bullish in the lower cycle for a few hours, but the overall trend is still bearish, so taking a long position isn’t logical. Traders can either enter with a trigger since it’s a key resistance, or wait until this resistance is decisively broken.

Bitcoin upside brewing?Having completed something resembling a three-candle morning star reversal pattern, clearing downtrend resistance running from the record highs struck last month in the process, some upside may be on the way for bitcoin.
With RSI (14) breaking its downtrend and MACD starting to curl higher towards the signal line, there’s early evidence bearish momentum may be turning. That said, long setups still screen as going somewhat against the prevailing grain, so patience may pay when assessing bullish trades.
If BTC/USD breaks and closes above $112,000, longs could be established with a tight stop beneath for protection. The last attempted break ended in misery for longs, so risk management should be front and centre, including what to do with the stop if the price initially moves in your favour.
The August 28 high around $113,500 and the 50-day moving average both screen as potential targets, depending on desired risk-reward. If the latter were to be breached successfully, the probability of a run towards $117,000 resistance—where price struggled in the second half of August—would improve.
If the price cannot push and close above $112,000, the bullish setup is invalidated.
Good luck!
DS

Bitcoin new higher highduring january my prediction was that Bitcoin will reach $120 000 as all ime high these year but we actually reached that in Mid year now i have moved to new all time high of $150k by the end of the year

Bitcoin Under Pressure: Downside Risks IncreaseMarket Overview:
BTC/USD is trading around $109,400, remaining within a clear bearish channel. The five-wave correction structure suggests sustained selling momentum. The failure to break above $111,997 adds pressure to the downside.
Technical Signals:
Clear descending channel.
EMA (144) acts as dynamic resistance.
Wave structure points to further downside potential.
Key Levels:
Support: $106,800 – $105,000 – $100,400
Resistance: $111,997 – $113,000
Scenario:
Main: continuation lower towards $106,800 and $105,000.
Alternative: a recovery above $112,000 could trigger a test of $113,000.
Conclusion:
As long as Bitcoin remains within the channel, sellers are in control. The upcoming test of $105,000 support will be crucial in determining whether buyers have the strength to hold the market.

Btc levels Btc has broken the 109,740 level after dipping down to 107483 111448 is next resistance move stops up to lock in profits if you are long we need to hold 100008 to continue uptrend

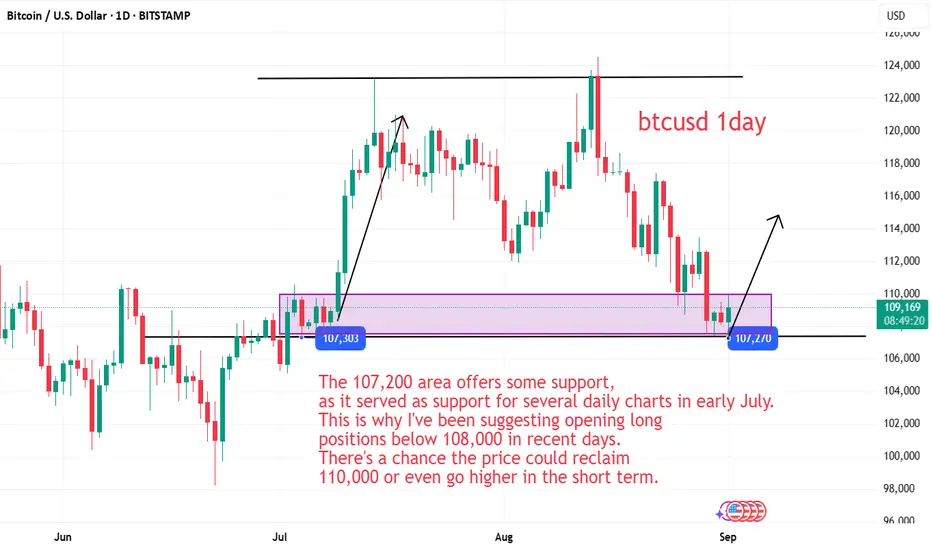
Bitcoin Strategy: An Accelerated Rally is ComingBitcoin has been fluctuating sideways for three consecutive trading days, with limited daily fluctuations. It has been unable to break through the short-term resistance level of 110,000, nor has it been able to break through the support level of 107,200. Therefore, it's crucial to closely monitor market trends over the next two days. Breaking through resistance or support could trigger significant price fluctuations.
The 107,200 area offers some support, as it served as support for several daily charts in early July. This is why I've been suggesting opening long positions below 108,000 in recent days. There's a chance the price could reclaim 110,000 or even go higher in the short term.
Bitcoin Strategy
Bitcoin's market volatility has been minimal over the past few days, and my strategy hasn't changed. I've been suggesting opening long positions below 108,000 for several consecutive days. If I continue with my strategy given today's trend, I can expect to see some profit today. Yesterday, I issued a reduction warning near 110,000, and I steadily reduced my holdings to preserve my profits. In the short term, I personally tend to be bullish on a rebound in Bitcoin. First, I will observe whether the resistance of 110,000 can be broken through. If it breaks through, I will look to around 112,000.
Bitcoin - Will Bitcoin Continue to Fall?!Bitcoin is below the EMA50 and EMA200 on the four-hour timeframe and is in its long-term ascending channel. There are two ways to look for Bitcoin buying opportunities:
• A valid break of the downtrend line
• Bitcoin reaching the demand range
It should be noted that there is a possibility of heavy fluctuations and shadows due to the movement of whales in the market and capital management in the cryptocurrency market will be more important. If the downtrend continues, we can buy in the demand range.
Starting Thursday, the U.S. government has launched a new initiative to publish macroeconomic data through public blockchains. The project, implemented by the Department of Commerce in partnership with oracle protocols Chainlink and Pyth, includes six key indicators from the Bureau of Economic Analysis (BEA), such as real Gross Domestic Product (GDP), the Personal Consumption Expenditures (PCE) price index, and final sales to private domestic purchasers.
These datasets will be updated on a monthly or quarterly basis depending on the indicator and, in the initial rollout, have been published across ten major blockchains, including Arbitrum, Avalanche, Base, Botanix, Ethereum, Linea, Mantle, Optimism, Sonic, and ZKsync. The official statement further noted that the data will also be accessible via networks such as Bitcoin, Ethereum, Solana, Tron, Stellar, Avalanche, Arbitrum, Polygon, and Optimism.
To ensure authenticity and immutability, cryptographic hashes of the data are recorded on blockchains. This method is intended as a complementary channel for releasing economic information rather than a complete replacement for existing systems. Major exchanges such as Coinbase, Gemini, and Kraken have contributed by supplying the cryptocurrencies needed to pay transaction fees.
Howard Lutnick, the U.S. Secretary of Commerce, stated: “We have made America’s economic truth immutable and globally accessible. The 3.3% GDP growth is also remarkable.” This initiative is part of the Trump administration’s broader cryptocurrency policy, which supports U.S.dollar-backed stablecoins and promotes the use of blockchain technology to reduce costs and enhance government transparency. In line with this direction, the Government Productivity Department, led by Elon Musk, has also conducted related studies.
Since the beginning of the current year, precious metals have been leading the gains across financial markets. Silver has claimed the top spot with an impressive 32.2% increase, marking the strongest performance over the past eight months. Gold follows in second place with a 29.5% gain; despite its sideways movement in recent months, it still ranks among the best-performing assets. The third position goes to Bitcoin, which posted a 19.2% rise. Without the recent price correction, Bitcoin might have overtaken silver’s leading position. Expanding global liquidity and a roughly 10% decline in the value of the U.S. dollar have been key drivers pushing investors toward hard assets.

BTCUSD Outlook – Monthly Open AheadTomorrow we get a new monthly candle on BTCUSD. Last month price didn’t trade higher after the rally in April, May, July and August. It’s sitting in a breather position. The dollar has been dumping too after a massive rally, so both markets are in reset mode.
Last month’s low is still intact, not traded through or attacked, which keeps that level important. For now we take it day by day — watching dollar data and order flow on Bitcoin to spot which side shows weakness first.
Big flush last week took BTC from 117K to 110K on whale selling and forced liquidations. That shows leverage risk is still high. But at the same time more than $400M flowed into spot ETFs, showing real demand under the surface.
If flows stay strong and the dollar keeps soft, BTC can bounce back toward the highs fast. If we see more liquidations or a dollar squeeze, then 105K–110K stays the key support zone.
We stay in eagle mode — patient, one day at a time, waiting for clean signals.

Sell Plan – BTCUSDSell Plan – BTCUSD
Entry planned around 109,500 zone after price tapped supply and showed rejection.
Stop Loss will be kept above the rejection area (109,600 – 109,700) to stay safe.
First target at 108,500 liquidity level, where price may react.
Second target at 106,400 – 106,300 swing low, aiming for deeper liquidity.
Narrative: Market swept upside liquidity, tapped into premium supply, and rejected strongly, giving confirmation for a sell.

BTCUSD: Strong Bearish Sentiment! Short!
My dear friends,
Today we will analyse BTCUSD together☺️
The recent price action suggests a shift in mid-term momentum. A break below the current local range around 111,056.43 will confirm the new direction downwards with the target being the next key level of 110,877.66 and a reconvened placement of a stop-loss beyond the range.
❤️Sending you lots of Love and Hugs❤️

Bitcoin Analysis and Strategy: The Rally is Still to ComeBitcoin Analysis
The weekend market saw minimal volatility, hovering between 110,000 and 111,500 points. Since the sharp drop on August 29th, the market has stabilized, with support around 107,200 holding firm. This is because it marked the lowest point of the sideways movement from July 4th to 8th. This level is a proven support point and served as the starting point for the previous rally to a high of 123,200. The recent rebound was driven by buying at this support level. In the short term, we should continue to look for a rebound based on this level. As long as the previous double bottom remains intact, the market will continue its upward trend. I am optimistic about a continued Bitcoin rebound.
Strategy
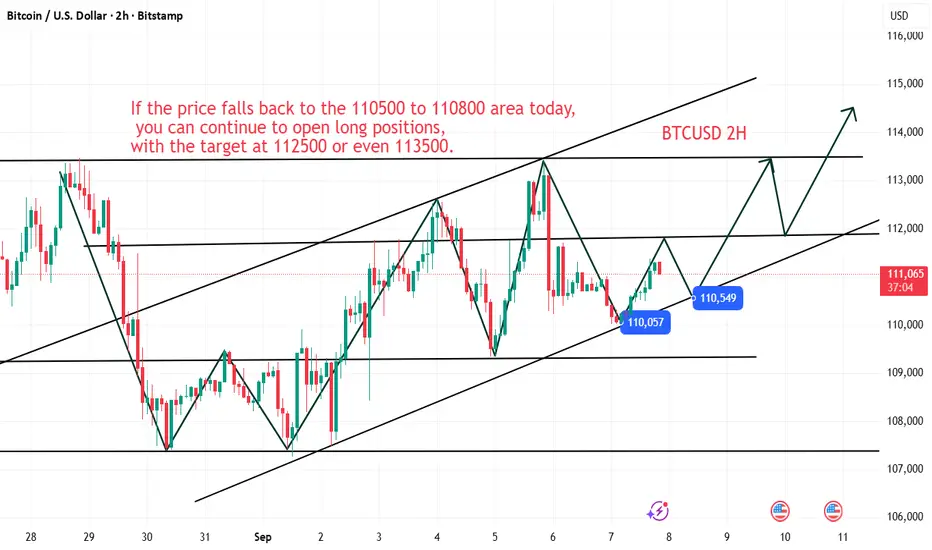
Recently, we have maintained a bullish stance. Long positions can be opened freely below 110,000. Yesterday's recommended entry point was 110,570. While the current rebound hasn't been significant, profits have already been realized. If the price falls back to the 110500 to 110800 area today, you can continue to open long positions, with the target at 112500 or even 113500.
BTC Long ideaNot investment or financial advice.
Since June of 2022 we have been in an ascending channel.
The August 2024 bottom has retested the top of Jan 2024 top, the March of 2024 top has been retested by April of 2025 bottom, and we are now sitting at an inflection point where the market is forming an inverse head and shoulders on the daily timeframe, testing the top of Jan 2025 highs. We're also at the bottom of the channel (or nearing very close). I think it's quite possible that we CAN drop to 102k ish to fill the order block, or we can go to the top of the channel here.
Long idea here; what you do not want to see is a break down of the channel and retest ,followed by a swing lower successfully denying the existence of the channel.
If this is to follow current market trends, we can see a high point of 272,000 during Feb of 2026.
Not financial advice or investment advice, or anything of the sort.
This final wave (if MM's decide to let it break up one more time) will be the final wave for this cycle on BTC before heading into a bear market.

Ignore the FUD...$BTC is ripping higher soonJust like Every multi week
BTC correction, sentiment on crypto twitter has gone south quickly
With many of the biggest accounts calling this the cycle top
But I beg to differ...All signs (both technical and fundamental) are pointing to another leg higher in 2025-2026
WIth the most obvious being the corrective channel
BTC
has been in since Last month
With almost the same playbook at the June correction playing out
-BTC moves down after minimal consolidation
-BTC then retests ATH
-Gives us one more fresh low, before moving higher
I believe BTC has either bottomed out or is very close
and will rip to 150k+ on this next leg
Not to mention regulatory clarity, and institutional adoption makes this most bullish fundamental environment ever for
BTC
Send this baby to 150k
