Bitcoin Wave 3 of 3 Down after Double Combination Wave 2This is an update on the Bitcoin Elliott Wave counts. Basically, the idea is still short but this time, you can slightly adjust the stop down to $113,750. The price target is still the same at $98,400.
Over here, I updated the most recent wave down as sub-wave 1 of 3, and also the recent move up as sub-wave 2 of 3. At the moment, sub-wave 3 of 3 is on-going.
Good luck!
BTCMINI trade ideas

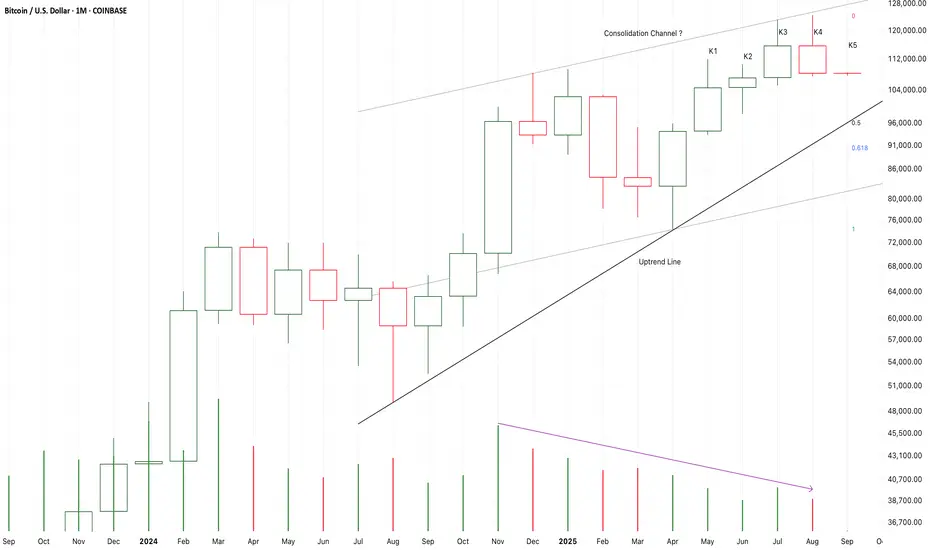
Bitcoin Monthly Candle Colour closes since 2013 - August Close
August closed RED and so now we have 10 red closes to 5 Green.
This has closed the possibility of continuing the pattern we had been following.
The Dashed line Boxes show us The only 2 occasions where we have had a Green December, Red January, Red February, Green March, Green April.
Then we had a Green May 2012 and a Red May 2020
Then both repeated a Green June, Green July.
They both also had had Green August but we just closed Red.
This breaks this sequence for me but I will keep the boxes in place for now just incase we revert back to Sequence.
The horizontal arrows are pointing to the previous 9 Red August Closes.
Where you see 2 Arrows is where this was followed by a Green September. This happened 4 times.
Note those double arrows on the left are in the 2016 build up to 2017 ATH and the ones on the right are in the Current cycle.
September Candle close count is currently is 5 Green to 9 Red, the same as August was.
Of those 5 Green September closes, 4 were after a Red August.
The other Green September was in the 2020 run up to the March 2021 ATH ( Middle dashed box)
Odds are on for a Red September as we see Bitcoin falling below some serious support levels but we should also note how PA is remaining above the 100k line for now.
August and September are traditionally months of Holidays and so trading slows, hence the majority of Red candles
Q4 is the ones to wait for and as you can see from the colour counts, Q4 is usually Bullish
We wait - we Hold and if PA Drops to the possible 104K line where the 200 day SMA sits, I will Buy More.
Scale in

Chart Pattern Analysis Of Bitcoin.
After K3 break up the previous higher high,
K4 return back immediately.
It seems that K3 was a potential fake up candle,
But it must be verified by K5.
I am expecting a doji candle of K5 close at low price area to terminate the three years bull market here.
If I bought it earlier,
I will try to cut off most of my long-term positions and even try to buy MSTZ to short it.
On the other hand,
If K5 close at high price,
The following candles will test 128K area or even break up it.
Long-88K/Target-98K/Stop-87K
Short-115K/Target-89K/Stop-116K
Will BTC goes to 63K Level?Hey traders! 👋
Here's a quick and simple look at BTC/USD 👇
Disclaimer on, This is a personal opinion, I am not responsible on your trading results. Trade with your own risk.
🔹 Key Resistance at $63K
This level has acted as a strong resistance zone before and now aligns perfectly with the major trendline intersection. This makes $63K a crucial level to watch closely.
🔹 Price vs Volume Divergence ⚡
Currently, we're seeing something interesting:
Price → moving UP 📈
Volume → moving DOWN 📉
This kind of divergence often hints at a potential trend reversal. So, while the price looks bullish on the surface, decreasing volume could signal weakening momentum.
⚠️ Takeaway:
Stay alert around this area — a breakout could be strong, but a reversal is also on the table. Manage your risk wisely! 🛡️
What do you think? Will BTC break above $63K or pull back from here? Share your thoughts below! 💬👇

SELL BTCUSD for bullish divergence trend reversal STOP LOSS: 116SELL BTCUSD for bullish divergence trend reversal STOP LOSS: 116,945
Regular Bearish Divergence
In case of Regular Bearish Divergence:
* The Indicator shows Lower Highs
* Actual Market Price shows Higher Highs
We can see a strong divergence on the MACD already and There is a strong trend reversal on the daily time frame chart.....
The daily time frame is showing strength of trend reversal from this level resistance so we are looking for the trend reversal and correction push from here .....
TAKE PROFIT: take profit will be when the trend comes to an end, feel from to send me a direct DM if you have any question about take profit or anything
Remember to risk only what you are comfortable with........

BTC/USD: Bitcoin Set to Explode?As of August 27, 2025, Bitcoin (BTC) is trading at approximately $111,612, reflecting a slight daily increase. The cryptocurrency market has experienced notable developments recently, influencing both short-term price movements and long-term trends.
The U.S. government's establishment of the Strategic Bitcoin Reserve in March 2025, under President Trump's executive order, has significantly impacted market sentiment. This move positions Bitcoin as a national reserve asset, with the U.S. Treasury holding an estimated 198,000 BTC. Such institutional adoption has bolstered investor confidence, contributing to Bitcoin's recent price surge to over $124,000 earlier this month...
Additionally, the rise of Bitcoin Treasury Companies (BTCs), such as MicroStrategy, which now holds around 630,000 BTC, has further reduced available supply on exchanges. Reports indicate that Bitcoin availability on exchanges fell below 15% in July 2025, a low not seen since 2018. This scarcity has intensified demand, driving prices higher.
Bitcoin is currently consolidating between the $112,000 and $115,000 levels. The 50-day exponential moving average (EMA) near $114,000 has acted as a resistance point, while support is observed around $110,000. A breakout above $115,000 could pave the way for a retest of the $120,000 to $125,000 range.
Conversely, a decline below $110,000 may lead to further downside, with potential support levels at $108,000 and $105,000. The Relative Strength Index (RSI) is hovering around 42, indicating that the market is not overbought, allowing room for upward movement.
*Bitcoin's market is currently characterized by strong institutional support, reduced supply on exchanges, and positive regulatory developments. While short-term fluctuations are possible, the overall trend points towards continued growth. Investors should monitor key support and resistance levels, as well as macroeconomic indicators, to navigate the evolving landscape effectively.
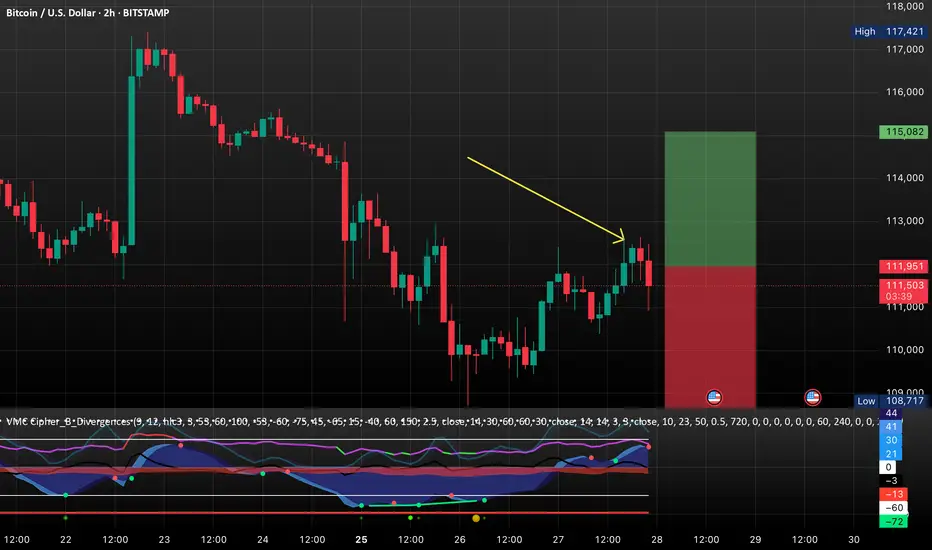
Full Sideways Range Activated · Bitcoin Continues BullishWe are looking at a repeat of May-June. Bitcoin just activated its full long-term, sideways consolidation range. When the lower end of this range is activated, support, we are very likely to see a market reaction in the inverse direction. See the green zone on the chart and from this point forward prices start rising.
There is the possibility of lower, just a bit lower. And this can happen slowly just as it can happen in a flash. It can happen. Right now though we are focusing on a swift, fast and strong recovery. That is, we are betting that there won't be lower prices while at the same time prepared if lower does show up.
Since we keep a map of the bigger picture, a longer or stronger retrace is not a problem because we know that the market will continue to grow. Instead of going SHORT at this point, which can certainly produce a loss of focus, we wait for support and go LONG.
Since $110,000 is already a strong support zone, we are active. Right now $110,000 is obviously resistance because the action is happening below this level. There is something important to keep in mind, keep reading below.
What Bitcoin is actually doing is consolidation. You can focus on Bitcoin, track Bitcoin and lose focus of the altcoins and even while Bitcoin consolidates the altcoins continue to grow. This is my next task.
I will show you many altcoins that are going bullish right now, the last three days, sometimes more. At the time same, from this chart, you can see how Bitcoin has been moving lower since the mid-portion of this month. This disparity reveals what comes next.
A bearish move from $120,000 to $80,000, for example, would be a very strong correction bear market size. As soon as this move starts to develop, if it were happening, the altcoins would either explode into a massive bull market, or would crash that many times harder than Bitcoin. None of this is happening now.
As Bitcoin retraces within a wide range, the altcoins market continues simply to grow slowly, build up bullish momentum, and consolidate. That's all there is and I will now show you some charts.
With all that said, know that we are clear, sure and certain that the best portion of the bull market is yet to come. It is still early, we are missing the bull run phase. Basically, the bull market is still yet to happen, we have to wait for the fireworks and after the fireworks, we have dance, drinks and food and then the bull market ends. In this analogy, we are still at the early stages. Patience is key.
Namaste.

28.08.25 BTC/USD Bearish Pressure Mounts — Next Target $107,000Bitcoin: Bearish Pressure Mounts — Next Target $107,000
Market Overview:
Bitcoin continues its decline after multiple failed attempts to hold above $116,000. The price has formed a five-wave Elliott structure, reinforcing the bearish momentum. The focus now shifts to the $107,000–106,500 support zone, where buyers may show renewed interest.
Technical Signals & Formations:
Elliott Waves suggest completion of corrective wave (5).
EMA (144) remains above current price, acting as resistance.
Overall structure signals sustained bearish pressure.
Key Levels:
Support: $107,000 – 106,500
Resistance: $114,800 – 116,000
Scenario:
Main (bearish): decline towards $107,000 with potential test of $106,500.
Alternative (bullish): breakout above $116,000 could attract buyers and push BTC towards $120,000.

BTC 114-114.70K Resistsance to WatchMorning Folks,
Our recent plan worked nice - 108.40$ target is done. Not occasionally we called to not set too deep targets because of strong 105-108K support area. Which, honestly speaking has decisive meaning for BTC.
Now we keep an eye on 114-114.7K resistance area. Potentially it might be interesting for bearish position taking. Although more precisely we could say if market will get there.
Bullish ideas might interesting only if BTC returns to ~118K top. In this case reverse H&S pattern might start forming. But, since liquidity pressure in the US continues we do not count on this scenario right now. More probable that in nearest 1-2 weeks BTC spends in sideways action.

BTC bullish OUTLOOK FOR PREVIOUS SETUPSA complete wave1 has just concluded. We expect a correction before the wave2 sets in. At the moment let's milk the correction

Btc levels Btc levels are still holding tight ive gave all the prices within 1% but I was wrong with the 113722 call but the levels will not will not let you down if we don't hold 108218 or 107924 we will go to 104868 says the GMC

BTCUSD Faces Mid-Band Rejection: Deeper Retracement incoming Price is showing rejection around the mid-range of its volatility bands after failing to sustain above the $112,800 zone, suggesting a potential continuation lower. The setup aligns with multiple bearish signals favoring downside momentum.
✅ Bearish Confluences:
Fibonacci Resistance: Price rejected just below the 38.2% retracement level at $114,619, failing to reclaim higher ground.
Lower High Structure: Market continues to print lower highs, reinforcing the short-term bearish trend.
Volatility Band Pressure: Rejection from the mid-band area highlights weakening buy-side momentum and strengthens the case for further downside.
🎯 Fibonacci-Based Targets:
TP1 – $111,016 (38.2%): First support test within the lower range.
TP2 – $109,903 (61.8%): Deeper retracement target in line with bearish continuation.
TP3 – $108,102 (100%): Full measured move completion toward the lower volatility band.
SL: Placed above $114,620 to invalidate the short thesis in case of bullish breakout.

BTC Aug. 29, 2025The information and publications are not meant to be, and do not constitute, financial, investment, trading, or other types of advice or recommendations.

BTCUSD corrective pullback supported at 109,040The BTCUSD remains in a bullish trend, with recent price action showing signs of a corrective pullback within the broader uptrend.
Support Zone: 109,040 – a key level from previous consolidation. Price is currently testing or approaching this level.
A bullish rebound from 109,040 would confirm ongoing upside momentum, with potential targets at:
115,420 – initial resistance
117,400 – psychological and structural level
119,260 – extended resistance on the longer-term chart
Bearish Scenario:
A confirmed break and daily close below 109,040 would weaken the bullish outlook and suggest deeper downside risk toward:
106,470 – minor support
104,340 – stronger support and potential demand zone
Outlook:
Bullish bias remains intact while the BTCUSD holds above 109,040. A sustained break below this level could shift momentum to the downside in the short term.
This communication is for informational purposes only and should not be viewed as any form of recommendation as to a particular course of action or as investment advice. It is not intended as an offer or solicitation for the purchase or sale of any financial instrument or as an official confirmation of any transaction. Opinions, estimates and assumptions expressed herein are made as of the date of this communication and are subject to change without notice. This communication has been prepared based upon information, including market prices, data and other information, believed to be reliable; however, Trade Nation does not warrant its completeness or accuracy. All market prices and market data contained in or attached to this communication are indicative and subject to change without notice.

BTC potential Roadmap for the Next 2 WeeksThere will potentially be 1 more leg down to complete the 5 wave move and sweep the low. The current bounce doesn't seem strong enough.

Bearish continuation?Bitcoin (BTC/USD) is reacting off the pivot which is a pullback resistance and could drop to the 1st support.
Pivot: 112,442.83
1st Support: 107,898.67
1st Resistance: 114,633.18
Risk Warning:
Trading Forex and CFDs carries a high level of risk to your capital and you should only trade with money you can afford to lose. Trading Forex and CFDs may not be suitable for all investors, so please ensure that you fully understand the risks involved and seek independent advice if necessary.
Disclaimer:
The above opinions given constitute general market commentary, and do not constitute the opinion or advice of IC Markets or any form of personal or investment advice.
Any opinions, news, research, analyses, prices, other information, or links to third-party sites contained on this website are provided on an "as-is" basis, are intended only to be informative, is not an advice nor a recommendation, nor research, or a record of our trading prices, or an offer of, or solicitation for a transaction in any financial instrument and thus should not be treated as such. The information provided does not involve any specific investment objectives, financial situation and needs of any specific person who may receive it. Please be aware, that past performance is not a reliable indicator of future performance and/or results. Past Performance or Forward-looking scenarios based upon the reasonable beliefs of the third-party provider are not a guarantee of future performance. Actual results may differ materially from those anticipated in forward-looking or past performance statements. IC Markets makes no representation or warranty and assumes no liability as to the accuracy or completeness of the information provided, nor any loss arising from any investment based on a recommendation, forecast or any information supplied by any third-party.

Potential bearish drop?The Bitcoin (BTC/USD) has rejected off the pivot which acts a a pullback resistance and could drop to the 1st support.
Pivot: 112,875.12
1st Support: 109,694.37
1st Resistance: 117,327.94
Risk Warning:
Trading Forex and CFDs carries a high level of risk to your capital and you should only trade with money you can afford to lose. Trading Forex and CFDs may not be suitable for all investors, so please ensure that you fully understand the risks involved and seek independent advice if necessary.
Disclaimer:
The above opinions given constitute general market commentary, and do not constitute the opinion or advice of IC Markets or any form of personal or investment advice.
Any opinions, news, research, analyses, prices, other information, or links to third-party sites contained on this website are provided on an "as-is" basis, are intended only to be informative, is not an advice nor a recommendation, nor research, or a record of our trading prices, or an offer of, or solicitation for a transaction in any financial instrument and thus should not be treated as such. The information provided does not involve any specific investment objectives, financial situation and needs of any specific person who may receive it. Please be aware, that past performance is not a reliable indicator of future performance and/or results. Past Performance or Forward-looking scenarios based upon the reasonable beliefs of the third-party provider are not a guarantee of future performance. Actual results may differ materially from those anticipated in forward-looking or past performance statements. IC Markets makes no representation or warranty and assumes no liability as to the accuracy or completeness of the information provided, nor any loss arising from any investment based on a recommendation, forecast or any information supplied by any third-party.

BTCUSD--SHORT--it seems BTCUSD will drop for short term at least.
--to see big picture check my weekly chart on my. account
--waiting for your comments

bitcoin epic pump...Bitcoin is accumulating strength before an epic pump,
in the truest sense of the word.
The statement that a local peak was seen before entering the Bitcoin euphoria zone is meaningless.
CRYPTOCAP:BTC

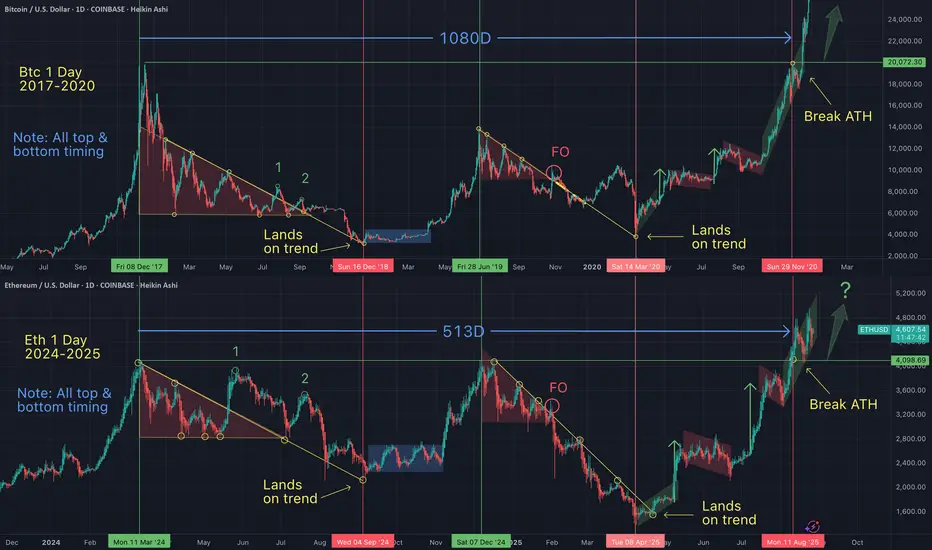
Eth - These chart patterns are repeating over & over If we learn to identify common patterns we will note that they are occuring over and over...on every asset (that has a chart)...on every timeframe. When in doubt, zoom out.
I can help you see the matrix.
Bitcoin: Wave 4 Unitl 108K Break.Bitcoin has just established a lower high in the 117K area. While this is a bearish sign for intraday time frames, the broader structure has yet to confirm a change. The change I am looking for is the price overlap of the 108K area. The 112 to 113 support area while some what broken, has not followed through yet. IF price stays in this range and manages to say above 108K, then this can still qualify as a wave 4. IF 108K breaks, then this confirms that the 5 wave structure is likely complete. If that's that case, the bigger picture outlook becomes more bearish.
The bearish scenario I am referring to is the broader Wave 2. Keep in mind, if this is the case, it can take a very long time to play out (months, years). And a series of catalysts would likely be in play. We have nothing like that yet. Also keep in mind, Bitcoin follows the Nasdaq, with lower interest rates, and easier monetary policy on the horizon, tech stocks are likely to benefit which should be a positive. Not a strong argument fundamentally. This is why if you are considering the short side, it is best to work on small time frames and keep risk tight in my opinion.
While any pull back is tempting to buy, this one is tricky because of the conflicting situation. 5 waves may be complete which means the pullbacks from here are more likely to break. Especially support levels that are obvious like 113K. Either work on smaller time frames like 1H or 4H and expect a smaller bite upon a signal confirmation, OR wait for the next level like the 105K to 108K area support for a swing trade with greater potential. Buy signals that confirm between 112 and 108K area could look to the 115 to 118K area for profit potential. It is touch to calculate when there is no confirmation on the chart.
Thank you for considering my analysis and perspective.
$BTC slipped under 108,906, keeping downside momentum alive. As CRYPTOCAP:BTC slipped under 108,906, keeping downside momentum alive. As long as it stays below 110K, next supports sit at 105K → 102K → 100K, with deeper risk toward 95K–90K.

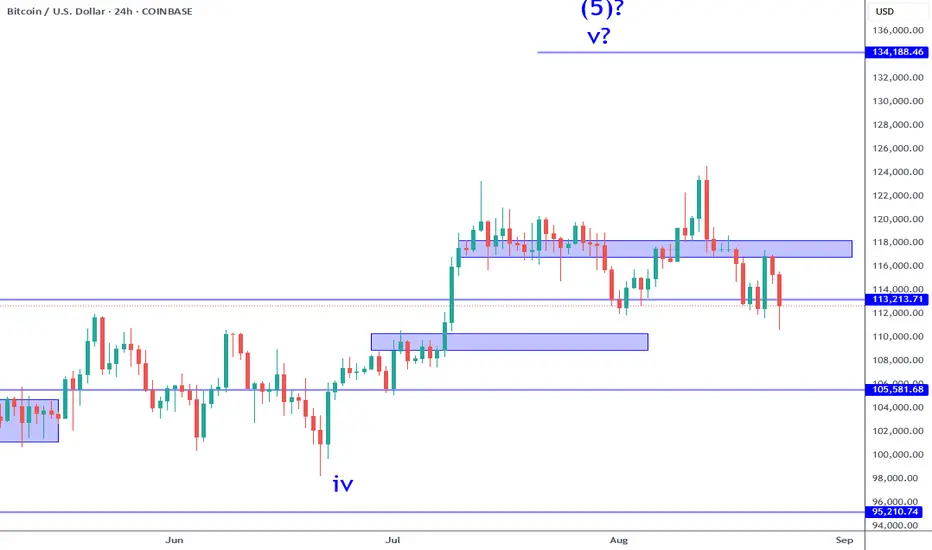
New Highs Ahead ? - BTCUSD Elliott Wave AnalysisHello Friends, Welcome to RK_Chaarts,
Today we are having Elliott wave theory counts on BTCUSD Bitcoin Chart Analysis
The weekly timeframe of the BTCUSD bitcoin chart reveals that we are unfolding Super Cycle Degree Wave (III) in Blue. This wave's sub-divisions, which should total five for a Cycle Degree, are visible. We've completed Waves I & II and begun unfolding Wave III in red.
Within Wave III, we are unfolding the 1st wave ((1)) of one lower degree as Primary (Black). This wave will unfold in five sub-divisions of one more lower degree as Intermediate degree in (Blue).
Daily Outlook:
On the daily outlook, we are currently unfolding wave (4) of Intermediate degree (Blue), a subdivision of wave ((1)) of Primary degree (Black). As wave (4) nears completion, a reversal is expected soon, driving prices toward new highs to complete wave (5) of ((1)).
Additional Support Confirmation:
Further reinforcing the analysis, the Anchored VWAP's Average is also showing support near 104,000. This confluence of support levels increases the likelihood of a reversal, making it an important level to watch for traders.
Key Takeaways:
- We're unfolding Cycle Degree Wave III on the weekly timeframe.
- Wave (4) of Intermediate degree is nearing completion on the daily outlook.
- A reversal is expected soon, driving prices toward new highs.
- Anchored VWAP also showing Support nearby current price.
Important Wave Theory Considerations:
As per wave theory, wave (4) shouldn't overlap wave (1), except in the case of diagonals and triangles. In this scenario, we are unfolding a diagonal, allowing wave (4) to enter into wave (1). However, it's crucial to note that wave (4) should not go beyond the low of wave (2) under any circumstances. If it does, our wave counts would be invalidated.
A Word of Caution:
Elliott Wave Theory and possible wave counts suggest that the price will make new highs on the chart soon. However, the market is inherently unpredictable and always ready to surprise. Therefore, it's essential to consider "what-if" scenarios in your trading journey.
Are we ready for new highs ?
As we navigate the complexities of the market, it's vital to remain adaptable and prepared for any eventuality. By acknowledging the potential for surprises and maintaining a flexible mindset, traders can better navigate the markets and make informed decisions.
Conclusion:
The BTCUSD bitcoin chart is poised for a reversal, driven by the completion of wave (4) and the subsequent unfolding of wave (5). While the analysis suggests new highs are on the horizon, it's essential to remain cautious and consider the unpredictability of the market. Are you prepared for the possibilities that lie ahead ?
I am not Sebi registered analyst.
My studies are for educational purpose only.
Please Consult your financial advisor before trading or investing.
I am not responsible for any kinds of your profits and your losses.
Most investors treat trading as a hobby because they have a full-time job doing something else.
However, If you treat trading like a business, it will pay you like a business.
If you treat like a hobby, hobbies don't pay, they cost you...!
Hope this post is helpful to community
Thanks
RK💕
Disclaimer and Risk Warning.
The analysis and discussion provided on in.tradingview.com is intended for educational purposes only and should not be relied upon for trading decisions. RK_Chaarts is not an investment adviser and the information provided here should not be taken as professional investment advice. Before buying or selling any investments, securities, or precious metals, it is recommended that you conduct your own due diligence. RK_Chaarts does not share in your profits and will not take responsibility for any losses you may incur. So Please Consult your financial advisor before trading or investing.
