Trading balanceTrading balance The price of the asset has rebounded from the balance zone. With the prospect of growth into the resistance zone.
BTCMINI trade ideas

Bitcoin Manipulation or Opportunity? Watch This Zone!⚡ Bitcoin Manipulation or Opportunity? Watch This Zone!
The chart highlights significant liquidity zones, BOS (Break of Structure), and liquidity sweeps, pointing to how price action is driven by institutional order flow.
🔎 Key Observations:
Break of Structure (BOS): Multiple BOS points confirm shifts in market direction as price transitioned from bearish → bullish → bearish again.
Liquidity Grab: Notice how price swept liquidity around previous support before reversing—classic manipulation to trigger stop losses before a move higher.
Downtrend Liquidity Channel: Price followed a controlled bearish liquidity channel after rejecting the resistance zone at 120,000 – 123,000, showing distribution.
Liquidity Sweep (Latest Move): The recent sweep near 108,000 suggests that sellers were trapped, providing liquidity for potential buy-side movement.
Projection: Based on the liquidity sweep, a rebound toward 116,000 – 118,000 is anticipated ⭐. However, interim resistance at 112,000 must be broken and retested to confirm bullish continuation.
⚠️ Risk Note: If price fails to hold above the liquidity sweep zone, a deeper correction could occur.
📌 Conclusion:
BTCUSD is showing signs of a bullish reversal after liquidity manipulation. Traders should watch for confirmation above 112,000 to target the 116,000 – 118,000 range, aligning with smart money concepts.

WARNiNG! BEAR!! BEAR!!! BEAR!!!!
* Elliott Wave Theory**
* Fibonacci retracement and extension**
* Fair Value Gaps (FVGs)**
* Bearish divergence**
* EMA levels (particularly 50 EMA and 100 EMA)**
Let's go through each timeframe:
---
🔹 **1-Week Timeframe (W1)**
Key Elements:
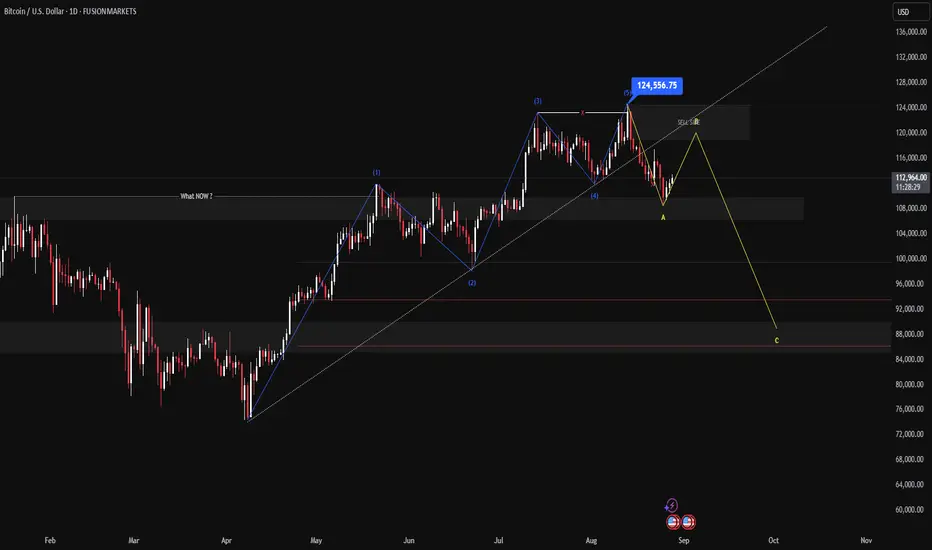
* Wave Count Complete: I'm confident I identified a completed 5-wave impulse structure (top at \~\$124k).
* **Bearish Divergence:** Both **MACD and RSI** are showing strong bearish divergence, suggesting momentum is waning.
* **Projected ABC Correction:**
* Wave **(A)** targets \~66k
* Wave **(B)** rebound to \~101k
* Wave **(C)** lands deep in the **FVG zone** (\~28k–38k), aligning with the 0.618–0.786 retracement zones.
#### Interpretation:
This suggests **a macro top is in**, and BTC is likely entering a **larger corrective phase**, with a full ABC move potentially unwinding the 2023–2025 bull rally.
---
🔹 **1-Day Timeframe (D1)**
Key Elements:
* Price broke down from wave ⑤ structure.
* **Below 50 & 100 EMA**, signaling short-term bearish trend.
* Fib retracement zones marked for the corrective move:
* 0.382 (109,169)
* 0.618 (99,572)
* 0.786 (92,741)
* **Projected path:**
* Drop to 99k
* Bounce to \~109k (wave B)
* Full move down to \~66–70k (Wave A target from W1)
Interpretation:
I'm anticipating a near-term retracement up (B wave) followed by continuation downward. EMA structure and FVG below support the idea of a **distribution top** being formed.
---
🔹 **4-Hour Timeframe (H4)**
Key Elements:
* Multiple **1hr FVGs** formed and targeted.
* Price losing support, heading toward:
* **4hr wick area**
* **.618 Fib**
* **1W EMA(50)** all clustering around 99k — strong confluence zone.
* Clean ABC path marked, first downward, then rebound up.
Interpretation:
I've marked **confluence around 99k** as a likely bounce zone — potential long scalp area before resumption of macro downtrend.
---
🔹 **1-Hour Timeframe (H1)**
Key Elements:
* 1hr FVG tested and rejected.
* Immediate support structure has been broken.
* Projecting drop to \~99k area (overlapping with 4hr FVG zone and .618).
Interpretation:
Short-term price is following my bearish roadmap. I've mapped out potential bounce-rejection-resumption patterns at key fib levels, focusing on **liquidity grabs and FVG fills**.
---
Technical Analysis Summary:
Timeframe Key Focus Direction Target Zones
1W Macro top, Bearish Divergence, 🔻 A: ~66k, C: ~28–38k
Wave ⑤ done
1D Correction Path (ABC forming) 🔻🔺🔻 A: ~99k, B: ~109k, C: ~66k
4HR Break from 1hr FVG, .618 confluence 🔻 Bounce at ~99k
1HR Immediate weakness, no support 🔻 Heading toward H4 confluence zone
🧠 Final Thoughts:
I'm anticipating a **multi-leg corrective move** after a completed macro impulse. The use of divergence, EMA confluence, FVGs, and Fibonacci levels makes this a very **well-aligned and disciplined** analysis.

Bitcoin / U.S. Dollar – 15m | Testing Equal Highs, Weekend Move
BTC is consolidating after a sharp downtrend and now pressing against equal highs. Market is coiling for a breakout move — decision point ahead.
**Bullish Scenario:**
* Hold above 108,400–108,600
* Break and close above 109,200
* Next target: 111,200 strong high and 112,400 OB
**Bearish Scenario:**
* Fail to clear 109,200
* Drop back under 108,400
* Downside target: 107,600 P1D Low and 105,200 rejection block
**Key Levels:**
* 109,200: Equal Highs / Breakout level
* 111,200: Strong High
* 112,400: Order Block (Supply)
* 108,400: Swing Low Support
* 107,600: P1D Low
* 105,200: Rejection Block
💬 BTC is coiling near equal highs — will bulls break through or sellers take it back to demand?

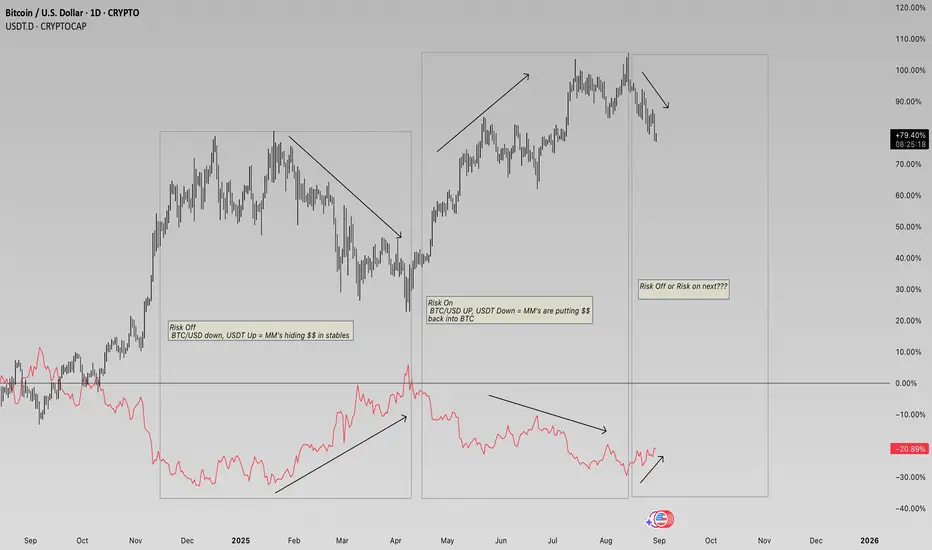
Study Correlation #BitcoinWhen BTC/USD is rising and USDT.D falls, that often signals risk-on behavior, as MM's are moving from stablecoins into Bitcoin.When BTC/USD falls and USDT.D rises, that signals risk-off, as people moving into stablecoins.
Bitcoin - The magical $1.000.000 level!🚀Bitcoin ( CRYPTO:BTCUSD ) is not done yet:
🔎Analysis summary:
Over the course of the past couple of months, we have been witnessing a bullish continuation on Bitcoin. After the all time high breakout, there is a high chance that this bullrun will continue and Bitcoin might even retest the resistance trendline at seven digits in the near future.
📝Levels to watch:
$1.000.000
SwingTraderPhil
SwingTrading.Simplified. | Investing.Simplified. | #LONGTERMVISION


BTC/USD Reversal Setup from Key Support Here's a **TradingView-compliant** short analytical description based on the provided **Bitcoin (BTC/USD) 4H chart**:
**BTC/USD – 4H Chart Analysis (BITSTAMP)**
Price recently broke down from a rising channel after reaching the **Major Resistance zone** near **\$124,500**. The current market is showing signs of consolidation near a strong **Support level** around **\$110,610**, which aligns with a 0.926 Fibonacci retracement.
A potential **bullish setup** is forming, with a possible entry around the current level (**\$112,915**), aiming for a recovery toward the **target zone near \$119,051**, just below the previous swing high.
A **pullback and retest** of the lower consolidation before moving higher is anticipated (as drawn). Key resistance to overcome is at **\$115,392**.
Key Zones
* **Support**: \$110,610
* **Entry (Zone)**: $112,915
* **Resistance**: \$115,392
* **Target**: \\$119,051
* **Invalidation**: Break and close below support may void this setup.

Bitcoin Tests Key Support as Market Eyes $132,000 TargetBitcoin (BTC) is testing its 0.618 Fibonacci retracement, a region in confluence with VWAP-SI support and the range-low channel. Bitcoin’s reaction here could define its path toward $132,000.
Bitcoin has reached a pivotal inflection point, consolidating around one of its most significant technical supports. The current zone aligns with the 0.618 Fibonacci retracement, VWAP-SI support, and the range-low boundary of its higher trend channel. Holding this region will be crucial, as a defense could set the stage for an aggressive push higher.
BITCOIN Price Technical Points:
- Critical Support Cluster: Confluence of 0.618 Fibonacci, VWAP-SI support, and channel range low.
- Structural Pivot: Holding this level maintains the bullish channel and uptrend momentum.
- Upside Target $132,000: A defense here opens the probability of rotation toward new all-time highs.
The confluence of Fibonacci retracement, VWAP-SI support, and channel structure makes the current support level one of the most important in Bitcoin’s recent history. Each of these indicators individually holds technical weight, but when aligned together, they form a region of strong demand. This makes the next few daily and weekly closes especially significant.
If Bitcoin can hold this zone, it would establish another higher low within the broader bullish channel. This would reinforce the market’s existing structure and provide a springboard for continuation. Conversely, a failure to defend this cluster would weaken the higher trend channel and shift focus toward deeper supports, undermining the bullish case in the short term.
The upside target for a successful defense lies at $132,000, where the next high-time frame resistance has been marked. This level represents not just a psychological milestone but also a structural cap aligned with Fibonacci extensions. Testing this region would effectively mean Bitcoin breaking into uncharted territory, further cementing its bullish trend.
What to expect in the coming price action:
If Bitcoin holds the confluence support on a closing basis, the probability of a rotation toward $132,000 increases substantially. Losing this region would threaten the bullish channel and open the door to corrective downside.

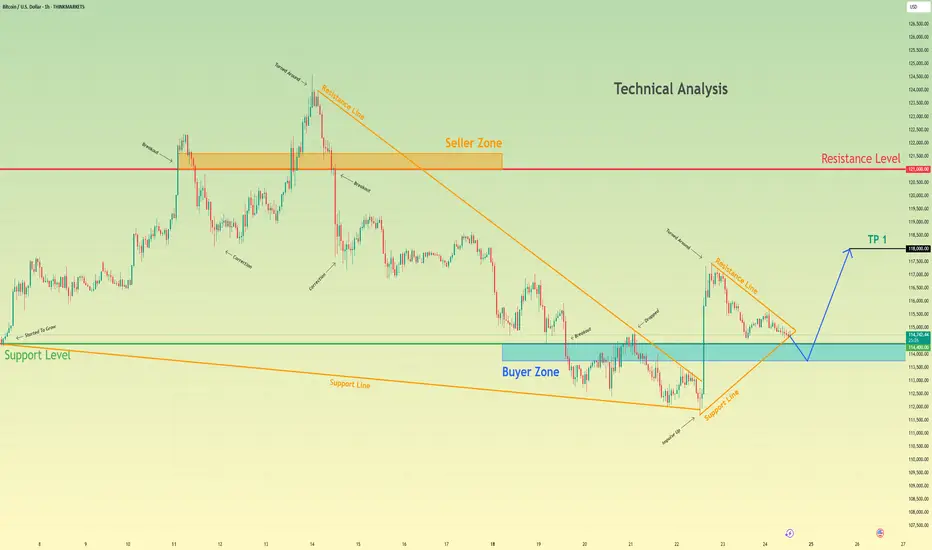
Bitcoin will exit of triangle and then bounce up from buyer zoneHello traders, I want share with you my opinion about Bitcoin. Following a decisive breakout from a prior downward wedge, Bitcoin entered a phase of balance and consolidation that is currently forming a symmetrical triangle. This new market environment signifies contracting volatility, with the price being methodically squeezed between a descending resistance line and an ascending support line. The asset has reached a critical juncture, as it is now at the apex of this formation, where the ascending support line converges with a strong horizontal support level at 114400. The primary working hypothesis is a long scenario, based on the expectation of a 'fake breakdown' or 'liquidity hunt'. It is anticipated that the price may briefly dip below the support line and into the buyer zone to trigger stops before staging a strong reversal. A swift reclaim of the 114400 level would be the ultimate confirmation of this bullish thesis, validating the original uptrend. This reversal is then expected to trigger a significant upward rebound. Therefore, the TP is logically placed at the 118000 level, as this represents a key area of prior price interaction and serves as a prudent first objective for a rally of this nature. Please share this idea with your friends and click Boost 🚀
Disclaimer: As part of ThinkMarkets’ Influencer Program, I am sponsored to share and publish their charts in my analysis.

BTCUSD: Medium-Term Downtrend in Play, Key Levels to Watch BTCUSD: 4 Hour Time Frame Analysis
Established Downtrend: After reaching a "Major Resistance - All time high" around 123,000−124,000 in mid-August, BTCUSD has clearly entered a descending channel, signaling a dominant bearish trend on this 4-hour timeframe.
Channel Bound Movement: The price has consistently respected the upper and lower boundaries of this descending channel, indicating that sellers are currently in control and any rallies are being met with selling pressure.
Current Consolidation Point: Bitcoin is currently consolidating around a horizontal support/resistance level near 112,000−113,000, which also sits within the descending channel, showing indecision at this level.
Immediate Resistance Ahead: For any significant upward movement to materialize, BTCUSD must decisively break above the "Current resistance 117K $" zone, which coincides with the upper trendline of the descending channel.
Critical Downside Support: Should the current consolidation fail and the price break lower from the descending channel, the next crucial support level to monitor is the red zone around 108,000−109,000, which has historically acted as a strong buying area.
Disclaimer:
The information provided in this chart is for educational and informational purposes only and should not be considered as investment advice. Trading and investing involve substantial risk and are not suitable for every investor. You should carefully consider your financial situation and consult with a financial advisor before making any investment decisions. The creator of this chart does not guarantee any specific outcome or profit and is not responsible for any losses incurred as a result of using this information. Past performance is not indicative of future results. Use this information at your own risk. This chart has been created for my own improvement in Trading and Investment Analysis. Please do your own analysis before any investments.

August 28 Bitcoin Bybit chart analysisHello
It's a Bitcoin Guide.
If you "follow"
You can receive real-time movement paths and comment notifications on major sections.
If my analysis was helpful,
Please click the booster button at the bottom.
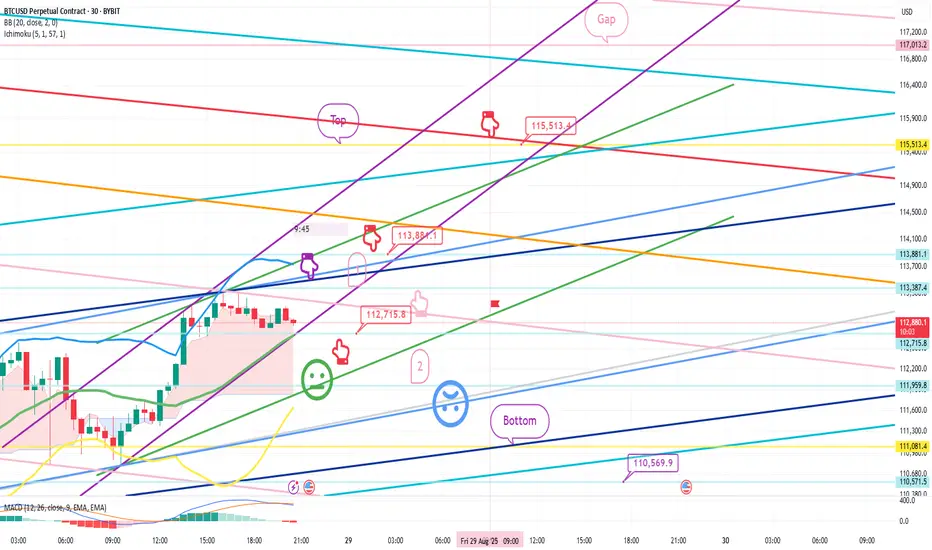
This is a 30-minute Bitcoin chart.
Although not visible on the screen,
I've used the same strategy as the long position entry point two days ago, at $109,950.4.
*If the red finger moves,
this is a conditional long position strategy.
1. After touching the first section at the top, the red finger indicates a long position entry point of $112,715.8. Stop-loss price if the green support line is broken.
(Since the purple finger touches the market, it's likely to immediately connect with an uptrend, so it's best not to open a short position. Check for an upward wave. Also, it's important to check whether the purple support line is broken first.)
2. Long position: $113,881.1. 1st target -> Top. 2nd target -> Target price up to the final gap.
If the price falls immediately without touching the purple finger at the top, hold for the final long position at section 2. Stop-loss price if the light blue support line is broken. Since the light blue support line is a mid-term uptrend line,
it's crucial for long positions not to break out today.
Below that, the bottom is open to $110.5K.
Up to this point, I ask that you use my analysis for reference only.
I hope you operate safely, with a focus on principled trading and stop-loss orders.
Thank you.
Bitcoin buy Soon as soon possibleBitcoin buy Soon as soon possible
The live Bitcoin price today is $111497.14 USD with a 24-hour trading volume of $64109128491.21 USD. We update our BTC to USD price in real-time.

Possible retracement to sell side order block Possible retracement to sell side order block and then ABC move to around 100K
After that is possible to get big pump to 130-145k.
LET'S SEE!!!
BTC: Fakeout → Pullback → Drop?Why:
Ichimoku: Price below Kumo, Tenkan < Kijun, future cloud down, Chikou below price → downside momentum.
Pullback into Drop-Base-Drop Supply / Bearish OB at 110.8k–111.6k + former support (109.8k–110.2k) → resistance (structure retest).
Weak rebound with small bodies/upper wicks = bear flag after the 30th dump; 28th move was a fakeout into new supply.
Key Levels
Resistance: 109.8k–110.8k (OB + Tenkan/Kijun), 111.6k (Kumo underside; invalidation).
Support: 108.6k → 107.2k → 105.8k.
Reason: Retest of OB/Supply under Kumo (continuation).
Flip Long (only if invalidated):
BUY only on clean H1/H4 close & retest above 111.6k → 112.8k / 114.0k targets; SL 110.8k.

BTCWe are bullish on BITCOIN as we are at the end of correction and ready for an impulsive move on it.

BRIEFING Week #34 : The Rotation may have BegunHere's your weekly update ! Brought to you each weekend with years of track-record history..
Don't forget to hit the like/follow button if you feel like this post deserves it ;)
That's the best way to support me and help pushing this content to other users.
Kindly,
Phil

BTCUSD – Bearish Setup.Price tapped into the supply zone (112,600 – 112,800) after a corrective channel move.
Now rejecting with exhaustion wicks.
🔻 Bias: Short
Rising channel → likely to break downside.
Supply zone rejection confirms weakness.
Targeting 110,150 zone (major liquidity level).
📉 Plan
Sell from current supply rejection.
SL above 113,000.
TP at 110,150.
⚠️ Watch for fakeouts inside channel before strong drop.

BITCOINS CORRECTION IS LIKELY OVER!1). The price is hitting huge support! 2). POWELL has opened the door for an interest rate cut! 3). Bitcoin is possibly on its way to $150,000.00!


BTCUSD H1: Will Bitcoin Break 108,000 to Return to 105,000?🔎 H1 chart analysis (swing trade)
1. Overall trend:
➡️ BTC is in a short-term downtrend (continuously creating lower highs and lower lows).
➡️ The sharp drop at the end of the chart shows that the sellers are dominating.
2. Important resistance zone (to watch if the price recovers)
➡️ Around 112,800 – 113,200 (recent peak).
➡️ Around 111,500 – 111,800 (intermediate resistance).
3. Important support zone (price reaction may appear)
➡️ 108,000 – 108,500 (current price is testing).
➡️ If this zone is broken, the next support is at 106,500 – 107,000.
4. Swing trading scenario for the next few days:
➡️ Bearish scenario (priority): If BTC breaks through 108,000 and closes the H1 candle below, it is likely to continue to fall to 106,500 → 105,000.
➡️ Short-term bullish recovery scenario: If the price rebounds from the 108,000 - 108,500 zone, it may retrace to test the resistance at 111,500 → 113,000 before continuing to fall.
