BITCOIN Bearish Breakout!
HI,Traders !
#BITCOIN made an epic
Bearish breakout of a very
Strong key horizontal level
Of 112340.5which is now a
Resistance and the breakout
Is confirmed so we are
Bearish biased and we will
Be expecting a further
Bearish move down !
Comment and subscribe to help us grow !
BTCMINI trade ideas

TheKing Ways Up- Some Traders are still waiting for lower prices.
- But to go lower BTC must first go higher.
- TheKing is in transition phase : " Bearish to Bullish ".
- Some retracements have to happen on the way up.
- Some Fuds have to happen on the way up to create those retracements.
- Today CPI results could impact a bit the trend ( Stocks + Cryptos ).
- Notice on the Graph MA50/MA20 (4D) will cross up soon
- Those MAs will create some new support zones.
- This Graph is just based on comparison between 2018-2020 // 2020-2022 and an eventual " Story Repeat ".
- Covid19 Black Swan included.
- Just follow the Circles and keep it simple.
Happy Tr4Ding !

Bitcoin (BTC/USD) – Key Levels & Outlook🔎 Market Overview
Bitcoin has recently shown increased volatility, with sellers regaining control after a brief consolidation phase. On the 1H chart, BTC is currently trading around 109,640 USD, retesting a major short-term support zone.
🧭 Key Observations
Support Zone:
Primary support sits between 109,000 – 109,500.
A breakdown below this area could open the way toward 107,800 – 108,000.
Resistance Zone:
First resistance at 111,000 – 111,500.
Stronger supply zone near 113,500 – 114,000.
Trend & Momentum:
Momentum indicators are showing increasing bearish pressure.
Sellers are pushing the market lower after failure to hold above 112k.
🔮 Possible Scenarios
Bullish Reversal
If BTC defends the 109k zone and forms a bullish reversal (engulfing candle, divergence, or strong volume reaction), a recovery toward 111k – 112k is possible.
Bearish Continuation
If BTC loses 109k support, it may accelerate down to 108k – 107.8k, where the next strong demand zone lies.
✅ Trading Plan (for idea sharing, not financial advice)
Watch how BTC reacts at the 109k level.
Look for a bounce confirmation for long entries targeting 111k.
A clean breakdown may offer short opportunities into 108k.
💡 Conclusion:
BTC is at a critical decision point. The 109k support will decide whether we see a short-term relief rally or another leg down. Traders should stay cautious and wait for confirmation before entering positions.

Bitcoin longEntry 108300$
Sl 107300.
That is my invalidation for this long position .
I think a push to the upside will commence during the upcoming week.

BTCUSD POSITION.Chart Analysis
The BTC/USD chart on the 15-minute timeframe shows that the price has been trading in a range, with a key support level around $108,200 to $108,300. A significant resistance level is visible at the recent high around $109,400. The current price is hovering just above the support zone.
Potential Trade Plans
Scenario 1: Bullish (Price Bounces from Support)
Entry: Consider entering a long (buy) position if the price shows a strong bullish candle confirming the support level around $108,300.
Stop-Loss: Place a stop-loss order just below the support zone, for example, at $108,150, to protect against a downside breakout.
Take-Profit (Target): The first target could be the minor resistance around $108,800, with a more ambitious target at the recent high of $109,400.
Scenario 2: Bearish (Price Breaks Below Support)
Entry: Consider a short (sell) position if the price breaks decisively below the $108,200 support level with strong bearish momentum.
Stop-Loss: A stop-loss should be placed just above the broken support level, for example, at $108,400, to limit potential losses.
Take-Profit (Target): The target for this move would be the next lower support level, which appears to be around $107,300 to $107,400.

Btcusd buy from support zone with money mangment if the support holds a bulish continuation is highly likely.

Sell Plan – BTCUSDSell Plan – BTCUSD
Entry planned around 109,500 zone after price tapped supply and showed rejection.
Stop Loss will be kept above the rejection area (109,600 – 109,700) to stay safe.
First target at 108,500 liquidity level, where price may react.
Second target at 106,400 – 106,300 swing low, aiming for deeper liquidity.
Narrative: Market swept upside liquidity, tapped into premium supply, and rejected strongly, giving confirmation for a sell.

btc some profit under very hard times to stay over 110ka very good chance to get some , target is not 100, could be higher or lower, but stop lose is perfectly made, and tight


Bitcoin Strategy SharingThe market was relatively quiet over the weekend due to low trading interest. The overall volatility was minimal, and there wasn't much room for maneuver. I previously recommended opening a long position below 108,000. The price has now reached my expected level, around 110,000. For those who followed my lead, please pay attention to your positions. If you are prudent and conservative, you can reduce your holdings and wait to see if the market breaks through this level.
Bitcoin Strategy
The weekend market didn't fluctuate much, so you can choose not to trade and enjoy the weekend. You don't need to seize every ups and downswing. If you do decide to trade, I still recommend opening long positions on pullbacks. You can stick with my previous strategy and open long positions below 108,000. For bearish short positions, I think you should consider opening above 111,000. If the rebound isn't strong, there won't be much room for decline.
My thoughts are for reference only. Your specific trading decisions will be based on your own circumstances.

BTC Long
Support
Bottom of my imaginary 'grid'
Revenge
Do the opposite of what I do. ALWAYS
Enter buy limit order at $108,629

BTCUSD- UpdateLooking for re-entry opportunities:
On a retest of support at 108,668 zone for continuation to the upside.
Or on a break and retest of resistance around 109,600 – 110,000 for further bullish momentum.
Targets toward the 110,800 zone if price holds above support.

BTC price analysis for SeptemberWith ICC we read what price is telling us and we act accordingly.
After the ranging sideways zone, price has given the bearish indication, went up to take the shorts above 122k then pushed back down.
The trend is still bearish, 1h,4h and Daily both MACD and RSI are still bearish.
The support from 105k to 106k has held price before so it could be where BTC reverses and strong buys will step in OR it fails to hold and we head further down. We don't try to predict.

BTCusdBTC is attempting to move higher after finding support around the Fibonacci golden ratio on the M30 and H1 timeframes. Price action suggests a potential continuation if support holds.

Why Bitcoin (BTC) Will Likely Fill the Downside Imbalance After Bitcoin just made a sharp move up, liquidating short positions across the board — but if you think the pump is here to stay, think again. Let’s break down why BTC may be headed right back down to fill the imbalance it just created.What we just witnessed was a classic liquidity grab. Retail traders piling in with shorts at the local highs created a liquidity pool — and smart money took advantage. The sudden push up wasn’t organic; it was engineered to stop out shorts, triggering a cascade of liquidations and buy stops.But here's the key: in doing so, BTC left behind a significant imbalance — or Fair Value Gap — to the downside. If you're not familiar, imbalances are areas on the chart where price moved too quickly in one direction, leaving low-volume zones with inefficient pricing. These gaps tend to get filled more often than not, because the market seeks equilibrium. After a liquidity grab, smart money usually has no reason to sustain the move immediately — instead, they want to mitigate risk. That often means bringing price back to re-test the origin of the move and fill in the inefficient price action — especially if there’s confluence with a previous demand zone or breaker block.Don’t get caught chasing the pump. Remember, smart money moves in layers — liquidity grabs, imbalance fills, and then continuation. Until that downside inefficiency is addressed, the move isn’t complete.

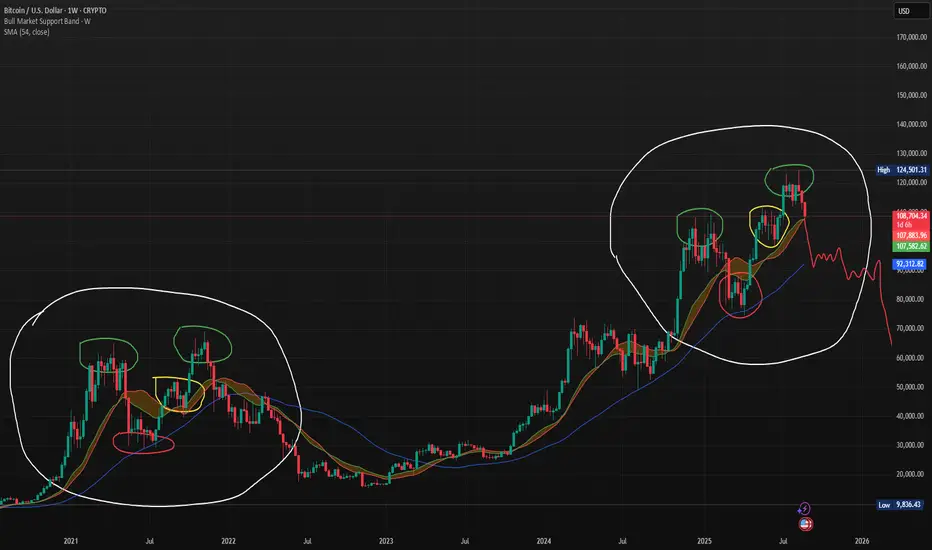
Bitcoin Weekly Chart – Is the 4 Year Cycle Over?This chart compares Bitcoin’s current weekly price action to its 2021 market structure. Both periods show striking similarities: double-top patterns (green circles), mid-cycle consolidations (yellow highlights), and support retests (red circles) within the bull market support band. The projection in red outlines a potential bearish scenario, where BTC could follow a similar path to the last cycle—breaking below support and entering a prolonged corrective phase. Traders should watch the $92K SMA and bull market support band closely as critical levels for trend confirmation.
Bitcoin at \$105,000Bitcoin’s sharp decline is still ongoing, and it will likely drop to the \$105,000 zone. If a strong support doesn’t form there, we might even see Bitcoin at \$100,000.

Bitcoin / U.S. Dollar – 15m | Testing Equal Highs, Weekend Move
BTC is consolidating after a sharp downtrend and now pressing against equal highs. Market is coiling for a breakout move — decision point ahead.
**Bullish Scenario:**
* Hold above 108,400–108,600
* Break and close above 109,200
* Next target: 111,200 strong high and 112,400 OB
**Bearish Scenario:**
* Fail to clear 109,200
* Drop back under 108,400
* Downside target: 107,600 P1D Low and 105,200 rejection block
**Key Levels:**
* 109,200: Equal Highs / Breakout level
* 111,200: Strong High
* 112,400: Order Block (Supply)
* 108,400: Swing Low Support
* 107,600: P1D Low
* 105,200: Rejection Block
💬 BTC is coiling near equal highs — will bulls break through or sellers take it back to demand?

Bitcoin Strategy: Oversold Rebound Looking at 110,000Bitcoin has been undergoing continuous adjustments, with a significant downward trend. The recent strategy of shorting with the trend is correct.
In the short term, the market has fallen below the 110,000 mark, suggesting a potential rebound after an oversold period. Consider opening long positions below 108,000. A rebound is expected in the short term, with the initial target at 110,000.

Bitcoin Confirms Downtrend – Short Bias in PlayBitcoin Confirms Downtrend – Short Bias in Play
Hello traders,
BTC has shown strong bearish momentum, breaking below a key support and falling out of the rising channel. With price now holding firmly beneath this area, the downtrend has been confirmed.
The focus now is on waiting for a pullback to find better short entries. The 111k level is a key zone to watch, where a retest of the broken channel could provide an ideal entry, creating a clean Dow structure for further downside.
Short scenario: Entry around 111k, with a target near 105k.
Long reaction trade: Around 105k, a small long can be considered to capture a short-term bounce as liquidity is absorbed, also offering relief for any trapped short positions.
The medium-term bias remains firmly bearish until structure changes.
That’s my perspective on BTC going forward. Manage risk carefully and share your thoughts in the comments – do you see further downside or a potential reversal?

Bitcoin - Inflows Whisper Calm, Structure Awaits Discipline.⊣
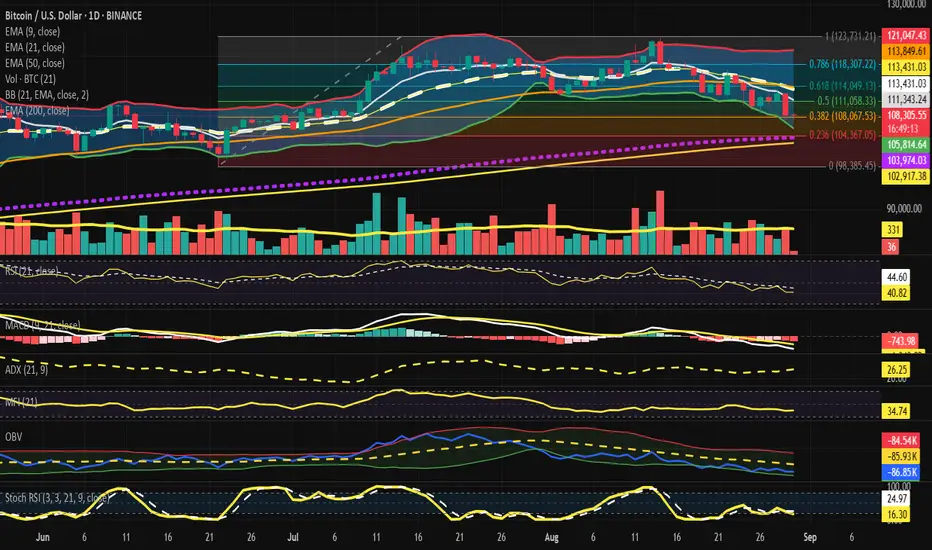
⟁ BTC/USD – BINANCE – (CHART: 1D) – (Aug 30, 2025).
◇ Analysis Price: $108,377.41.
⊣
⨀ I. Temporal Axis – Strategic Interval – (1D):
▦ EMA9 – $111,357.61:
∴ Price remains below EMA9, confirming immediate bearish control;
∴ EMA9 has flipped into dynamic resistance after multiple failed retests;
∴ Short-term recovery requires a clean daily close above EMA9.
✴️ Conclusion: EMA9 acts as near-term resistance, bearish short bias intact. Logic sealed.
⊢
▦ EMA21 – $113,437.56:
∴ EMA21 aligns with Fib 0.618 ($114,049), forming a resistance cluster;
∴ Persistent rejection since Aug 21 emphasizes mid-term weakness;
∴ Reclaiming EMA21 is the first real bullish trigger.
✴️ Conclusion: EMA21 = critical pivot to shift from bearish to neutral. Logic sealed.
⊢
▦ EMA50 – $113,852.43:
∴ Slightly above EMA21, adding weight to the $113.4 / 113.9k resistance zone;
∴ Until broken, this confluence acts as a bearish supply wall;
∴ A reclaim here reopens upside toward Fib 0.786 ($118.3k).
✴️ Conclusion: EMA50 reinforces resistance cluster. Logic sealed.
⊢
▦ EMA200 – $102,917.45:
∴ Long-term fortress, still untested in this cycle;
∴ Confluence with Fib 0.236 ($104,367) = macro defense zone;
∴ Bears’ ultimate target if current supports give way.
✴️ Conclusion: EMA200 stands as macro citadel. Logic sealed.
⊢
▦ Bollinger Bands (21, 2) – $121,042 / $113,437 / $105,833:
∴ Price riding lower band at $105.8k;
∴ Bands widening = volatility expansion with bearish tilt;
∴ Failure to revert to midline confirms continuation risk.
✴️ Conclusion: Bands highlight bearish volatility regime. Logic sealed.
⊢
▦ RSI (21, 9) – 40.90 / 44.62:
∴ RSI below neutral 50, momentum bearish;
∴ Not oversold (<30), leaving room for more downside;
∴ No bullish divergence present.
✴️ Conclusion: RSI validates sellers’ momentum. Logic sealed.
⊢
▦ MACD (9, 21, 9) – Line: –2,079.96 / Signal: –1,342.25 / Histogram: –737.71:
∴ Bearish cross intact below zero-line;
∴ Histogram remains deeply negative, no sign of contraction;
∴ Momentum acceleration still favors bears;
✴️ Conclusion: MACD entrenched in bearish phase. Logic sealed.
⊢
▦ ADX (21, 9) – 26.25:
∴ Above 25 confirms trend strength;
∴ With DI– dominance, direction is bearish;
∴ Indicates continuation rather than reversal.
✴️ Conclusion: ADX confirms strengthening bearish trend. Logic sealed.
⊢
▦ MFI (21) – 34.75:
∴ Below 50 = capital outflows dominate;
∴ No oversold signal (<20) yet;
∴ Market still has selling pressure capacity.
✴️ Conclusion: MFI aligns with distribution bias. Logic sealed.
⊢
▦ OBV (21, BB2) – (–86.84K):
∴ OBV trending lower, confirming distribution;
∴ Volume does not show accumulation footprint;
∴ Confirms sellers dominate liquidity.
✴️ Conclusion: OBV validates distribution regime. Logic sealed.
⊢
▦ Stoch RSI (3, 3, 21, 9) – K: 16.30 / D: 24.97:
∴ In oversold territory (<20);
∴ No confirmed bullish crossover yet;
∴ Relief bounce possible if crossover occurs.
✴️ Conclusion: Oversold condition may allow relief, but not structural reversal. Logic sealed.
⊢
▦ Fibonacci Retracements (0 = $98,385 -> 1 = $123,731):
0.786 -> $118,307 – (upper resistance);
0.618 -> $114,049 – (current battlefield, confluence EMA21/50);
0.500 -> $111,058 – (reclaim point for neutralization);
0.382 -> $108,067 – (current support pivot);
0.236 -> $104,367 – (deeper target, near EMA200).
✴️ Conclusion: Market clings to 0.382; Loss exposes 0.236 + EMA200 fortress; Logic sealed.
⊢
🜎 Strategic Insight - Technical Oracle:
∴ Short-term structure: price pinned under EMA9 and EMA21/50 cluster, bearish dominance confirmed;
∴ Momentum: RSI below 50, MACD negative, ADX >25 = sellers in control;
∴ Capital flows: MFI <50, OBV falling = distribution not yet exhausted;
∴ Only counterpoint: Stoch RSI oversold; potential for technical bounce, not structural reversal.
✴️ Conclusion: The battlefield is 0.382 Fib ($108k). Bulls must reclaim $111k -> $113.4k to neutralize; failure drags price toward ($104 / 103k). Logic sealed.
⊢
∫ II. On-Chain Intelligence - (Source: CryptoQuant):
▦ Exchange Inflow Total + EMA9 - (All Exchanges):
∴ Current inflow readings remain low-to-moderate, no spikes comparable to 2022 capitulation phases (>200K BTC);
∴ EMA9 of inflows trending stable/declining since Q2 2025;
∴ Lack of exchange deposits suggests no broad panic selling.
✴️ Conclusion: Inflows do not confirm capitulation; sellers are present but not aggressive. Logic sealed.
⊢
▦ Historical Context:
∴ Spikes above ~150K BTC inflow (e.g. 2022–2023) correlated with sharp price drawdowns;
∴ 2024–2025 shows inflows mostly <50K BTC/day, even during corrections;
∴ Current cycle corrections appear orderly rather than panic-driven.
✴️ Conclusion: Current inflow regime supports controlled distribution, not mass liquidation. Logic sealed.
⊢
▦ Liquidity Implications:
∴ Absence of exchange inflow surges implies supply pressure limited to tactical sellers;
∴ On-chain wallets continue holding, whales not rushing coins into exchanges;
∴ Technical breakdowns (EMA clusters, Fib 0.382) would require derivative/liquidation cascades rather than spot-led panic.
✴️ Conclusion: Structural downside must be driven by futures leverage, not spot panic flows. Logic sealed.
⊢
𓂀 Stoic-Structural Interpretation and On-Chain Oracle:
∴ Structure: EMA stack inverted; Fib 0.382 ($108k) = present bastion; EMA200 ($103k) = macro citadel;
∴ Momentum: RSI, MACD, ADX in alignment with descent, affirming stoic acceptance of downward will;
∴ Capital Flow: OBV and MFI declare liquidity leaving, distribution sealing bearish fate;
∴ Oracle: Oversold Stoch RSI whispers of fleeting respite, not salvation;
∴ Structure of Flow: Unlike past cycles, inflow discipline holds; coins remain largely in cold storage;
∴ Momentum of Will: Market decline is technical, not yet forced by whales. Bears act by structure, not by panic;
∴ Fate of Distribution: Without inflow surges, spot-driven capitulation remains unlikely; path to $103K relies on derivative liquidation.
⊢
✦ Structure Thus:
∴ The market embodies stoic compression;
∴ Only a reclaim >$113.4k reopens neutrality;
∴ Loss of $108k pulls destiny to ($104 / 103k);
∴ Fate sealed in bearish compression, awaiting expansion - logic sealed;
∴ On-chain inflows confirm the absence of mass panic;
∴ Technical charts dominate destiny;
∴ Bears have structure, but not yet blood;
∴ Bulls retain a chance if they defend $108K with low inflows sustained.
⊢
⚚ Unified Insight (Technical + On-Chain):
∴ Technical: Bitcoin clings to Fib 0.382 ($108K); failure = ($104 / 103K). Momentum + OBV favor bears.
∴ On-Chain: No whale capitulation; inflows remain muted, meaning downside is not spot-led.
✴️ Consequence: If inflows stay low, bulls may engineer a bounce at $108K -> $111K. If derivatives trigger cascade, EMA200 ($103K) becomes the stoic fortress.
⊢
· Cryptorvm Dominvs · MAGISTER ARCANVM · Vox Primordialis ·
· Dominivm Cardo Gyratio Omnivm · Silence precedes the next force. Structure is sacred ·
⊢
BTC HTF ANALYSISAs we can see in daily time frame market is strong bearish if any 4H candle will close above 108900 then on a retest we can look for buys till next retest which is near about 1130000 and all sell side liquidities had been done except 107270 which is still pending so market can keep it for future or can hunt and continue towards hunt sell side liquidity.
